. 2020 May;8(1):e000277.
doi: 10.1136/jitc-2019-000277.

Endogenous TLR2 ligand embedded in the catalytic region of human cysteinyl-tRNA synthetase 1

Affiliations

Endogenous TLR2 ligand embedded in the catalytic region of human cysteinyl-tRNA synthetase 1

Seongmin Cho et al. J Immunother Cancer. 2020 May.

Abstract

Background: The generation of antigen-specific cytotoxic T lymphocyte (CTL) responses is required for successful cancer vaccine therapy. In this regard, ligands of Toll-like receptors (TLRs) have been suggested to activate adaptive immune responses by modulating the function of antigen-presenting cells (APCs). Despite their therapeutic potential, the development of TLR ligands for immunotherapy is often hampered due to rapid systemic toxicity. Regarding the safety concerns of currently available TLR ligands, finding a new TLR agonist with potent efficacy and safety is needed.

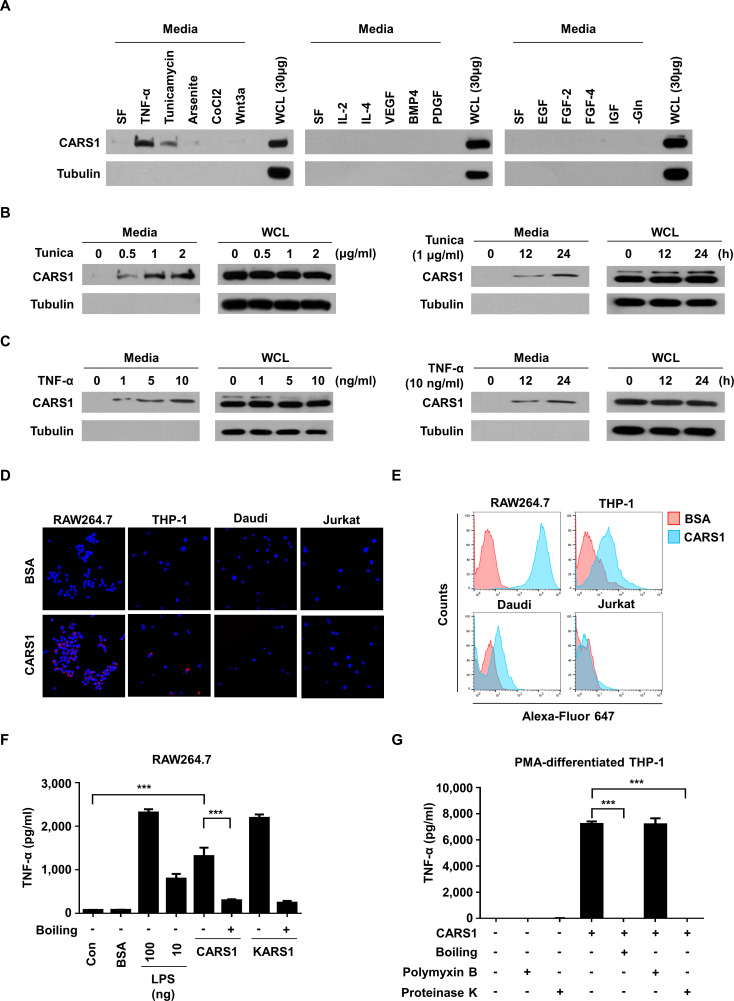
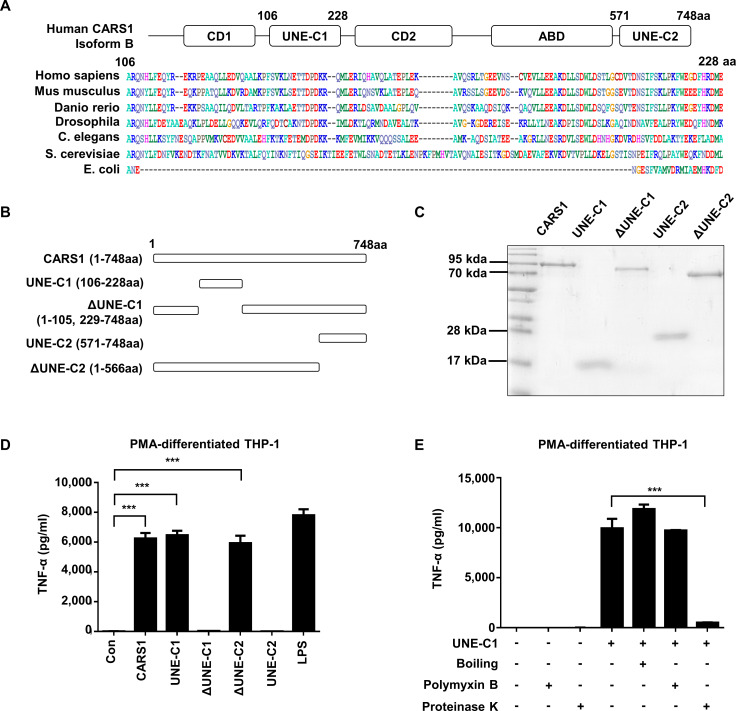
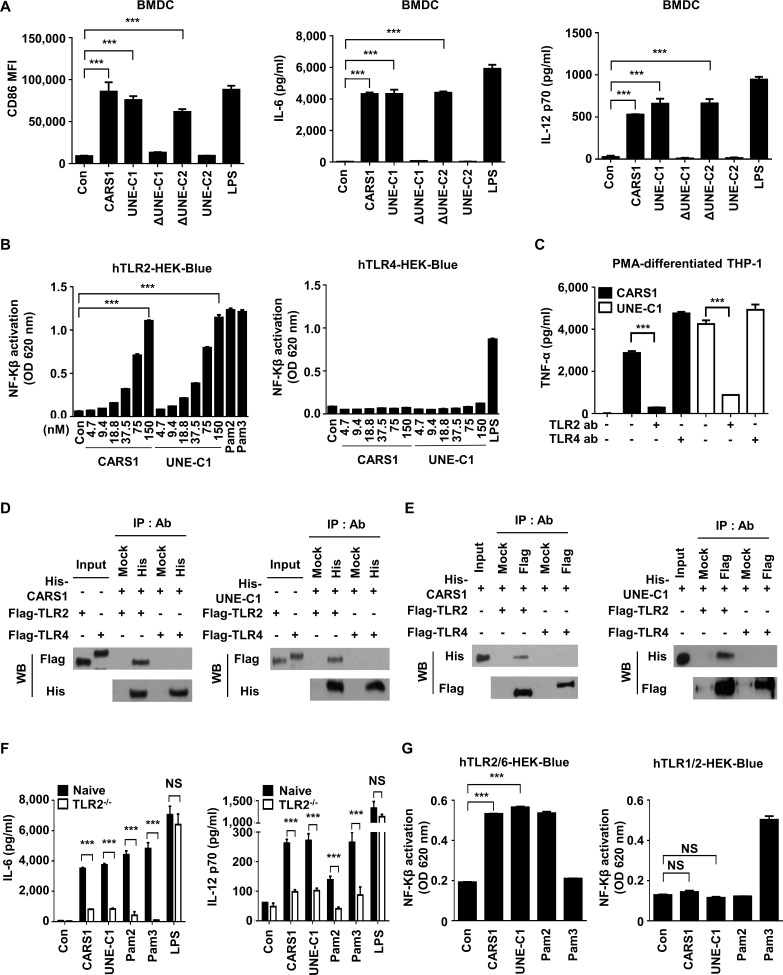
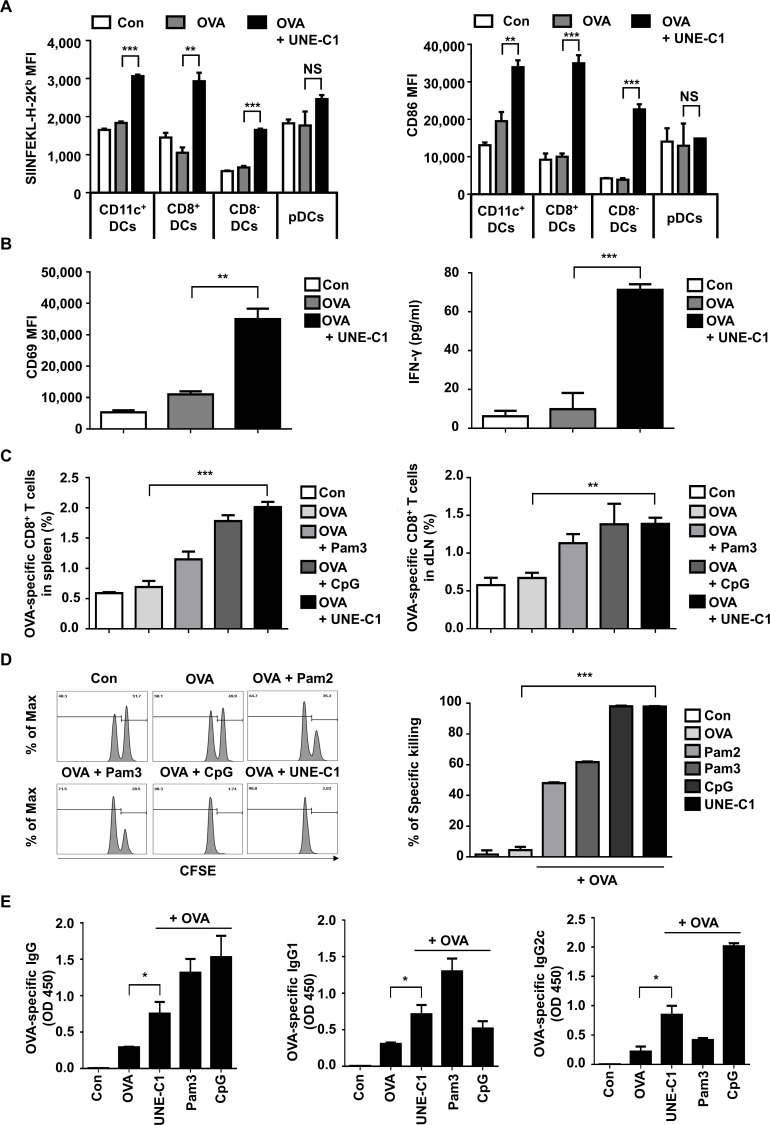
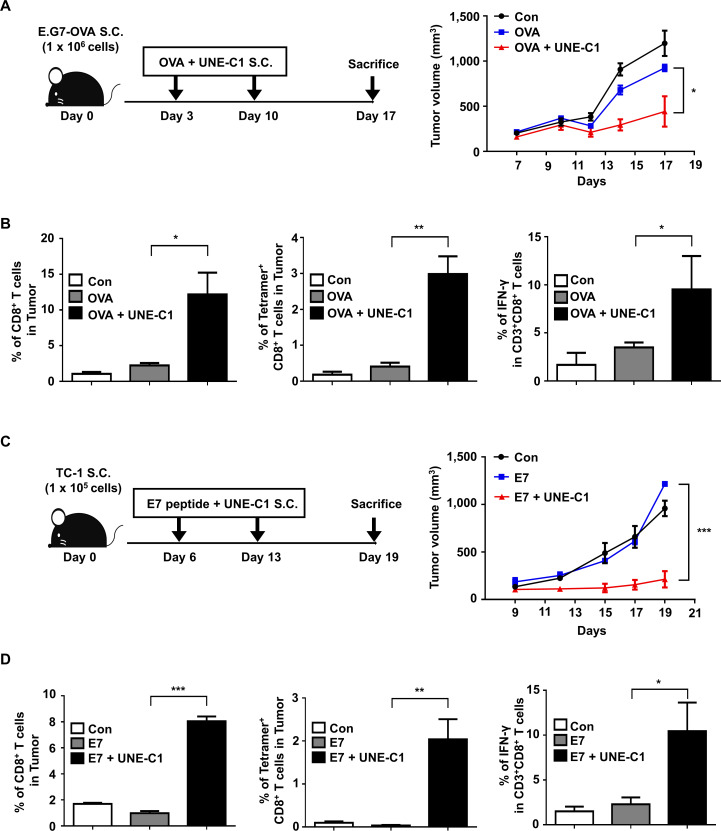
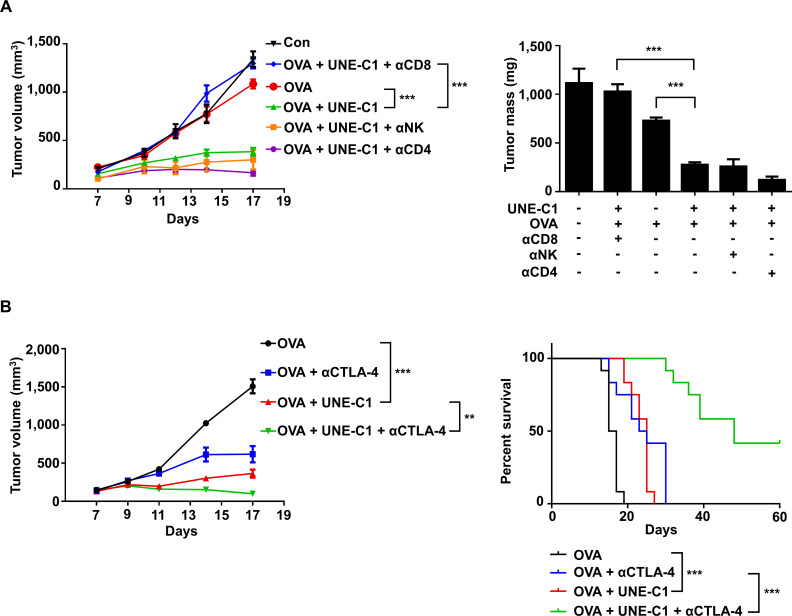
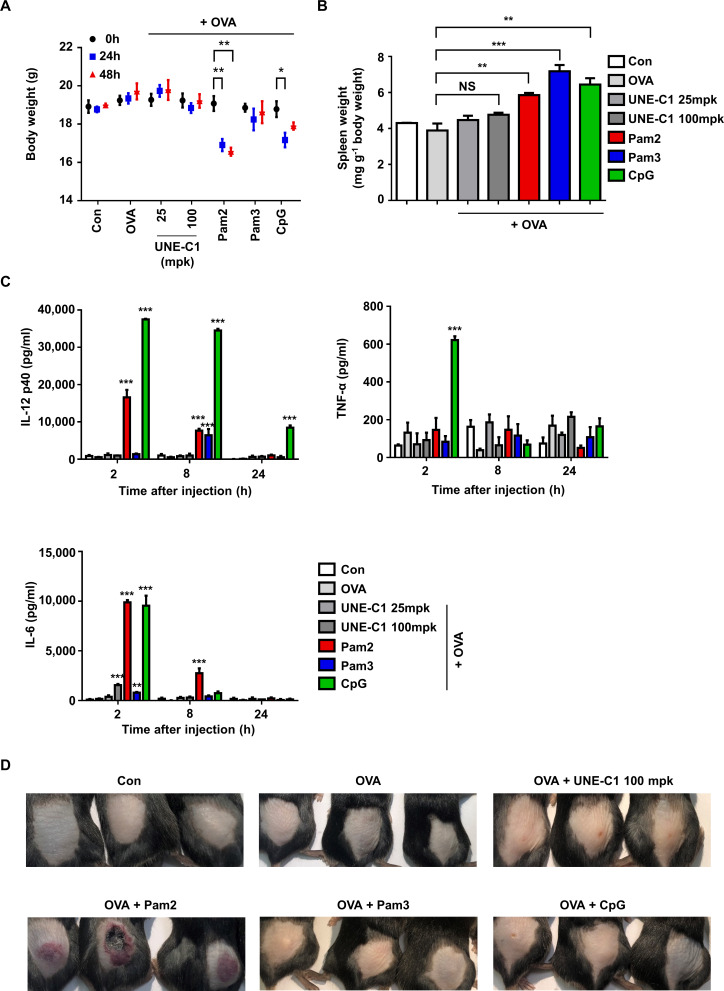
Methods: A unique structural domain (UNE-C1) was identified as a novel TLR2/6 in the catalytic region of human cysteinyl-tRNA synthetase 1 (CARS1) using comprehensive approaches, including RNA sequencing, the human embryonic kidney (HEK)-TLR Blue system, pull-down, and ELISA. The potency of its immunoadjuvant properties was analyzed by assessing antigen-specific antibody and CTL responses. In addition, the efficacy of tumor growth inhibition and the presence of the tumor-infiltrating leukocytes were evaluated using E.G7-OVA and TC-1 mouse models. The combined effect of UNE-C1 with an immune checkpoint inhibitor, anti-CTLA-4 antibody, was also evaluated in vivo. The safety of UNE-C1 immunization was determined by monitoring splenomegaly and cytokine production in the blood.

Results: Here, we report that CARS1 can be secreted from cancer cells to activate immune responses via specific interactions with TLR2/6 of APCs. A unique domain (UNE-C1) inserted into the catalytic region of CARS1 was determined to activate dendritic cells, leading to the stimulation of robust humoral and cellular immune responses in vivo. UNE-C1 also showed synergistic efficacy with cancer antigens and checkpoint inhibitors against different cancer models in vivo. Further, the safety assessment of UNE-C1 showed lower systemic cytokine levels than other known TLR agonists.

Conclusions: We identified the endogenous TLR2/6 activating domain from human cysteinyl-tRNA synthetase CARS1. This novel TLR2/6 ligand showed potent immune-stimulating activity with little toxicity. Thus, the UNE-C1 domain can be developed as an effective immunoadjuvant with checkpoint inhibitors or cancer antigens to boost antitumor immunity.

Keywords: adjuvants, immunological; immunology; oncology; vaccination.


Conflict of interest statement

Competing interests: None declared.

Figures

Figure 1
Figure 1
Effect of secreted CARS1 on TNF-α secretion from macrophages (A) CARS1 secretion was tested by incubating HCT116 cells under different conditions, including SF, TNF-α (10 ng/mL), tunicamycin (1 µg/mL), arsenite (12.5 µM), CoCl2 (100 µM), Wnt3a (200 ng/mL), IL-2 (10 ng/mL), IL-4 (10 ng/mL), VEGF (20 ng/mL), BMP4 (50 ng/mL), PDGF (100 ng/mL), EGF (100 ng/mL) FGF-2 (50 ng/mL), FGF-4 (50 ng/mL), IGF (50 ng/mL), and glutamine-free conditions for 24 hours. The amount of CARS1 secreted in the medium and WCL was detected. (B) HCT116 cells were treated with tunicamycin (Tunica) in dose-dependent and time-dependent manners. Proteins in the medium were precipitated and detected by an antibody against CARS1. (C) HCT116 cells were treated with TNF-α in dose-dependent and time-dependent manners to detect secreted CARS1. (D, E) CARS1 and BSA were conjugated with Alexa-Fluor 647 and treated for 30 min to different cell types. CARS1-bound cells were visualized and analyzed by confocal microscopy (D) and flow cytometry (E), respectively. (F) RAW264.7 cells were treated with either 100 nM of CARS1 or KARS1 for 4 hour. Boiled CARS1 and KARS1 were used for negative controls. (G) The production of TNF-α was measured by ELISA after treating 100 nM of CARS1 on PMA-differentiated THP-1 cells. CARS1 was preincubated with proteinase K (50 µg/mL) or boiled for 1 hour. Before adding CARS1, some cells were preincubated with polymyxin B (10 µg/mL) for 1 hour. Data are representative of three independent experiments. Results are presented as mean±SD, and statistical significance was analyzed with Student’s t-test (***p<0.001). BSA, bovine serum albumin; BMP4, bone morphogenetic protein 4; CARS1, cysteinyl-tRNA synthetase 1; IL, interleukin; LPS, lipopolysaccharide; PDGF, platelet-derived growth factor; PMA, phorbol 12-myristate 13-acetate; SF, serum-free; TNF-α, tumor necrosis factor alpha; VEGF, vascular endothelial growth factor; WCL, whole-cell lysate.
Figure 2
Figure 2
Determination of UNE-C1 as the activity determinant. (A) Multiple sequence alignment comparing UNE-C1 sequences from different species. (B) Schematic demonstration of CARS1 fragments containing the full-length, two unique domains (UNE-C1 and UNE-C2), and the full-length without UNE-C1 and UNE-C2 (ΔUNE-C1 and ΔUNE-C2). (C) Purified CARS1 and its fragments CARS1 were stained by Coomassie blue. (D) PMA-differentiated THP-1 cells were treated with CARS1 and its fragments for 4 hours. The secretion level of TNF-α was quantified from the collected supernatants. (E) PMA-differentiated THP-1 cells were treated with UNE-C1, which have been untreated, pretreated with proteinase K or boiled. Some cells were preincubated with polymyxin B before treatment. Data are representative of three independent experiments. The results are presented as mean±SD, and statistical significance was analyzed with Student’s t-test (***p<0.001). CARS1, cysteinyl-tRNA synthetase 1; LPS, lipopolysaccharide; PMA, phorbol 12-myristate 13-acetate; TNF-α, tumour necrosis factor alpha.
Figure 3
Figure 3
UNE-C1-mediated activation of APCs via TLR2/6. (A) BMDCs were incubated with different CARS1 fragments for 24 hours. Costimulatory molecules were analyzed from the gated CD11c+ population. CD86 expression was evaluated by flow cytometry, and IL-6 and IL-12p70 secretion in supernatants was quantified by ELISA. (B) hTLR2 and hTLR4 HEK-Blue cells, expressing SEAP reporter gene in response to NF-Kβ activity, were treated with CARS1 or UNE-C1 in a dose-dependent manner. HEK-Blue TLR2 and TLR4 activation was evaluated by measuring SEAP secretion in culture media. (C) PMA-differentiated THP-1 cells were preincubated with the indicated amount of anti-human TLR2 or anti-human TLR4 for 1 hour and treated with CARS1 or UNE-C1 for an additional 4 hours. TNF-α from supernatants of PMA-differentiated THP-1 was measured by ELISA. (D) His-tagged CARS1 or UNE-C1 were incubated with TLR2-Flag or TLR4-flag proteins. His-ab or Mock-ab bound protein G agarose was used for immunoprecipitating his-tagged proteins. (E) Reciprocal immunoprecipitation was performed using Flag-ab or Mock-ab bound protein-G agarose. His-CARS1 or -UNE-C1 was incubated with TLR2-Flag or TLR4-flag. Interactions were determined by immunoblotting (F) BMDCs from naïve and TLR2−/− mice were treated with CARS1 or UNE-C1 for 24 hours. IL-6 and IL-12p70 levels in supernatants were quantified. (G) CARS1 and UNE-C1 were treated on hTLR2/6 and hTLR1/2. SEAP activities were measured at OD 620 nm. Data are representative of three independent experiments. Results are presented as mean±SD, and statistical significance was analyzed with Student’s t-test (***p<0.001). APC, antigen-presenting cell; BMDC, bone marrow-derived dendritic cell; CARS1, cysteinyl-tRNA synthetase 1; IL, interleukin; LPS, lipopolysaccharide; NF-Kβ, nuclear factor kappa-light-chain-enhancer of activated B cells; NS, not significant; OD, optical density; PMA, phorbol 12-myristate 13-acetate; SEAP, secreted embryonic alkaline phosphatase.
Figure 4
Figure 4
UNE-C1-dependent stimulation of humoral and cellular immune responses in vivo. (A) C57BL/6 mice (n=3) were injected subcutaneously with indicated reagents. A day after, dLNs were collected, and antigen presentation on h-2kb and CD86 in a different subset of DCs was quantified. (B) After immunizing mice (n=3), pan-DCs of each group were collected from its dLNs and spleens. Collected DCs were cocultured with CD8+ T cells from OT-1 transgenic mice for 24 hours. Expression levels of CD69 on OT-1 T cells were quantified and the production of IFN-γ in the supernatants was measured by ELISA. (C) Indicated reagents were used for mice (n=5) immunization on days 0 and 7. Seven days after the last immunization, spleens and dLNs were collected from immunized mice. Percentages of OVA-specific CD8+ T cells in the spleens and dLNs were measured. (D) Mice (n=3) were immunized on days 0 and 7. On day 14, mice were injected intravenously with SIINFEKL peptide-pulsed and unpulsed splenocytes labeled with a high or low concentration of CFSE, respectively. After 24 hours, the percentage of antigen-specific killing was measured by flow cytometry. Representative flow cytometry plots showing remained pulsed and unpulsed cells from immunized mice, and bar diagram with quantitative comparison. (E) Seven days after the final immunization, the serum was collected from each group of mice (n=5), and OVA-specific total IgG, IgG1, and IgG2c were measured by ELISA. Data are representative of three independent experiments. Results are presented as mean±SEM, and statistical significance was analyzed with Student’s t-test (*p<0.05, **p<0.01, ***p<0.001). CFSE, carboxyfluorescein succinimidyl ester; DC, dendritic cell; dLN, draining lymph node; IFN-γ, interferon gamma; MFI, mean fluorescence intensity; OVA, ovalbumin; pDC, plasmacytoid dendritic cell.
Figure 5
Figure 5
Effect of UNE-C1 on immune responses against tumor growth in vivo. (A) After the tumor implantation, mice (n=5) were immunized on days 3 and 10. Schematic illustration of UNE-C1 treatment schedule and the recorded tumor volumes are shown. (B) E.G7-OVA tumor-bearing mice (n=5) were treated as described. Tumors were harvested on day 17, and CD8+ T cells in the tumor were analyzed. The frequencies of tumor-infiltrating CD8+ T cells, OVA-specific CD8+ T cells, and IFN+ CD8+ T cells were measured. (C) C57BL/6 mice were injected subcutaneaously with 1×10⁵ of TC-1 cells. On days 6 and 13, mice (n=5) were injected subcutaneaously with the E7 peptide (20 µg) and UNE-C1 (100 µg). (D) TC-1 tumor-bearing mice (n=5) were treated as described. Tumors were harvested on day 19, and CD8+ T cells in the tumor were analyzed. The frequencies of CD8+ T cells, E7-specific CD8+ T cells, and IFN+ CD8+ T cells were measured. Data are representative of three independent experiments. Results are presented as mean±SEM, and statistical significance was analyzed with Student’s t-test (*p<0.05, **p<0.01, ***p<0.001). IFN-γ, interferon gamma; OVA, ovalbumin.
Figure 6
Figure 6
UNE-C1 induces CD8+ T-cell-mediated antitumor immune responses and shows synergy with anti-CTLA-4 antibody. (A) After E.G7-OVA tumor-bearing mice (n=5) were immunized on days 3 and 10, the mice were injected intraperitoneally with anti-CD8, anti-CD4, and anti-NK1.1 antibodies on days 2, 5, 8, and 11. Tumor volumes were monitored and tumors were collected on day 17 to determine tumor weights. (B) C57BL/6 mice (n=12) were implanted with 1×10⁶ E.G7-OVA cells. OVA plus UNE-C1 was injected subcutaneously on days 3 and 10. Anti-CTLA-4 was injected intraperitoneally on days 3, 6, 9, 12, and 15 to check the synergy effect. Tumor volumes were measured and the percent of tumor survival is shown. Data are representative of three independent experiments. All results are presented as mean±SEM. P values of tumor volumes were calculated by Student’s t-test, and survival days were analyzed by the Mantel-Cox test (**p<0.01, ***p<0.001). OVA, ovalbumin.
Figure 7
Figure 7
Low systemic toxicity of UNE-C1 (A–D) C57BL/6 mice (n=3) were injected subcutaneously with OVA plus an excess doses of UNE-C1 or well-established TLR ligands. Two days after the injection, body (A) and spleen weights were measured and presented as a mass of spleen per body weight (B). At the indicated time, blood was collected, and the levels of IL-12p40, TNF-α, and IL-6 were measured by ELISA (C). Photos were taken 2 days after the injection (D). Three mice in each group are shown. Data are representative of three independent experiments. Results are presented as mean±SEM, and statistical significance was analyzed with Student’s t-test (*p<0.05, **p<0.01, ***p<0.001). IL, interleukin; NS, not significant; OVA, ovalbumin; TLR, Toll-like receptor.

References

    1. Kim S, You S, Hwang D. Aminoacyl-tRNA synthetases and tumorigenesis: more than housekeeping. Nat Rev Cancer 2011;11:708–18. 10.1038/nrc3124 - DOI - PubMed
    1. Park SG, Schimmel P, Kim S. Aminoacyl tRNA synthetases and their connections to disease. Proc Natl Acad Sci U S A 2008;105:11043–9. 10.1073/pnas.0802862105 - DOI - PMC - PubMed
    1. Lee Y-N, Nechushtan H, Figov N, et al. . The function of lysyl-tRNA synthetase and Ap4A as signaling regulators of MITF activity in FcepsilonRI-activated mast cells. Immunity 2004;20:145–51. 10.1016/S1074-7613(04)00020-2 - DOI - PubMed
    1. Yannay-Cohen N, Carmi-Levy I, Kay G, et al. . Lysrs serves as a key signaling molecule in the immune response by regulating gene expression. Mol Cell 2009;34:603–11. 10.1016/j.molcel.2009.05.019 - DOI - PubMed
    1. Lo W-S, Gardiner E, Xu Z, et al. . Human tRNA synthetase catalytic nulls with diverse functions. Science 2014;345:328–32. 10.1126/science.1252943 - DOI - PMC - PubMed

Publication types

MeSH terms