. 2020 May;8(1):e000599.
doi: 10.1136/jitc-2020-000599.

Heterodimeric IL-15 delays tumor growth and promotes intratumoral CTL and dendritic cell accumulation by a cytokine network involving XCL1, IFN-γ, CXCL9 and CXCL10

Affiliations

Heterodimeric IL-15 delays tumor growth and promotes intratumoral CTL and dendritic cell accumulation by a cytokine network involving XCL1, IFN-γ, CXCL9 and CXCL10

Cristina Bergamaschi et al. J Immunother Cancer. 2020 May.

Abstract

Background: Interleukin-15 (IL-15) promotes growth and activation of cytotoxic CD8+ T and natural killer (NK) cells. Bioactive IL-15 is produced in the body as a heterodimeric cytokine, comprising the IL-15 and IL-15 receptor alpha chains (hetIL-15). Several preclinical models support the antitumor activity of hetIL-15 promoting its application in clinical trials.

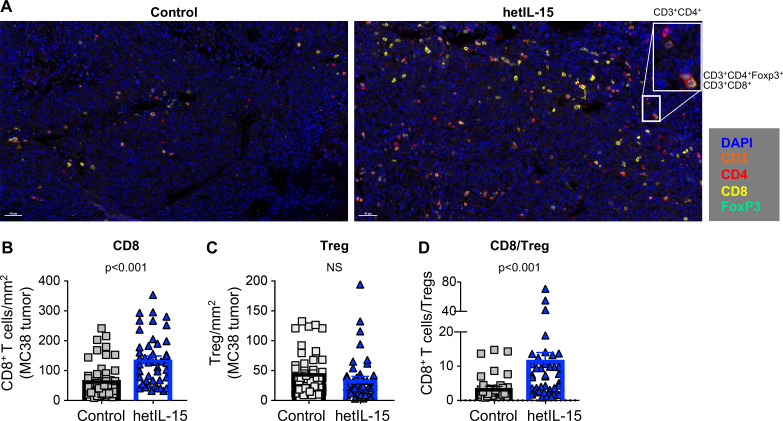
Methods: The antitumor activity of hetIL-15 produced from mammalian cells was tested in mouse tumor models (MC38 colon carcinoma and TC-1 epithelial carcinoma). The functional diversity of the immune infiltrate and the cytokine/chemokine network within the tumor was evaluated by flow cytometry, multicolor immunohistochemistry (IHC), gene expression profiling by Nanostring Technologies, and protein analysis by electrochemiluminescence and ELISA assays.

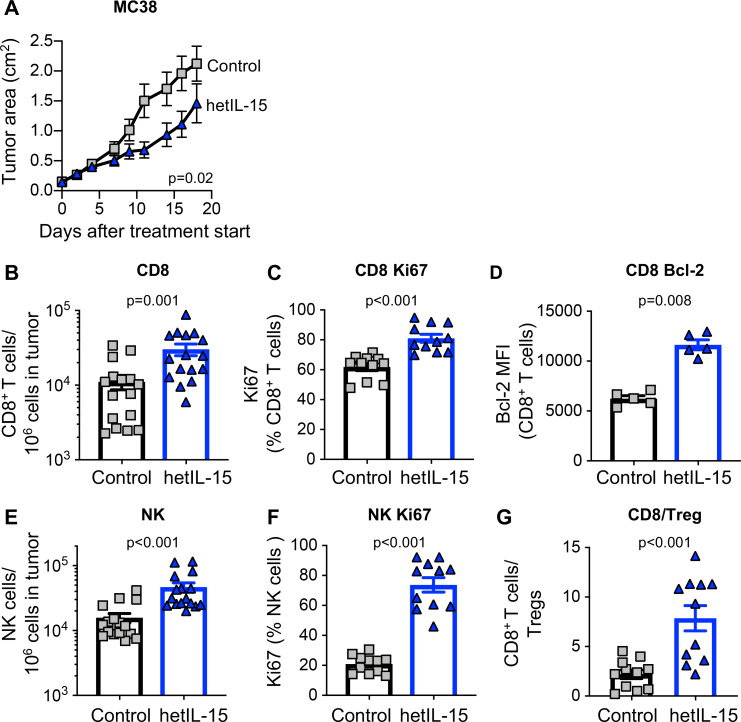
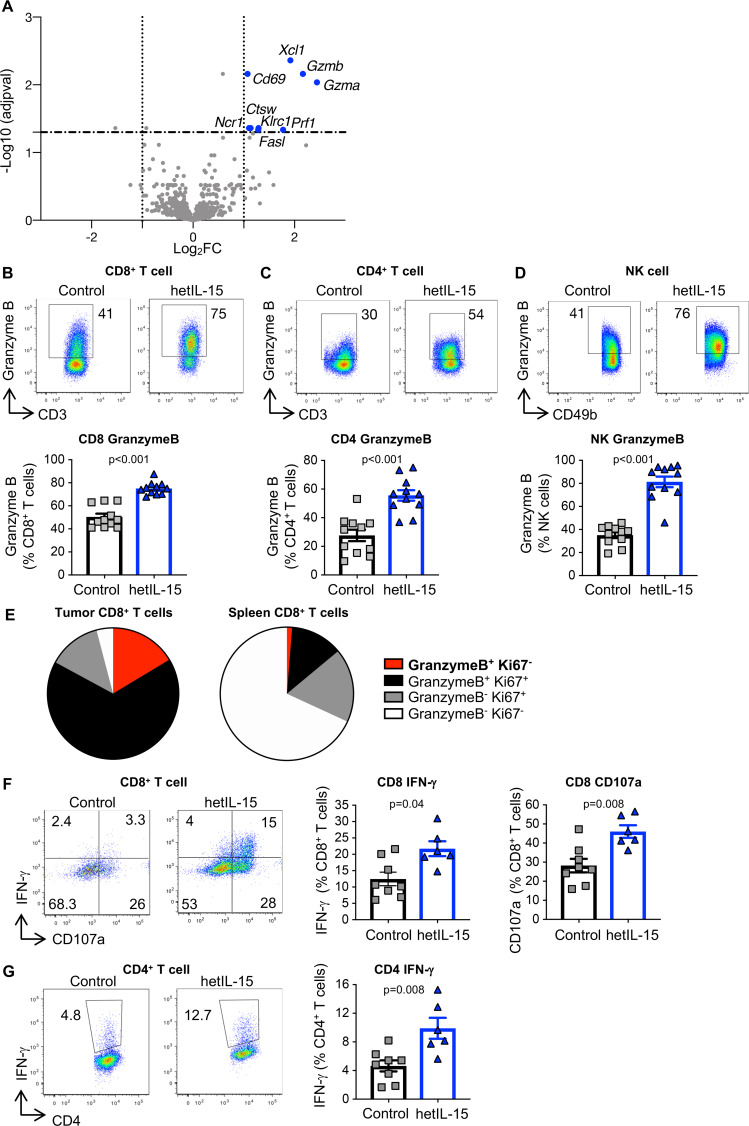
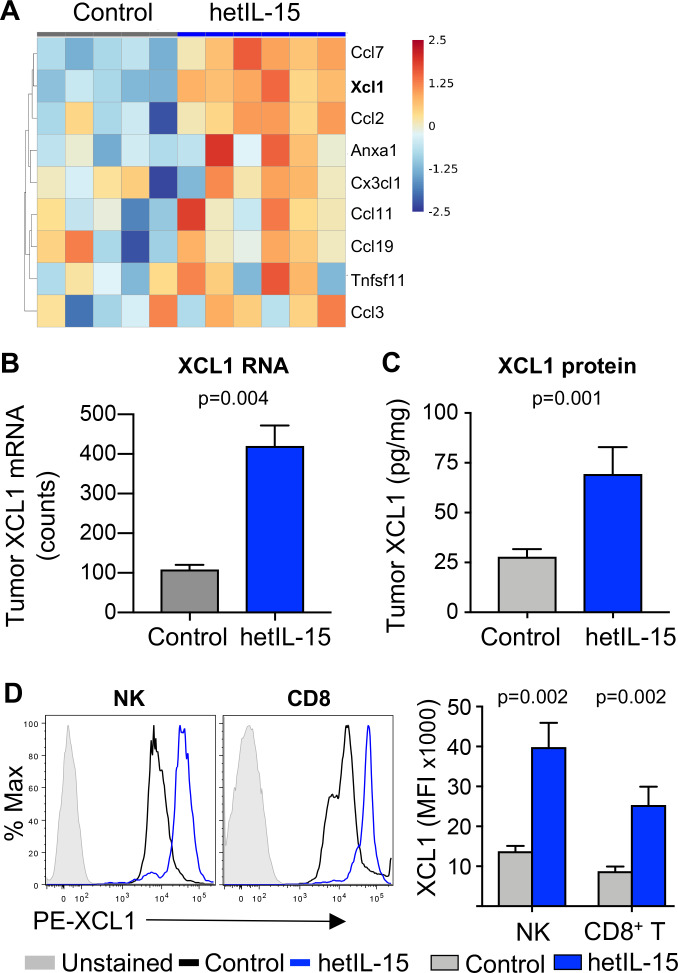
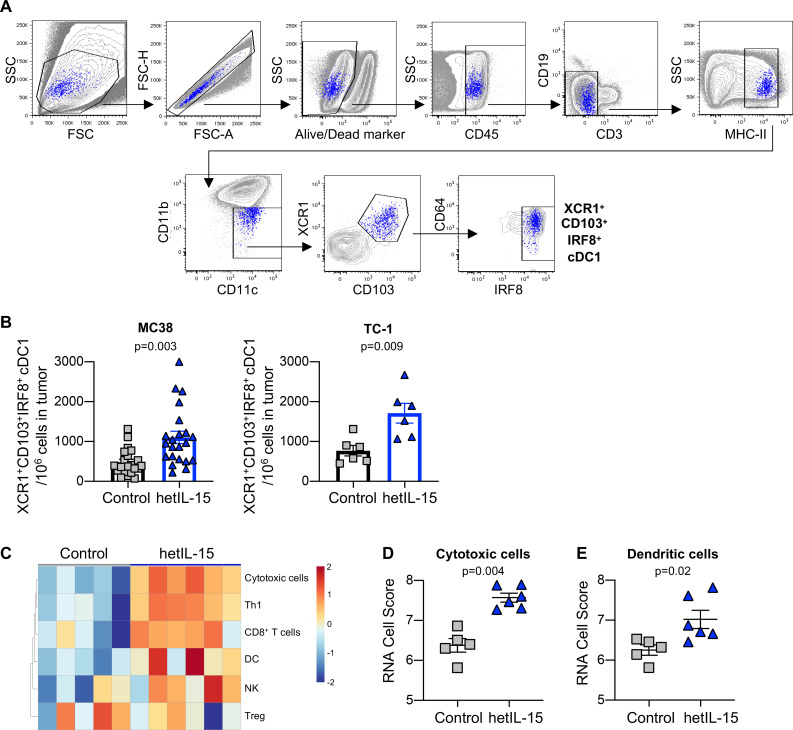
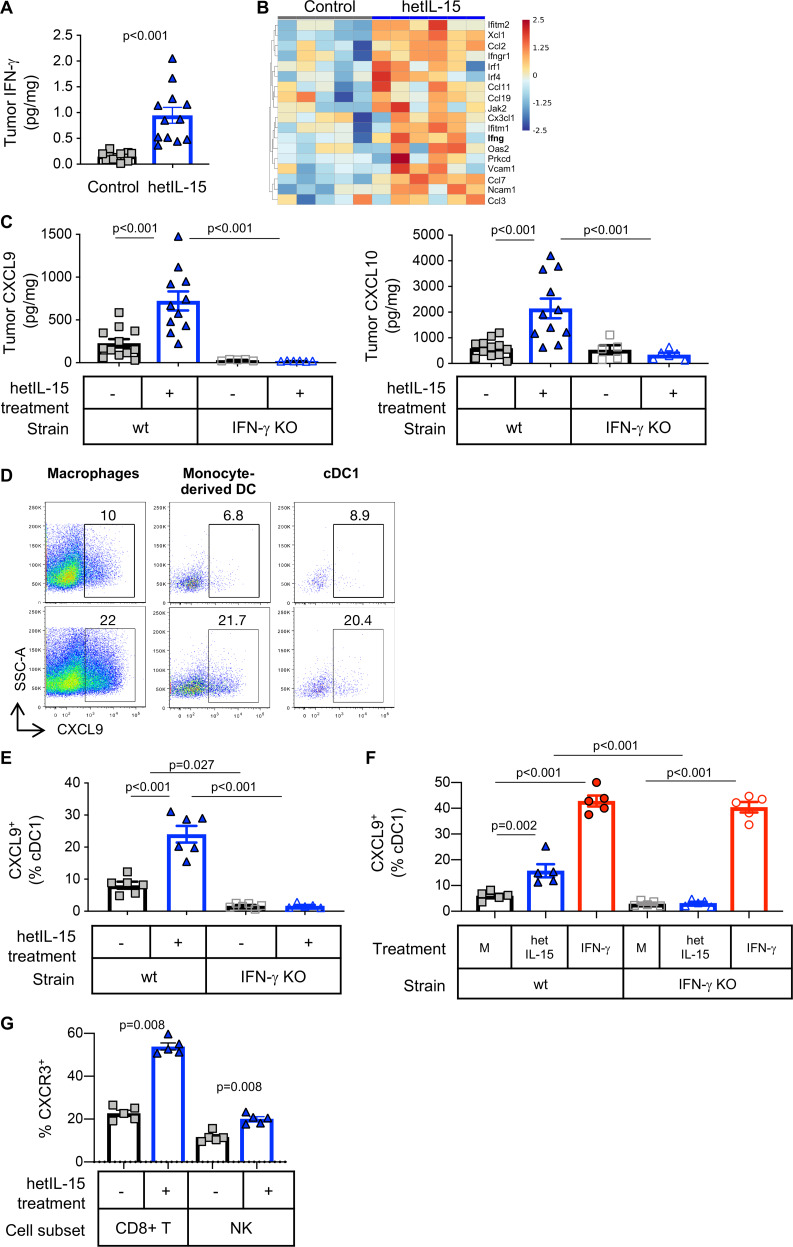
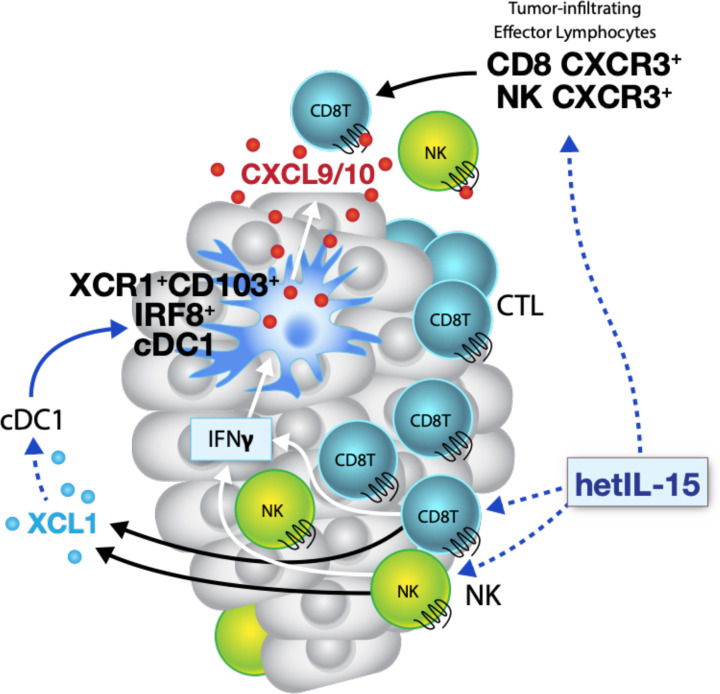
Results: hetIL-15 treatment resulted in delayed primary tumor growth. Increased NK and CD8+ T cell tumoral infiltration with an increased CD8+/Treg ratio were found by flow cytometry and IHC in hetIL-15 treated animals. Intratumoral NK and CD8+ T cells showed activation features with enhanced interferon-γ (IFN-γ) production, proliferation (Ki67+), cytotoxic potential (Granzyme B+) and expression of the survival factor Bcl-2. Transcriptomics and proteomics analyses revealed complex effects on the tumor microenvironment triggered by hetIL-15 therapy, including increased levels of IFN-γ and XCL1 with intratumoral accumulation of XCR1+IRF8+CD103+ conventional type 1 dendritic cells (cDC1). Concomitantly, the production of the chemokines CXCL9 and CXCL10 by tumor-localized myeloid cells, including cDC1, was boosted by hetIL-15 in an IFN-γ-dependent manner. An increased frequency of circulating CXCR3+ NK and CD8+ T cells was found, suggesting their ability to migrate toward the tumors following the CXCL9 and CXCL10 chemokine gradient.

Conclusions: Our results show that hetIL-15 administration enhances T cell entry into tumors, increasing the success rate of immunotherapy interventions. Our study further supports the incorporation of hetIL-15 in tumor immunotherapy approaches to promote the development of antitumor responses by favoring effector over regulatory cells and by promoting lymphocyte and DC localization into tumors through the modification of the tumor chemokine and cytokine milieu.

Keywords: CD8-positive T-lymphocytes; T-lymphocytes; cytokines; dendritic cells; immunotherapy.


Conflict of interest statement

Competing interests: CB, AV, BKF and GNP are inventors on US Government-owned patents related to hetIL-15.

Figures

Figure 1
Figure 1
hetIL-15 delays tumor growth and promotes tumor-infiltrating lymphocytes proliferation and survival. Mice, implanted with 2×10⁵ MC38 cells at day −5, were randomized in two different treatment groups: hetIL-15 (blue traingle) and PBS (gray square) administration. hetIL-15 (3 µg/injection/mouse) was injected IP three times per week. (A) Control mice (n=10) and hetIL-15-treated mice (n=9) received eight injections, starting at day 0, and tumor growth was monitored overtime. Tumor size measurements were performed every 2 to 3 days. Tumor area (length×width) mean±SEM for each time point are shown. Similar results were obtained in three independent experiments. (B–G) MC38 tumor-bearing mice were sacrificed at day eight after treatment with either PBS or hetIL-15 (1 day after the fourth administration). Tumor immune infiltrates were analyzed by flow cytometry to determine: (B) frequency of tumor-infiltrating CD8+ T cells. Data of three independent experiments were combined; (C) percentage of dividing tumor infiltrating CD8+T cells; (D) expression of the survival factor Bcl-2 in the tumor-infiltrating CD8+ T cell population; (E) frequency of tumor-infiltrating NK cells; (F) percentage of dividing tumor infiltrating NK cells; (G) intratumoral CD8+ T cells/Treg ratio for each treatment group. Bars represent mean±SEM. P values are from Mann-Whitney U test. hetIL-15, heterodimeric interleukin-15; IP, intraperitoneal; MFI, mean fluorescence intensity; NK, natural killer; SEM, Standard error of the mean.
Figure 2
Figure 2
CD8+ T cells accumulation and increased CD8+/Treg ratio in MC38 tumors from mice treated with hetIL-15. (A) Immunohistochemistry staining of MC38 tumor sections from control (left panel) and hetIL-15-treated mice (right panel). Analysis was performed at day eight after treatment with either PBS or hetIL-15 (1 day after the fourth administration). TILs were monitored with CD3 (orange), CD4+ (red), CD8+ (yellow) and FOXP3 (green) antibodies. A representative image (×20 magnification) from one mouse/group is shown. Insert represents a ×4 magnification. (B–D) The number of CD8+ T cells per mm2 (B), the number of Tregs per mm2 (C), and the ratio of CD8+ T cells/Treg cells (D). Data are from nine ×20 ‘hotspot’ fields (containing the highest number of CD8+ T cells/mm2) per mouse. Six mice in each treatment group were analyzed. P values are from Mann-Whitney U test. hetIL-15, heterodimeric interleukin-15; TILs, tumor-infiltrating lymphocytes.
Figure 3
Figure 3
Tumors from hetIL-15-treated mice comprise lymphocytes with an effector-like gene signature and enhanced cytotoxic functions. (A) Gene expression analysis from MC38 tumors recovered from mice treated with either PBS (n=5) or hetIL-15 (n=6) was performed by the Nanostring technology using a panel of 780 immune-oncology related gene probes. The analysis was conducted at 3 hours after the fourth administration. Volcano plot depicts differentially expressed genes between the two treatment groups, highlighting the upregulated genes (blue dots) on hetIL-15 treatment. To define differentially expressed genes, we used one log2 change (vertical dotted lines) and p<0.05 (adjusted p value for multiple comparison; horizontal broken line) difference between groups. (B–D) Tumor-resident CD8+ T cells (B), CD4+ T cells (C) and NK cells (D) were analyzed for the expression of the cytotoxic marker GzmB by intracellular staining followed by flow cytometry. Dot plots from a representative animal (upper panels) and the percentage of GzmB+ cells within each cell subset (bottom panel) are shown. (E) Pie charts show the proportion of GzmB+Ki67-(red), GzmB+Ki67+(black), GzmB-Ki67+(gray) and GzmB-Ki67-(white) cells within the total CD8+ T cell subset in tumor (left panel) and spleen (right panel) of hetIL-15 treated animals. (F–G) IFN-γ production and degranulation (CD107) in tumor-infiltrating CD8+ T cells (F) and CD4+ T cells (G) on ex vivo stimulation with beads coated with anti-CD3/CD28 antibodies. Dot plots show a representative animal from each group. Bars represent mean±SEM. P values are from Mann-Whitney U test. hetIL-15, heterodimeric interleukin-15; IFN-γ, interferon-γ; NK, natural killer; GzmB, Granzyme B; SEM, Standard error of the mean.
Figure 4
Figure 4
hetIL-15 enhances the production of XCL1 by tumor resident CD8+ T and NK cells. (A) Heatmap, represented as Z-score centered and rescaled, of the genes included in the GO:0002548 monocyte migration and chemotaxis pathway from control (n=5) and hetIL-15-treated (n=6) MC38-bearing mice. Significantly upregulated genes in hetIL-15-treated mice in comparison to control mice are depicted. (B) Evaluation of the chemokine XCL1 in MC38 tumors. The panel shows the tumor mRNA counts for Xcl1 as determined by the Nanostring technologies in both PBS treated (n=5) and hetIL-15-treated (n=6) MC38-bearing mice. (C) MC38 tumor lysates from either PBS-treated (n=11) or hetIL-15-treated (n=10) mice were assessed for XCL1 concentration by ELISA. (D) Flow cytometric analysis of XCL1 production by NK and CD8+ T cells. Histogram overlays show the expression of XCL1 by intratumoral NK and CD8+ T cells from a representative hetIL-15 (blue) and PBS (black) treated mouse. Solid gray histogram shows non-staining control. The XCL1 geometric mean fluorescent intensity (MFI) in the tumor-infiltrating NK and CD8+ T cells from each therapeutic group (n=6) are shown in the right panel. Bars represent mean±SEM. P values are from Mann-Whitney U test. hetIL-15, heterodimeric interleukin-15; NK, natural killer; SEM, Standard error of the mean.
Figure 5
Figure 5
hetIL-15 treatment results in recruitment of XCR1+CD103+IRF8+ cDC1 into tumors. (A) Gating strategy for the characterization of cDC1. (B) The frequency of tumor-infiltrating CD103+XCR1+IRF8+ cDC1 was determined in MC38 (left panel) and TC-1 tumors (right panel) recovered from hetIL-15 or PBS-treated control mice. The number of CD103+XCR1+IRF8+ cDC1 cells in each tumor was normalized per million of cells present in the tumor suspension. The values from individual animals and mean±SEM are shown. (C) Heatmap representing the immune cell composition of tumors on hetIL-15 treatment. Cell scores were calculated for different immune cell subsets as described in material and methods. (D–E) RNA cell score for cytotoxic cells (D) and dendritic cells (E) was calculated for tumors recovered from control (gray, n=5) and hetIL-15 (blue, n=6) treated mice using Nanostring measurements as described in material and methods. Individuals animals and mean±SEM are shown. P values are from Mann-Whitney U test. cDC1, conventional type 1 dendritic cells; hetIL-15, heterodimeric interleukin-15; SEM, Standard error of the mean.
Figure 6
Figure 6
hetIL-15 treatment stimulates secretion of CXCL9 and CXCL10 from tumor-localized myeloid cells in an IFN-γ dependent fashion. (A) Intratumoral IFN-γ concentration measured by U-PLEX MSD in MC38 tumors excised from mice treated with PBS (gray square; n=12) or hetIL-15 (blue triangle; n=12). (B) Heatmap for the genes included in the GO:0034341 IFN-γ related pathway from control (n=5) and hetIL-15-treated (n=6) MC38-bearing mice. Heatmap is represented as Z-score centered and rescaled. Significantly upregulated genes in hetIL-15-treated vs control mice are depicted. (C) Tumor concentration of CXCL9 (left panel) and CXCL10 (right panel) in PBS- (gray squares) or hetIL-15-treated (blue triangles) wt and IFN-γ KO mice. Bars represent mean±SEM. Data from one of two representative experiments are shown. (D) Dot plots showing the in vivo production of CXCL9 by tumor-associated macrophages (defined as MHCII+CD64+ cells), monocyte-derived dendritic cells (defined as MHCII+CD64-CD11c+CD11bhigh) and cDC1, treated with either PBS (upper panels) or hetIL-15 (lower panels). (E) The frequency of intratumoral cDC1 cells producing CXCL9 is reported as the percentage of the total cDC1 in wt and IFN-γ KO mice treated with PBS (gray square) or hetIL-15 (blue triangle). Bars represent mean±SEM from one representative experiment. (F) CXCL9 production by intratumoral cDC1 recovered from MC38 tumor-bearing wt and IFN-γ KO mice. Cells were stimulated ex vivo with hetIL-15 or IFN-γ and the ability to produce CXCL9 by cDC1 was evaluated by flow cytometry. Bars represent mean±SEM. (G) The frequency of CXCR3+ CD8+ T cells and NK cells in blood of MC38-bearing mice treated with PBS (gray square) or hetIL-15 (blue triangles) are shown as the percentage of the parental population. Bars represent mean±SEM. P values are from Mann-Whitney U test. cDC1, conventional type 1 dendritic cells; hetIL-15, heterodimeric interleukin-15; IFN-γ, interferon-γ; wt: wild type; KO, knock out; NK, natural killer; SEM, Standard error of the mean.
Figure 7
Figure 7
Model representing the hetIL-15 triggered pathway for tumor infiltration by lymphocytes and dendritic cells. Activated CD8+ T and NK cells release IFN-γ and XCL1 in response to hetIL-15 treatment. The increased XCL1 concentration recruits cross-presenting cDC1 expressing the chemokine receptor XCR1. cDC1 in tumors respond to hetIL-15 by secreting the chemokines CXCL9 and CXCL10, in an IFN-γ dependent manner. Systemic effects of hetIL-15 includes the enhanced frequency of circulating CXCR3+ CD8+ T and NK cells that can further infiltrate the tumor, following the CXCL9 and CXCL10 chemokine gradient. cDC1, conventional type 1 dendritic cells; hetIL-15, heterodimeric interleukin-15; IFN-γ, interferon-γ; NK, natural killer.

References

    1. Brahmer JR, Tykodi SS, Chow LQM, et al. . Safety and activity of anti-PD-L1 antibody in patients with advanced cancer. N Engl J Med 2012;366:2455–65. 10.1056/NEJMoa1200694 - DOI - PMC - PubMed
    1. Hamid O, Robert C, Daud A, et al. . Safety and tumor responses with lambrolizumab (anti-PD-1) in melanoma. N Engl J Med 2013;369:134–44. 10.1056/NEJMoa1305133 - DOI - PMC - PubMed
    1. Fridman WH, Pagès F, Sautès-Fridman C, et al. . The immune contexture in human tumours: impact on clinical outcome. Nat Rev Cancer 2012;12:298–306. 10.1038/nrc3245 - DOI - PubMed
    1. Galon J, Costes A, Sanchez-Cabo F, et al. . Type, density, and location of immune cells within human colorectal tumors predict clinical outcome. Science 2006;313:1960–4. 10.1126/science.1129139 - DOI - PubMed
    1. Naito Y, Saito K, Shiiba K, et al. . Cd8+ T cells infiltrated within cancer cell nests as a prognostic factor in human colorectal cancer. Cancer Res 1998;58:3491–4. - PubMed

Publication types

MeSH terms