. 2020 Jun 16;117(24):13329-13338.
doi: 10.1073/pnas.1914345117. Epub 2020 May 27.

Photothermal modulation of human stem cells using light-responsive 2D nanomaterials

Affiliations

Photothermal modulation of human stem cells using light-responsive 2D nanomaterials

James K Carrow et al. Proc Natl Acad Sci U S A. .

Abstract

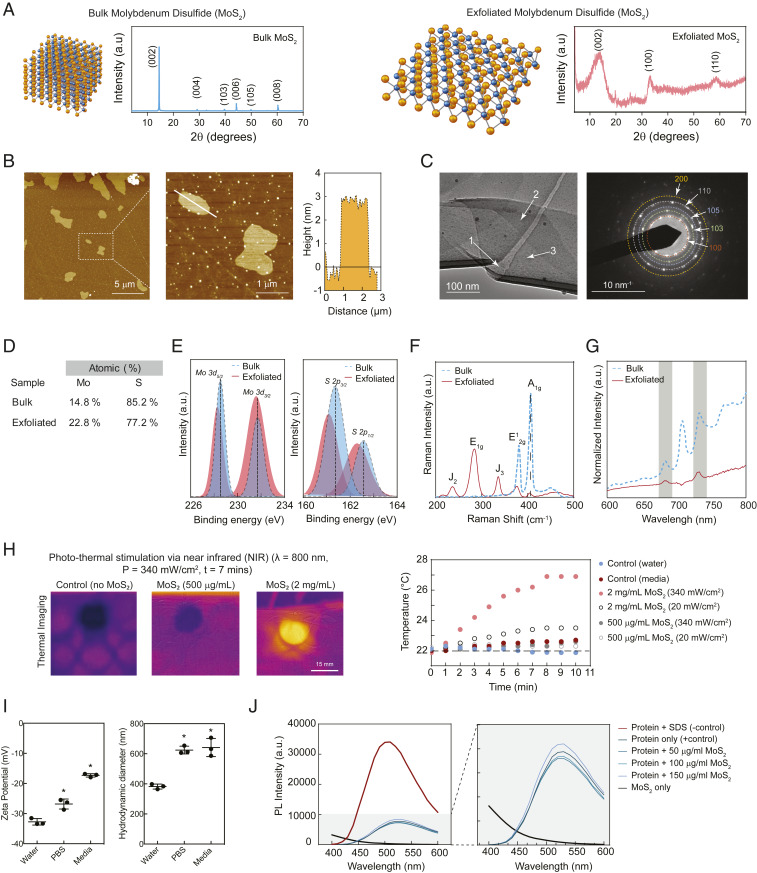
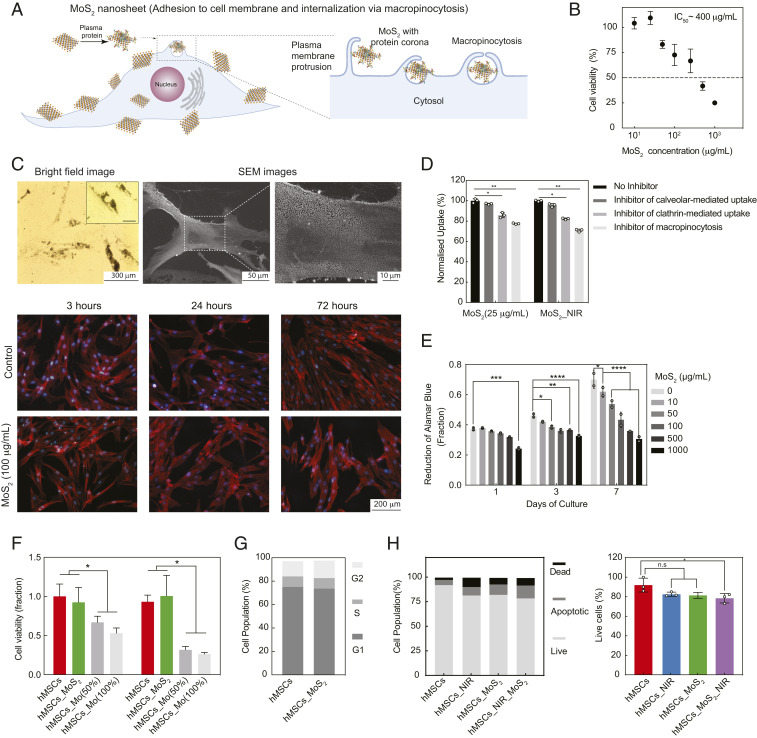
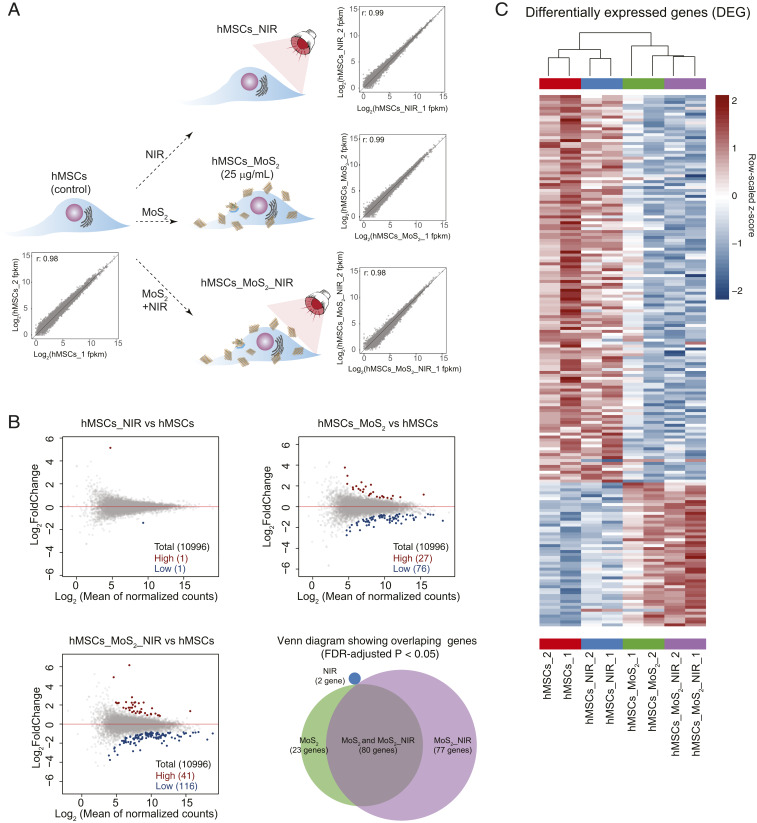
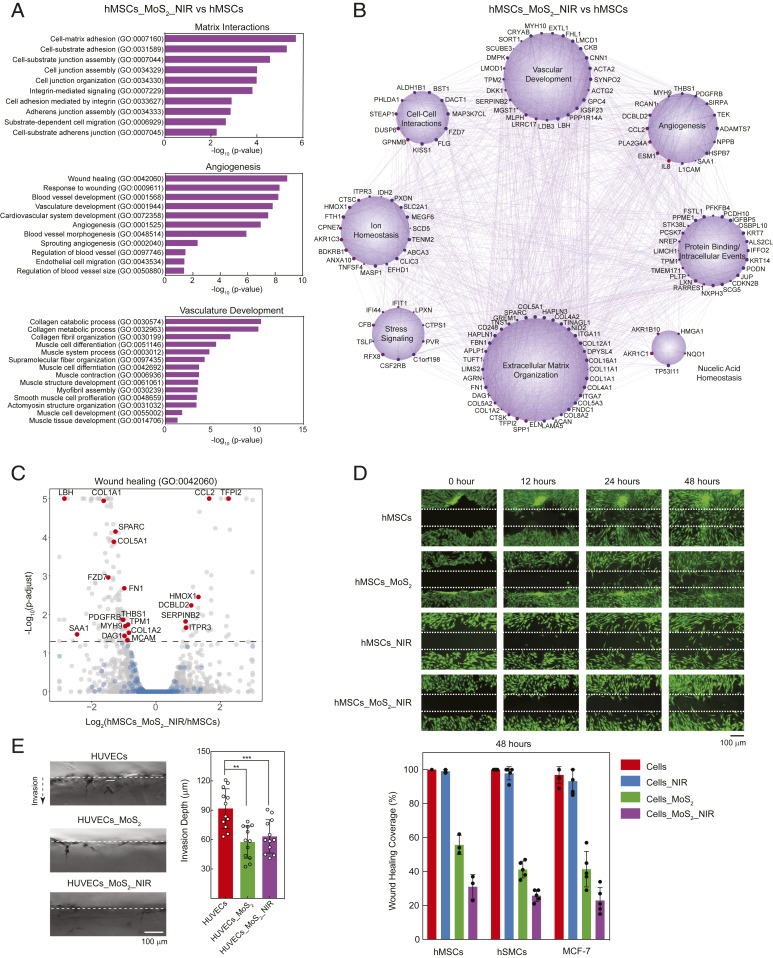
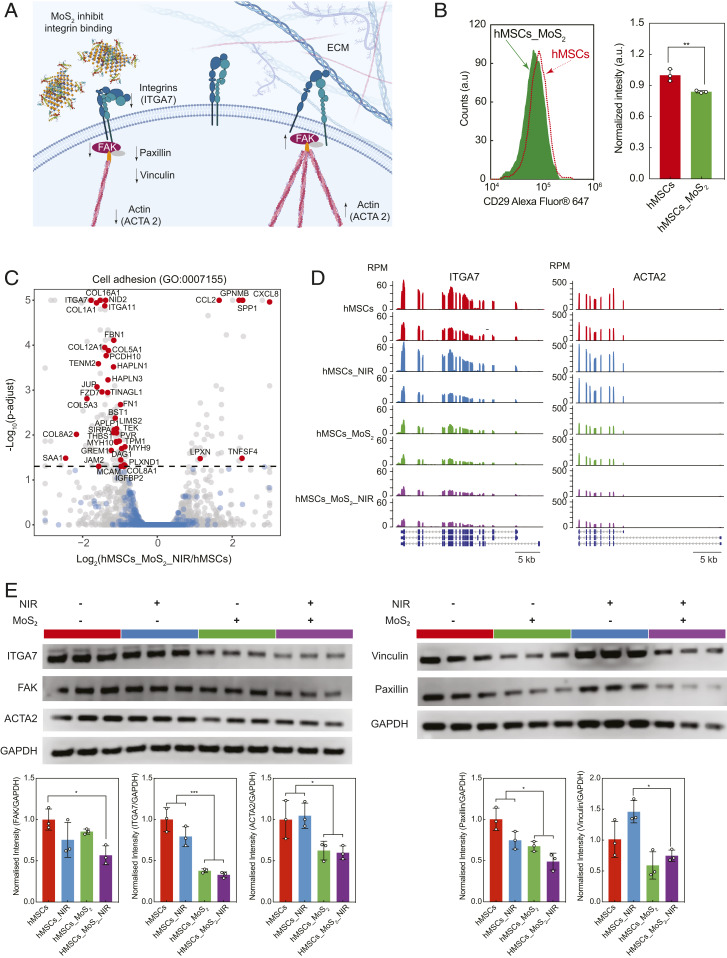
Two-dimensional (2D) molybdenum disulfide (MoS2) nanomaterials are an emerging class of biomaterials that are photoresponsive at near-infrared wavelengths (NIR). Here, we demonstrate the ability of 2D MoS2 to modulate cellular functions of human stem cells through photothermal mechanisms. The interaction of MoS2 and NIR stimulation of MoS2 with human stem cells is investigated using whole-transcriptome sequencing (RNA-seq). Global gene expression profile of stem cells reveals significant influence of MoS2 and NIR stimulation of MoS2 on integrins, cellular migration, and wound healing. The combination of MoS2 and NIR light may provide new approaches to regulate and direct these cellular functions for the purposes of regenerative medicine as well as cancer therapy.

Keywords: cell adhesion; cell–nanoparticles interactions; human mesenchymal stem cells; two-dimensional (2D) nanomaterials; whole-transcriptome sequencing.


Conflict of interest statement

The authors declare no competing interest.

Figures

Fig. 1.
Fig. 1.
Physicochemical characterization of exfoliate 2D MoS2 nanosheets. (A) XRD of bulk and exfoliated MoS2. (B) AFM measures micrometer-sized nanosheets with nanometer thickness, confirming 2D shape. (C) TEM images of ultrathin MoS2 sheets displayed overlapping layers; each individual layer is numbered. Further, electron diffraction corroborated the formation of the 1T phase following lithium intercalation. (D) Atomic composition of bulk and exfoliated MoS2 determined via elemental analysis. (E) Crystallographic transformations from bulk to exfoliated MoS2 were monitored with XPS analysis with shifts from 2H to 1T phases observed. (F) Raman spectroscopy and (G) photoluminescent measurements likewise indicated structural modifications had occurred, seen through changes in vibrational energy bands and luminescent intensity, respectively. (H) Response to NIR light was determined using an IR camera and change in temperature over time. (I) Zeta potential and hydrodynamic size of exfoliated MoS2 in water, PBS, and media. (J) ANS assay shows protein structures are intact in the presence of exfoliated MoS2.
Fig. 2.
Fig. 2.
Cellular interactions of 2D MoS2 with hMSCs. (A) A protein corona forms when 2D MoS2 is suspended in media and adheres to the cell surface and is subsequently internalized by cells. (B) IC50 of MoS2 determined using metabolic assays. (C) Cellular internalization of MoS2 determined using optical, electron, and fluorescence microscopy. (D) MoS2 adhere to cell membrane and internalize via micropinocytosis and clathrin-mediated endocytosis. (E) Effect of MoS2 on metabolic activity over 7 d. (F) Effect of Mo and MoS2 nanosheet at equivalent molarities on cell viability (day 3 and day 7 on the left and right, respectively). (G) Effect of MoS2 on cell cycle. (H) Cell viability when treated with NIR, MoS2, and MoS2_NIR. *P < 0.05; not significant (n.s.) > 0.05.
Fig. 3.
Fig. 3.
Understanding the effect of NIR, MoS2, and MoS2_NIR on hMSCs using RNA-seq. (A) Pearson correlation coefficient of expressed genes between replicates of different conditions (r = 0.98 for hMSC controls, r = 0.99 for hMSCs_MoS2, r = 0.99 for hMSCs_NIR, and r = 0.98 for hMSCs_MoS2_NIR). (B) MA plot highlighting differentially regulated genes (FDR-adjusted P < 0.05) of the treatment groups against the untreated hMSCs and extent of expression change (gray: all of the expressed genes, red: up-regulated genes, blue: down-regulated genes). Venn diagram indicating differential genes overlap between pairwise comparison of treatment groups. (C) Heat map of row normalized FPKM z-scores of differentially expressed genes across all pairwise comparisons against the untreated hMSCs (red: up-regulated, blue: down-regulated).
Fig. 4.
Fig. 4.
Functional effect of NIR, MoS2, and MoS2_NIR on cells. (A) GO terms obtained by gene enrichment analysis of DEGs (FDR-adjusted P < 0.05) due to MoS2_NIR treatment. (B) GeneMANIA analysis produced a network of coexpression interactions for differentially expressed genes within the hMSCs_MoS2_NIR population (red: up-regulated, blue: down-regulated; size increases with significance). (C) A volcano plot for the wound healing (GO:0042060), gray: all of the expressed genes, blue: genes associated with the GO term with no significant change in expression, red: genes associated with the GO term that show significantly differential expression due to treatment. (D) Scratch assay used to determine the effect of NIR, MoS2, and MoS2_NIR on migration, cell proliferation, and wound healing of hMSCs, hSMCs, and MCF-7. The dotted lines represent scratch generated using pipette tip. The cell migration across the wound area was determined by imaging the sample after 12, 24, and 48 h. (E) Three-dimensional invasion assay demonstrating ability of HUVECs treated with MoS2 and MoS2_NIR to invade collagen gel.
Fig. 5.
Fig. 5.
Role of integrin expression on cell adhesion due to NIR, MoS2, and MoS2_NIR treatment. (A) Schematic showing the potential interaction between MoS2 nanosheets and integrin molecules at the cell surface. (B) Quantification of unbound integrin beta-1 (CD29) in cells treated with and without MoS2 nanosheets. (C) A volcano plot for the cell adhesion (GO:0007155), gray: all of the expressed genes, blue: genes associated with the GO term with no significant change in expression, red: genes associated with the GO term that show significant difference in expression due to treatment. (D) Gene track showing normalized mRNA expression of integrin alpha-7 (ITGA7) and smooth muscle alpha-2 actin (ACTA2) for hMSCs, hMSCs_NIR, hMSCs_ MoS2, and hMSCs MoS2_NIR. (E) Protein expression level of ITGA7, FAK, vinculin, paxillin, and smooth muscle actin (ACTA2) determined using Western blot for hMSCs, hMSCs_NIR, hMSCs_ MoS2, and hMSCs MoS2_NIR. GAPDH (glyceraldehyde-3-phosphate dehydrogenase) is internal control. *P < 0.05, ***P < 0.001.

References

    1. Novoselov K. S., Mishchenko A., Carvalho A., Castro Neto A. H., 2D materials and van der Waals heterostructures. Science 353, aac9439 (2016). - PubMed
    1. Chimene D., Alge D. L., Gaharwar A. K., Two-dimensional nanomaterials for biomedical applications: Emerging trends and future prospects. Adv. Mater. 27, 7261–7284 (2015). - PubMed
    1. Chhowalla M. et al. ., The chemistry of two-dimensional layered transition metal dichalcogenide nanosheets. Nat. Chem. 5, 263–275 (2013). - PubMed
    1. Gaharwar A. K. et al. ., 2D nanoclay for biomedical applications: Regenerative medicine, therapeutic delivery, and additive manufacturing. Adv. Mater. 31, e1900332 (2019). - PMC - PubMed
    1. Liu T. et al. ., Drug delivery with PEGylated MoS2 nano-sheets for combined photothermal and chemotherapy of cancer. Adv. Mater. 26, 3433–3440 (2014). - PubMed

Publication types

MeSH terms