. 2020 May 27;11(1):2653.
doi: 10.1038/s41467-020-16444-w.

High-resolution annotation of the mouse preimplantation embryo transcriptome using long-read sequencing

Affiliations

High-resolution annotation of the mouse preimplantation embryo transcriptome using long-read sequencing

Yunbo Qiao et al. Nat Commun. .

Erratum in

Abstract

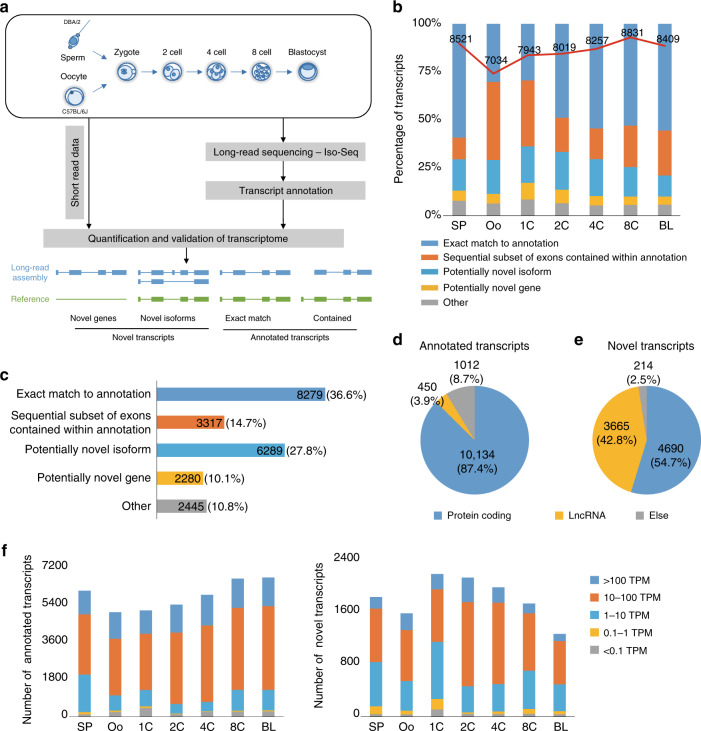
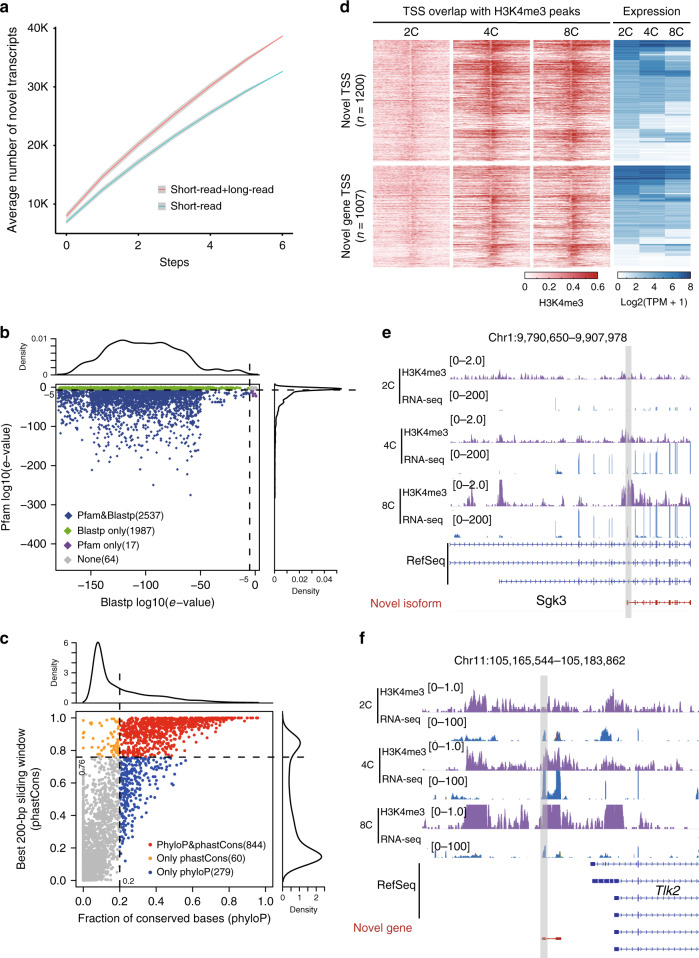
The transcriptome of the preimplantation mouse embryo has been previously annotated by short-read sequencing, with limited coverage and accuracy. Here we utilize a low-cell number transcriptome based on the Smart-seq2 method to perform long-read sequencing. Our analysis describes additional novel transcripts and complexity of the preimplantation transcriptome, identifying 2280 potential novel transcripts from previously unannotated loci and 6289 novel splicing isoforms from previously annotated genes. Notably, these novel transcripts and isoforms with transcription start sites are enriched for an active promoter modification, H3K4me3. Moreover, we generate a more complete and precise transcriptome by combining long-read and short-read data during early embryogenesis. Based on this approach, we identify a previously undescribed isoform of Kdm4dl with a modified mRNA reading frame and a novel noncoding gene designated XLOC_004958. Depletion of Kdm4dl or XLOC_004958 led to abnormal blastocyst development. Thus, our data provide a high-resolution and more precise transcriptome during preimplantation mouse embryogenesis.


Conflict of interest statement

The authors declare no competing interests.

Figures

Fig. 1
Fig. 1. Identification of novel transcripts using PacBio SMRT sequencing in seven stages of preimplantation mouse embryos.
a Workflow for transcriptome reconstruction based on PacBio SMRT sequencing data. The Iso-seq3 pipeline was used to assemble transcripts from long-read data, and these transcripts were then mapped to the reference genome with GMAP and compared with the GENCODE (vM20) annotation using Cuffcompare. Zygotes and in vitro cultured embryos from female C57BL/6J and male DBA/2 inbred mice were collected. For a batch of samples, 150 oocytes (Oo), 150 1-cell embryos (1C), 100 2-cell embryos (2C), 50 4-cell embryos (4C), 25 8-cell embryos (8C), 20 blastocysts (BL, 32-64C), and bulk sperms, were collected for experiments. Long-read transcripts were also validated and compared to short-read data. b Annotation of identified long-read transcripts in the seven stages. By comparison with the GENCODE annotation, the transcripts for each stage were divided into the five indicated categories, and the percentages of transcripts in each category are shown. The red line represents the total number of transcripts in each stage. c Annotation of merged long-read transcripts that were the combination of transcripts identified across seven stages. The numbers and percentages of merged transcripts in the five categories are presented. d, e Classification of annotated (d) and novel (e) merged transcripts according to the GENCODE annotation or protein-coding potential and the length of transcripts. f The expression of transcripts identified from long-read data in the seven stages quantified by using short-read data. The bar plot presents the number of annotated (left) and novel (right) transcripts classified by TPM.
Fig. 2
Fig. 2. Validation of transcripts identified from long-read data in preimplantation mouse embryos.
a Saturation of novel transcripts identified by short-read sequencing or by a combination of short- and long-read sequencing. This combination was archived by merging transcripts identified from short- and long-read data. The identified novel transcripts were annotated with the GENCODE annotation at each step. The lines and bands represent the mean and the 99% confidence interval of the number of novel transcripts identified at each step, respectively. b Sequence homology and domain analysis for novel coding transcripts. The blue prism represents significance (log10(e-value) < −5) according to both Blastp and Pfam. Green points indicate Blastp only, purple points indicate Pfam only, and gray points indicate no significance in either analysis. c The scatter plot shows the fraction of conserved bases (base-wise phyloP score > 0.972) (x axis) and the maximal 200-bp window average phastCons score (y axis) of novel non-coding transcripts. Blue points indicate transcripts with higher base-wise conservation (phyloP) relative to random control regions. Orange points indicate transcripts with higher window-based conservation (phastCons) relative to random control regions. Red points indicate transcripts that met both conservation criteria. d Association between H3K4me3 enrichment and gene expression. Red heatmaps represent the distributions of the H3K4me3 signals in the promoters of novel transcripts with novel TSSs within the annotated loci as well as novel genes overlapped with H3K4me3 peaks (±500-bp). Each row represents a promoter region of ±4 kb around the TSSs for 2-cell, 4-cell, and 8-cell. Blue heatmaps represent the distributions of TPM in the two classes of TSSs. Each row represents the TPM calculated by short-read data form 2-cell, 4-cell, and 8-cell. e, f Validation examples of identified transcripts. IGV view of the H3K4me3 density and RNA-seq alignment density in a novel isoform (e: Chr1:9790650–9907978; Sgk3) and a novel gene (f: Chr11:105,165,544–105,183,862).
Fig. 3
Fig. 3. Identification of alternative splicing (AS) events and differential splicing events in seven stages of preimplantation mouse embryos.
a Schematic diagram of the seven types of AS events. b Distributions of AS events in the seven stages. The percentages (bar) and total numbers (red line and indicated numbers) of AS events in the seven classes are presented in each stage. c Distribution of AS genes in the seven stages. The percentages (bar) and total numbers (red line and indicated numbers) of AS genes in the seven classes are presented in each stage. The percentages at the top of the bars represent the proportions of total AS genes among total genes with multiple isoforms in each stage. d Numbers of long-read transcripts gained or lost in consecutive stages. The percentages at the top of the bars represent the proportions of gained transcripts among the total transcripts of the later stage, and the percentages at the bottom of the bars represent the proportions of lost transcripts among the total transcripts of the previous stage. ek Numbers of AS events of seven types, which were gained or lost in consecutive stages. The percentages in the top of bars represent the proportion of gained events relative to the total AS events in the latter stage, and the percentages in the bottom of bars represent the proportion of lost events relative to the total AS events in the previous stage. e for SE, f for A3, g for A5, h for AF, i for RI, j for MX and k for AL.
Fig. 4
Fig. 4. AS dynamics during preimplantation embryo development.
a Heatmap showing the expression of splicing factors in six stages. Heatmap shows Z-scores of FPKM by row. The representative splicing factors that were activated during 1-cell to 2-cell transition were also presented. bd Pearson correlation between expression of Raly (b), Phf5a (c), and Snrpd3 (d) and number of AS events in six stages (from oocyte to blastocyst). e The global dynamics of differential splicing events during early embryo development. Each column represents the tracking trace for differential AS events between adjacent stages. Each bar represents the class of differential splicing events. Up: PSI upregulated; down: PSI downregulated; none: AS events showing no difference. f The GO enrichment analysis of biological processes for differential splicing events in adjacent stages. g Heatmap showing the expression of novel transcripts (including novel isoforms and novel genes) that was upregulated during the 1-cell to 2-cell transition. The heatmap shows the Z-score of TPM by row.
Fig. 5
Fig. 5. Two novel transcripts functionally involved in early embryogenesis.
a RT-PCR validation of Kdm4dl and XLOC_004958 during embryogenesis. The isoform structures of Kdm4dl and XLOC_004958 are shown in the middle; red arrows indicate the loci of the PCR primers, and the sizes of RT-PCR products are displayed. Sanger sequencing chromatograms of the RT-PCR products confirmed the splice junctions in the right panel. Representative data of two independent experiments is shown. b The relative expression of Kdm4dl and XLOC_004958 was measured by qPCR analysis. n = 2 biologically independent experiments. c Structural schematic showing the comparison of the previously annotated coding frame of Kdm4dl and the newly defined coding frame of Kdm4dl according to long-read data. In the lower panel, the newly defined protein sequence of Kdm4dl was compared with human KDM4E. Gray lines represent mismatched amino acids, white lines represent gaps, and light-yellow lines represent overlapping amino acids. d Diagram illustrating the CRISPR-mediated knockout of Kdm4dl and XLOC_004958; the scissors indicate the loci of the guide RNAs (sgRNA sequences are provided in Supplementary Table 3). e Morphological imaging of Kdm4dl and XLOC_004958 knockout embryos. The red arrows indicate abnormal blastocysts. The sgRNA-targeting GFP was defined as sgCtrl. Representative data of two independent experiments is shown. f The targeting efficiency of Kdm4dl and XLOC_004958 knockout embryos was calculated from Sanger sequencing results by TIDE (https://tide.deskgen.com/) and shown as the mean ± S.E.M. n = 3 embryos for Ctrl, n = 20 embryos for Kdm4dl, and n = 28 embryos for XLOC_004958. g The proportions of abnormal blastocysts following Kdm4dl and XLOC_004958 knockout in E4.5 embryos were calculated. n = 2 biologically independent experiments.

References

    1. Mutz KO, Heilkenbrinker A, Lonne M, Walter JG, Stahl F. Transcriptome analysis using next-generation sequencing. Curr. Opin. Biotechnol. 2013;24:22–30. - PubMed
    1. Tang F, et al. mRNA-seq whole-transcriptome analysis of a single cell. Nat. Methods. 2009;6:377–382. - PubMed
    1. Ke Y, et al. 3D chromatin structures of mature gametes and structural reprogramming during mammalian embryogenesis. Cell. 2017;170:367–381.e320. - PubMed
    1. Wang L, et al. Programming and inheritance of parental DNA methylomes in mammals. Cell. 2014;157:979–991. - PMC - PubMed
    1. Liu X, et al. Distinct features of H3K4me3 and H3K27me3 chromatin domains in pre-implantation embryos. Nature. 2016;537:558–562. - PubMed

Publication types

MeSH terms