. 2020 May 27;11(1):2661.
doi: 10.1038/s41467-020-16168-x.

hnRNP H/F drive RNA G-quadruplex-mediated translation linked to genomic instability and therapy resistance in glioblastoma

Affiliations

hnRNP H/F drive RNA G-quadruplex-mediated translation linked to genomic instability and therapy resistance in glioblastoma

Pauline Herviou et al. Nat Commun. .

Erratum in

Abstract

RNA G-quadruplexes (RG4s) are four-stranded structures known to control mRNA translation of cancer relevant genes. RG4 formation is pervasive in vitro but not in cellulo, indicating the existence of poorly characterized molecular machinery that remodels RG4s and maintains them unfolded. Here, we performed a quantitative proteomic screen to identify cytosolic proteins that interact with a canonical RG4 in its folded and unfolded conformation. Our results identified hnRNP H/F as important components of the cytoplasmic machinery modulating the structural integrity of RG4s, revealed their function in RG4-mediated translation and uncovered the underlying molecular mechanism impacting the cellular stress response linked to the outcome of glioblastoma.


Conflict of interest statement

The authors declare no competing interests.

Figures

Fig. 1
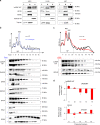
Fig. 1. Analysis of RG4 sequence or structure binding preferences by RP-MS reveals hnRNP H/F binding to unfolded RG4s.
a RNA affinity chromatography using the G3A2 sequence either native (WT, which forms RG4s) or 7-deaza-modified (7dG, unable to form RG4s) and U251 cytoplasmic cell extracts, followed by mass spectrometry (RP-MS). Proteins identified from RP-MS were sorted according to the ratio G3A2 WT/7dG (top 20 were shown) and to whether they are RBPs (based on refs. ) or RNA helicases. Data are presented as mean values ± SEM of n = 4 independent experiments, FDR < 0.05 (two-sided paired t-test). Highlighted in red are the different members of the hnRNP H/F subfamily. b Venn diagram showing the overlap of this study (Herviou, red and orange), which identified proteins bound to RG4s either folded (RG4-BPs) or unfolded (G-rich-BP), with the RG4-BPs identified in Herdy (blue) and the RBPs identified in at least 2 RNA capture methods (white). c Functional enrichment analysis of the identified high confidence 343 factors not known as RG4 binders. d, e Validation of RP-MS by performing RNA affinity chromatography using G3A2 WT, 7dG or Mut RNAs, followed by western blot analysis (d) quantified and normalized to the WT (e). Data are presented as mean values ± SEM of n = 5 independent experiments for hnRNP H/F and n = 3 independent experiments for the other proteins, *P < 0.05, **P < 0.005, NS: Non-Significant (two-sided paired t-test). Bait RNA: RNAs retained on beads. Source data and exact P-values are provided as a Source Data file. f RNA affinity chromatography using the G3A2 RNAs as in (d), treated with carboxypyridostatin (cPDS) or untreated (NT), followed by western blot analysis, quantification and normalization of the hnRNP H/F protein levels to the control (hnRNP I). Data are presented as mean values ± SEM of n = 3 independent experiments, P-value = 0.02276 and P-value = 0.3228 for the WT and 7dG RNAs, respectively, NS: Non-Significant (two-sided paired t-test). Shown is a representative result from n = 3 independent experiments. Source data are provided as a Source Data file.
Fig. 2
Fig. 2. hnRNP H/F subcellular localization and association with polysomal fractions.
a Subcellular fractionation of GBM cell lines, followed by western blot analysis of hnRNP H/F, eIF4A (cytosolic and microsomal marker), PERK (microsomal marker), histone H3 (nuclear marker) and tubulin (cytosolic marker associated to microsomes). Nuclear (N), microsomal (M), and cytosolic fractions (C). Shown is a representative result from n = 2 independent experiments. Source data are provided as a Source Data file. b Polysome profile of U251 cells untreated (NT) or puromycin treated (Puro), followed by western blot analysis from individual non-polysomal (NP) and polysomal (P) fractions by probing for hnRNP H/F, DHX36, DHX9, DDX3X, eIF4A. EEA1: negative control. RPS6: positive control. Shown is a representative result from n = 3 independent experiments. Source data are provided as a Source Data file. c As in b, except that cells were NT or treated with 20 μM carboxypyridostatin (cPDS) for 1 h, and probing for hnRNP H/F or RPL22 (negative control). Shown is a representative result from n = 2 independent experiments. Source data are provided as a Source Data file. d Repartition of hnRNP H/F proteins in polysomal fractions was quantified with n = 2 independent experiments.
Fig. 3
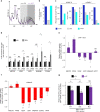
Fig. 3. hnRNP H/F drive mRNA translation of stress-response genes.
a Polysome profile of U87 cells treated with control (siCtr) and hnRNP H/F (siH/F) siRNAs. The positions of the 40S, 60S and 80S ribosomal subunits and non-polysomal (NP) and light (LP) and heavy (HP) polysomal fractions are indicated. b Fraction of RG4s (in 5′UTR, CDS, and 3′UTR regions) bound by hnRNP H/F over all RG4s predicted in the transcriptome. c Density of RG4s per Mb of hnRNP H and F binding sites, along with the -log10(P-value) of the enrichment with respect to random sites. d Immunoprecipitation (IP) of in cellulo RNA-protein complexes in U87 cells (cytoplasmic fraction) untreated (NT) or treated with 20 μM carboxypyridostatin (cPDS) for 2 h using the BG4 antibody or control IgG, followed by RT–qPCR analysis. The relative mRNA levels for each IP sample were normalized to the corresponding IP IgG and to the corresponding input sample and were plotted relatively to the HPRT mRNA (negative control). Data are presented as mean values ± SEM of n = 3 independent experiments. e As in a, but followed by RT–qPCR analysis from pooled NP, LP, HP fractions, for the indicated mRNAs and quantification by analyzing the ratio HP/total mRNAs. Data are presented as mean values ± SEM of n = 3 independent experiments. f NP, LP, HP fractions were extracted from U87 cells NT or treated with 20 μM cPDS for 1 h and RT-qPCR was performed using primers for the indicated mRNAs. Quantification and plot as in d. Data are presented as mean values ± SEM of n = 4 independent experiments. g Ratio of Renilla/Firefly luciferase activities (Rluc/Fluc) determined using U87 cells treated with siCtr and siH/F siRNAs, followed by cotransfection with USP1 RNA reporters containing the RG4 unmodified (WT), 7dG-modified (7dG) or mutated (Mut) and an internal control mRNA encoding the Fluc. Data are presented as mean values ± SEM of n = 4 independent experiments. For all the panels, *P < 0.05, **P < 0.005, ***P < 0.0005, NS: Non-Significant (two-sided paired t-test). For a, d, e, f, g data and exact P-values are provided as a Source Data file.
Fig. 4
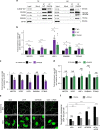
Fig. 4. hnRNP H/F collaborate with DHX36 to regulate RG4-dependent translation.
a Immunoprecipitation (IP) of U87 total (TE) or cytoplasmic (CE) extracts, followed by western blot analysis and probing with the indicated antibodies. Shown is a representative result from n = 3 independent experiments. Source data are provided as a Source Data file. b IP of in cellulo RNA-protein complexes (RIP) in cytoplasmic extracts from U87 cells with the hnRNP H/F or DHX36 antibody, followed by RT-qPCR analysis of MECP2, VEGF, USP1, BABAM1, CCNA2, HPRT mRNAs. Data are presented as mean values ± SEM of n = 5 independent experiments for MECP2 and n = 3 independent experiments for the other mRNAs, *P < 0.05, **P < 0.005, ***P < 0.0005, (two-sided paired t-test). c, d RIP as in b but after treatment with control (siCtr) siRNAs and either DHX36 (siDHX36) (c) or hnRNP H/F (siH/F) (d) siRNAs, followed by RT-qPCR analysis. The relative mRNA levels for each RIP sample in (bd) were normalized to the corresponding IP IgG and input sample, and were plotted relatively to the HPRT mRNA. Data are presented as mean values ± SEM of n = 4 independent experiments, *P < 0.05, **P < 0.005, ***P < 0.0005, NS: Non-Significant (two-sided paired t-test). e Immunofluorescence experiments in LN18 cells using the BG4 antibody after treatment with siCtr, siH/F, siDHX36 siRNAs and carboxypyridostatin (cPDS). Phase contrast served to mark the cytoplasm and the nucleus. Panels with masked nuclear signal allow visualization of the BG4 signal in the cytoplasm. Shown is a single representative field from one experiment over n = 2 independent experiments. f Quantification of BG4 cytoplasmic foci number per cell observed in e. Number of cells counted in the -RNase conditions: 7132 cells for siCtr, 4945 cells for siH/F, 7877 cells for siDHX36, 6843 cells for siCtr+cPDS; Number of cells counted in the +RNase conditions: 6844 cells for siCtr, 5901 cells for siH/F, 6770 cells for siDHX36, 6893 cells for siCtr+cPDS. Data are presented as mean values ± SEM, statistical significance was performed on the full cell populations *P < 0.05, **P < 0.005, ***P < 0.0005, NS: Non-Significant (two-sided Kolmogorov–Smirnov test). For bd, f source data and exact P-values are provided as a Source Data file.
Fig. 5
Fig. 5. hnRNP H/F drive genomic instability and therapy resistance.
a Immunofluorescence experiments in LN18 cells using the γ-H2AX, 53BP1 antibodies and DAPI staining. Mean intensities of γ-H2AX and 53BP1 in 2322 cells were plotted; the bottom and top of the box present the first and third quartile, respectively; the band inside the box shows the mean and the whiskers show the upper and lower extremes. Statistical significance was performed on the full cell populations. n = 2322 cells examined. Shown is a single representative field from one experiment over n = 2 independent experiments. For γ-H2AX: ***P-value = 4.26e-10, for 53BP1: ***P < 2.2e-16 (two-sided Mann & Whitney test). b Western blot analysis of γ-H2AX in LN18 cells treated with dose scale of carboxypyridostatin (cPDS) for 24 h. Shown is a representative result from n = 3 independent experiments. c Quantification of the γ-H2AX levels in LN18 treated with cPDS normalized to GAPDH levels and plotted relatively to the untreated condition. Data are presented as mean values ± SEM of n = 3 independent experiments, P-value = 0.0157 and P-value = 0.0457 for the 2 µM and 10 µM cPDS treatment respectively (two-sided paired t-test). d Quantification of DNA repair kinetics by western blot analysis of γ-H2AX after 4 Gy γ-irradiation in LN18 cells treated with control (siCtr) or hnRNP H/F (siH/F) siRNAs. Shown is a representative result from n = 2 independent experiments. e Plating efficiency assays measuring the cell survival fraction in LN18 treated with siCtr or siF siRNAs and submitted to a radiation dose scale. Data are presented as mean values ± SEM of 6 wells, P-value = 0.0003 and P-value = 0.0006 for the 2 Gy and 4 Gy dose, respectively (two-sided paired t-test). f Quantification of DNA repair kinetics by western blot analysis of γ-H2AX after temozolomide (TMZ) treatment in LN18 cells transfected with an empty plasmid (pICE) or a plasmid expressing Flag-hnRNP H/F. Shown is a representative result from n = 2 independent experiments. For all panels, source data are provided as a Source Data file.
Fig. 6
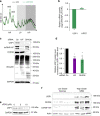
Fig. 6. hnRNP H/F and DHX36 regulate USP1 translation in glioblastoma cells and tumors.
a Polysome profile of U87 cells treated with control (siCtr) and DHX36 (siDHX36) siRNAs. b As in a, followed by RT–qPCR analysis from pooled non-polysomal (NP), light (LP) and heavy (HP) polysomal fractions, using specific primers for USP1 and HPRT mRNAs, and quantification by analyzing the ratio HP/total mRNAs from n = 2 independent experiments. Source data are provided as a Source Data file. c Western blot analysis of USP1 and ubiquitination in U87 cells treated with siCtr, siRNAs against hnRNP H/F (siH/F) or DHX36 (siDHX36). Source data are provided as a Source Data file. d USP1 protein levels in c were normalized first to GAPDH protein levels and then to USP1 mRNA levels and plotted relatively to the siCtr condition. Data are presented as mean values ± SEM of n = 3 independent experiments, P-value = 0.0291 and P-value = 0.05 for siH/F and siDHX36 respectively (two-sided paired t-test). e Western blot analysis of USP1 in LN18 cells treated with carboxypyridostatin (cPDS) dose scale for 24 h. Shown is a representative result from n = 3 independent experiments. Source data are provided as a Source Data file. f Western blot analysis of USP1, DHX36 and hnRNP H/F levels in protein extracts from Diffuse Low Grade Gliomas (Grade II) and High Grade GBM (grade IV). Shown is a representative result from n = 3 independent western blot. Source data are provided as a Source Data file.
Fig. 7
Fig. 7. Model for the role of hnRNP H/F-RG4 interactions in regulating mRNA translation of mRNAs linked to GBM response to treatments.
hnRNP H/F expression levels in GBM modulate the RG4-dependent mRNA translation impacting the DDR response involved in the response to standard GBM treatments (radiotherapy and chemotherapy). The underlying mechanism involves the binding of the helicase DHX36 that unwinds the RG4s, enabling hnRNP H/F to associate with unfolded RG4s and maintain them linear.

Similar articles

Cited by

References

    1. Wang ZL, et al. Comprehensive genomic characterization of RNA-binding proteins across human cancers. Cell Rep. 2018;22:286–298. - PubMed
    1. Pereira B, Billaud M, Almeida R. RNA-binding proteins in cancer: old players and new actors. Trends Cancer. 2017;3:506–528. - PubMed
    1. Cammas A, Millevoi S. RNA G-quadruplexes: emerging mechanisms in disease. Nucleic Acids Res. 2017;45:1584–1595. - PMC - PubMed
    1. Huppert JL, Bugaut A, Kumari S, Balasubramanian S. G-quadruplexes: the beginning and end of UTRs. Nucleic Acids Res. 2008;36:6260–6268. - PMC - PubMed
    1. von Hacht A, et al. Identification and characterization of RNA guanine-quadruplex binding proteins. Nucleic Acids Res. 2014;42:6630–6644. - PMC - PubMed

Publication types

MeSH terms

Substances