. 2020 May;581(7809):470-474.
doi: 10.1038/s41586-020-2192-1. Epub 2020 Apr 15.

The stepwise assembly of the neonatal virome is modulated by breastfeeding

Affiliations

The stepwise assembly of the neonatal virome is modulated by breastfeeding

Guanxiang Liang et al. Nature. 2020 May.

Abstract

The gut of healthy human neonates is usually devoid of viruses at birth, but quickly becomes colonized, which-in some cases-leads to gastrointestinal disorders1-4. Here we show that the assembly of the viral community in neonates takes place in distinct steps. Fluorescent staining of virus-like particles purified from infant meconium or early stool samples shows few or no particles, but by one month of life particle numbers increase to 109 per gram, and these numbers seem to persist throughout life5-7. We investigated the origin of these viral populations using shotgun metagenomic sequencing of virus-enriched preparations and whole microbial communities, followed by targeted microbiological analyses. Results indicate that, early after birth, pioneer bacteria colonize the infant gut and by one month prophages induced from these bacteria provide the predominant population of virus-like particles. By four months of life, identifiable viruses that replicate in human cells become more prominent. Multiple human viruses were more abundant in stool samples from babies who were exclusively fed on formula milk compared with those fed partially or fully on breast milk, paralleling reports that breast milk can be protective against viral infections8-10. Bacteriophage populations also differed depending on whether or not the infant was breastfed. We show that the colonization of the infant gut is stepwise, first mainly by temperate bacteriophages induced from pioneer bacteria, and later by viruses that replicate in human cells; this second phase is modulated by breastfeeding.


Figures

Extended Data Fig. 1 |
Extended Data Fig. 1 |. Overview of total stool microbial shotgun metagenomic sequencing.
a, Percentage of reads mapped to human, microbial genomes or unassigned. Times of sampling are indicated above the graphs. Types of DNA detected are summarized at the right. b, Correlation between human DNA percentage with sampling time after delivery using month 0 samples (n = 20). The percentage of human DNA is shown on the y-axis, and the sampling time after delivery is shown on the x-axis. The black dashed line shows the linear regression line and the gray-shaded region shows the 95% confidence interval for the slope. Two-sided Spearman’s rank-order correlation method was used to test significance (R represents Spearman’s ρ). c, Taxonomic composition of bacteria at the phylum level. The total read number was shown on the y-axis, and x-axis represents different samples. d, Bacterial richness. The Y-axis indicates the richness calculated by observed species number. e, Bacterial diversity. Y-axis indicates the Shannon index. In d and e, two-sided Wilcoxon rank-sum test was used to test the difference between different ages (n = 20 subjects at three time points). The horizontal lines in boxplots represent the third quartile, median and first quartile. The dots represent the outliers.
Extended Data Fig. 2 |
Extended Data Fig. 2 |. Summary of infant stool virome sequencing.
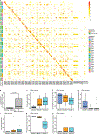
a, Heat map summarizing representation of the top five most abundant DNA viral contigs in each sample. Samples are grouped sequentially by subject on both the x-axis and y-axis. The last group of subjects on x-axis are negative control samples. Circularity indicates whether a contig is circular (orange color) or not (light green color). The heatmap map color represents the abundance (log transformed reads per million total reads value) of each contig in each sample. b, Contig read abundance compared between different subjects versus within the same subjects. Time points were pooled for each individual. c-e, Percentage of DNA virome reads assigned as Viruses (c), unassigned (d), and contamination (e). f-h, Percentage of RNA virome reads assigned as Viruses (f), unassigned (g), and contamination (h). In b-h, n = 20 subjects at three time points were tested. The horizontal lines in boxplots represent the third quartile, median and first quartile. The dots represent the outliers.
Extended Data Fig. 3 |
Extended Data Fig. 3 |. Correlation between viral and bacterial community.
a, Pairwise correlations among sample measures including: VLP count number, bacterial 16S qPCR copy number, viral richness, bacterial sequence read proportion, bacteria richness and diversity. The size of circles indicates the R value of the correlation. Blue color indicates positive correlation, and red color indicates negative correlation. Samples from different time points were pooled (n = 60). Two-sided Spearman’s rank-order correlation method was used in this analysis. b, As in a, but showing the raw data of the statistical analysis. P values, FDR corrected p values and R (Spearman’s ρ) are presented.
Extended Data Fig. 4 |
Extended Data Fig. 4 |. Life cycles of bacteriophages.
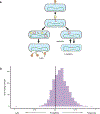
a, Diagram of lytic and lysogenic bacteriophage replication (based on Ptashne). Not shown are additional phage replication strategies including chronic infection and pseudolysogeny. b, Prediction of replication modes from contig sequences using PHACTS. The X-axis indicates the probability that a contig belongs to a lytic or temperate phage predicted by PHACTS. The Y-axis indicates the viral contig number. In total, 1029 bacteriophage contigs with at least 10 open read frames were used in this analysis. Of 1029 contigs, 233 were predicted as lytic and 794 were predicted as temperate. Probability values obtained from PHACTS were standardized between −1 and 1, which was presented as probability to “Lytic” or “Temperate”.
Extended Data Fig. 5 |
Extended Data Fig. 5 |. Prophage induction in the early life virome.
a, Comparison of the extent of sequence alignment of induced VLP sequences from bacterial strains compared to VLP sequences from stool. Contigs were generated from mitomycin C induced VLPs from purified stool bacterial strains (n = 33 phage contigs from 16 bacterial isolates), then VLP reads from feces aligned to these contigs and quantified. “Within infants” indicates matching stool VLP to induced VLP from purified bacteria for samples all from the same infant, and “Between infants” indicates alignment of stool VLP versus induced VLP from different infants. The horizontal lines in boxplots represent the third quartile, median and first quartile. The dots represent the outliers. Samples were compared using the two-sided Wilcoxon rank-sum test. b, Correlation between the proportion of each bacteria in the infant gut community and the proportion of that bacteria’s prophages in the infant’s gut virome. This plot is based on VLP sequences of phages produced by spontaneous induction (n = 42 phage contigs from 20 bacterial isolates). This is different from Fig. 2d, which is based on VLP sequences of phages produced after induction with mitomycin C. The black dashed line shows the linear regression line and the gray-shaded region shows the 95% confidence interval for the slope. Correlation was tested using two-sided Spearman’s rank-order correlation (R represents Spearman’s ρ).
Extended Data Fig. 6 |
Extended Data Fig. 6 |. Colonization by crAssphage in different age groups.
Grey color bars indicate the percentage of crAssphage positive subjects (as scored by requiring that the crAssphage genome was more than 33% covered by sequence reads from stool VLPs).
Extended Data Fig. 7 |
Extended Data Fig. 7 |. Animal cell viruses profiling by virome sequencing.
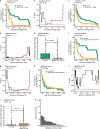
a, c, f, h Percentage of animal cell virus positive subject using different viral genome coverage cutoffs in the discovery cohort (a, f) and validation cohort (c, h). The percentage of animal cell virus positive subjects is shown on the y-axis, and different viral genome coverage cutoffs are shown in x-axis. The green line presents the data from subjects with Formula feeding type (a, c) or C-section delivery (f, h), the and yellow line presents the data from subjects with Breast milk or mixed feeding type (a, c) or spontaneous vaginal delivery type (f, h). b, d, g, i Two-sided Fisher’s exact test on infant feeding types (b, d) and delivery types (g, i) using different viral genome coverage cutoff in the discovery cohort (b, g) and validation cohort (d, i). The P values are shown on y-axis, and different viral genome coverage cutoffs are shown in x-axis. The horizontal red line indicates P = 0.05. e, j, Comparison of relative abundance of animal cell viruses between different feeding types (e) and delivery types (j). The abundance (reads per million total reads after log transformation) is shown on y-axis. Two-sided Wilcoxon rank-sum test was used to test the difference. The horizontal lines in boxplots represent the third quartile, median and first quartile. The dots represent the outliers. K, Genome coverage fraction of negative control samples for animal cell viruses. The maximal animal viral genome coverage faction for each negative control sample (n = 25) is shown on Y-axis. Different negative control samples are shown on x-axis. Note that coverage never exceeds 10%. In a, b, f, and g, n = 20 samples from discovery cohort were used, and in c, d, e, h, I, and j, n = 125 samples from validation cohort were used.
Extended Data Fig. 8 |
Extended Data Fig. 8 |. Phage population structure.
a, Statistical test of the association of clinical variables with phage population structure. Variables are shown in the first column. P values and FDR corrected p values are shown in the second and third column. All categorized variables, such as infant age, infant feeding type, infant delivery type, infant gender, mother body type, formula type, mother pregnancy induce HTN or diabetes and mother Chorioamnionitis were tested by PERMANOVA. Continuous variables, including gestational age, infant birth weight, household underage number, household number, and mother pregnancy weight gain were tested by Envfit. All samples from both discovery US and validation US cohorts (n = 185) were used to test infant age effects, and pooled samples at month 3 and month 4 from both discovery US and validation US cohorts (n = 145) were used to test other variables. b, Principal Coordinate Analysis (PCoA) plot based on phage Pfam counts per sample, colored by infant ages. This analysis is based on the Bray-Curtis dissimilarity index for all stool samples from both discovery US and validation US cohorts (n = 185). Negative control samples were not included for Bray-Curtis dissimilarity assessment and statistical test. c, d, e, Principal Coordinate Analysis (PCoA) plot of phage Pfam components, colored by infant feeding types (c), delivery type (d), and infant gender (e). This analysis is based on pooled samples at month 3 and month 4 from both discovery US and validation US cohorts (n = 145), and mentioned in a, PERMANOVA was used to test the differences. FDR corrected p values are shown.
Extended Data Fig. 9 |
Extended Data Fig. 9 |. 16S qPCR before and after VLPs purification.
Red and light blue dots show before and after separately, and the horizontal lines represent means (n = 20 subjects at three time points were tested). Two-sided Wilcoxon signed-rank test was used to test the difference.
Extended Data Fig. 10 |
Extended Data Fig. 10 |. Percentage of DNA aligning to sequences of human endogenous retroviruses in each sample.
The percentage of HERV sequences in stool VLP is shown on the y-axis. Sample type and time point is shown on the x-axis. The proportion of HERV sequences paralleled those of LINE and SINE elements, indicating they are derived from human DNA contamination. Barplot shows the mean ± s.e.m., and n = 20 subjects at three time points were tested.
Fig. 1|
Fig. 1|
Detection and characterization of virus-like particles (VLPs) in infant gut samples. a, Representative fields of fluorescently stained VLPs from infant stool sampled at month 0, 1, and 4. Scale bar = 10 μm. b, Quantification of VLP counts per gram. The minimum level of quantification was 6.6×10⁶ particles per gram (5 to 10 fields quantified per sample). c, Copy numbers of bacterial 16S rRNA genes analyzed using qPCR. The minimum level of quantification was 2000 copies per gram. d, VLP richness assessed using VLP metagenomic sequence data. Sequences reads were assembled into contigs, and contigs with viral character (at leat 50% of open reading frames annotating as viral) enumerated. Viral species were called present if at least 10 reads per million from one sample aligned to that contig. e, Taxonomic assignments of VLP sequences. Reads were associated with viral lineages based on annotation of viral contigs. In bd, violin plots represent the actual distribution of the individual data sets, and samples were compared using two-sided Wilcoxon signed-rank tests.
Fig. 2|
Fig. 2|
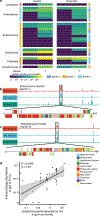
Prophage induction as the dominant contributor to the early life virome. a, Heatmap quantifying VLP production from 24 strains isolated from feces of the infants studied. The bacterial genera are summarized on the left; columns summarize the numbers of fluorescent particles produced per ml of stationary phase culture (scale at bottom). Columns compare particle production with and without inducer (mitomycin C), and growth under aerobic and anaerobic conditions. b, Draft genome (horizontal line) from Enterococcus faecalis from one of the infants studied, showing alignment frequency of reads from VLP preparations. Reads were aligned to the bacterial genome that were generated from VLPs from pure culture after mitomycin treatment (red), from VLPs from pure culture in the absence of any inducer (blue), and from VLPs isolate from stool of the the infant from which the bacterial strain was isolated (green). Peaks indicate detection of integrated prophages. One putative bacteriophage genome is shown below, with gene types color coded as indicated. c, As in b, but showing a Klebsiella pneumoniae isolate. d, Correlation between abundance of VLPs present in infant stool and the abundance of the bacteria harboring those prophages in the same stool sample (n = 33 phage contigs from 16 bacterial isolates from month 1 and month 4 srtrains). The black dashed line shows the linear regression line and the gray-shaded region shows the 95% confidence interval for the slope (two-sided Spearman’s rank-order correlation).
Fig. 3|
Fig. 3|
Breastfeeding and viral colonization of the infant gut. a, Quantification of the percentage of subjects positive for viruses of human cells in metagenomic virome sequence data. Virus types are shown along the y-axis, percent of subjects positive is on the x-axis. Sample sizes and cohorts studied are indicated at the top. The two feeding types are color coded. Summation over all families is at the bottom. b, Comparison of human virus colonization based on feeding type using quantitative PCR. Three technical replicates were compared for each sample. In a, b, the numbers of infants with formula and breast milk or mixed are 14 and 6 in discovery cohort, 46 and 79 in validation cohort from US urban, and 30 and 70 in validation cohort from Africa. c, Abundances of the Bifidobacterium and Lactobacillus bacterial genera separated by feeding type. Samples were compared using two-sided Wilcoxon rank-sum tests with FDR correction. Bars represent mean ± s.e.m. d, Percentage of positive subjects with bacteriophages annotated as infecting Bifidobacterium or Lactobacillus. In c, d, 103 (Formula, n = 59; Breast milk or mixed, n = 44) samples from both discovery and validation cohorts were used for which whole stool shotgun sequence data was available. In a, b, d, samples were compared using two-sided Fisher’s exact tests. Error bars represent 95% confidence intervals. In a-d, ***P < 0.001, **P < 0.01, *P < 0.05. e, Summary of the findings in this study.

References

    1. Breitbart M et al. Viral diversity and dynamics in an infant gut. Res Microbiol 159, 367–373, doi:10.1016/j.resmic.2008.04.006 (2008). - DOI - PubMed
    1. Lim ES et al. Early life dynamics of the human gut virome and bacterial microbiome in infants. Nat Med 21, 1228–1234, doi:10.1038/nm.3950 (2015). - DOI - PMC - PubMed
    1. Liu L et al. Global, regional, and national causes of under-5 mortality in 2000–15: an updated systematic analysis with implications for the Sustainable Development Goals. Lancet 388, 3027–3035, doi:10.1016/S0140-6736(16)31593-8 (2016). - DOI - PMC - PubMed
    1. Oude Munnink BB & van der Hoek L Viruses Causing Gastroenteritis: The Known, The New and Those Beyond. Viruses 8, doi:10.3390/v8020042 (2016). - DOI - PMC - PubMed
    1. Kim MS, Park EJ, Roh SW & Bae JW Diversity and abundance of single-stranded DNA viruses in human feces. Appl Environ Microbiol 77, 8062–8070, doi:10.1128/AEM.06331-11 (2011). - DOI - PMC - PubMed

Publication types