. 2020 May;581(7809):480-485.
doi: 10.1038/s41586-020-2292-y. Epub 2020 May 20.

Origin of complexity in haemoglobin evolution

Affiliations

Origin of complexity in haemoglobin evolution

Arvind S Pillai et al. Nature. 2020 May.

Erratum in

Abstract

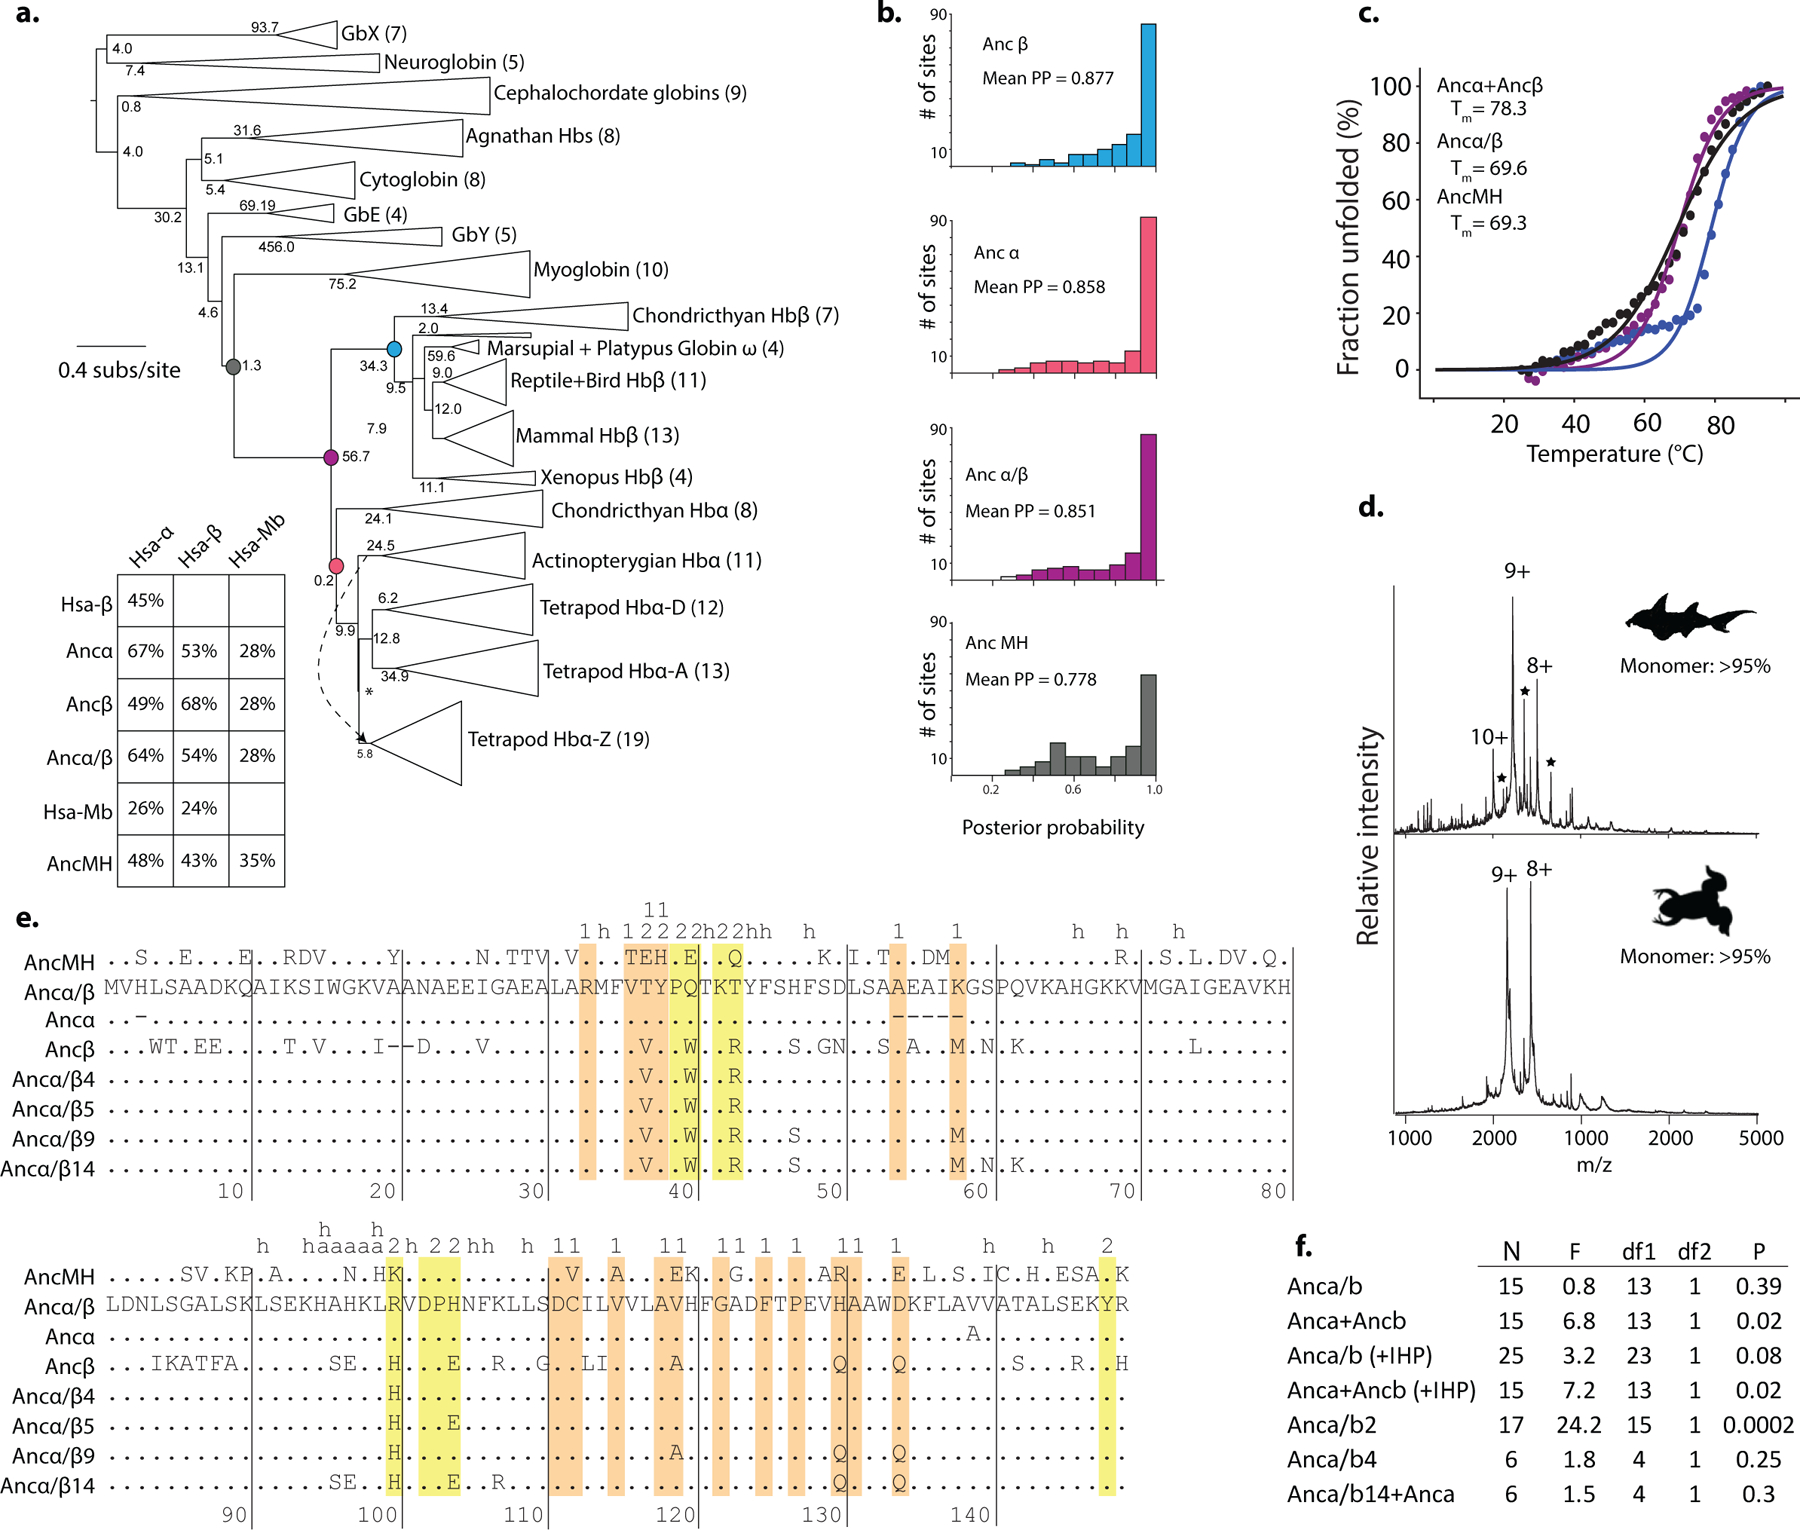
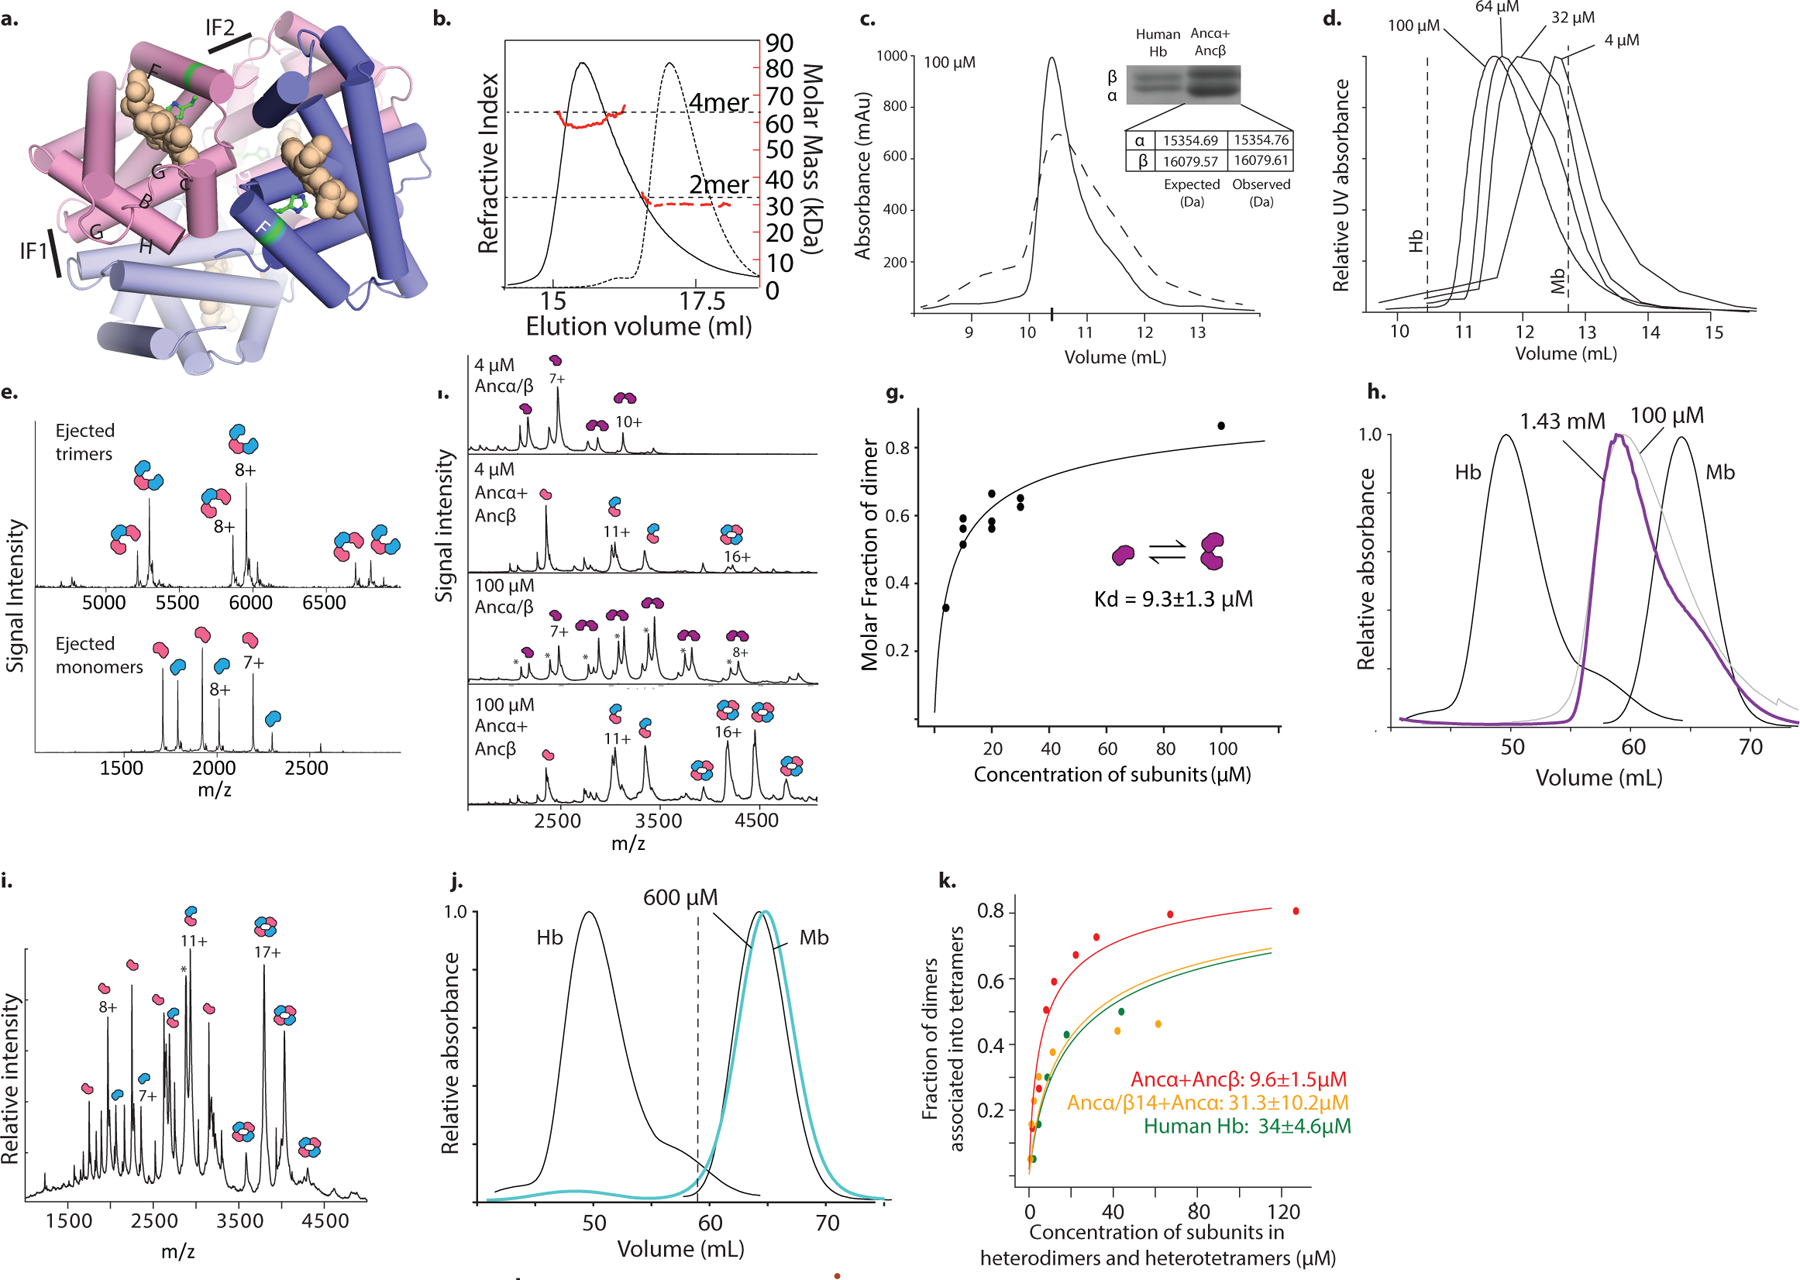
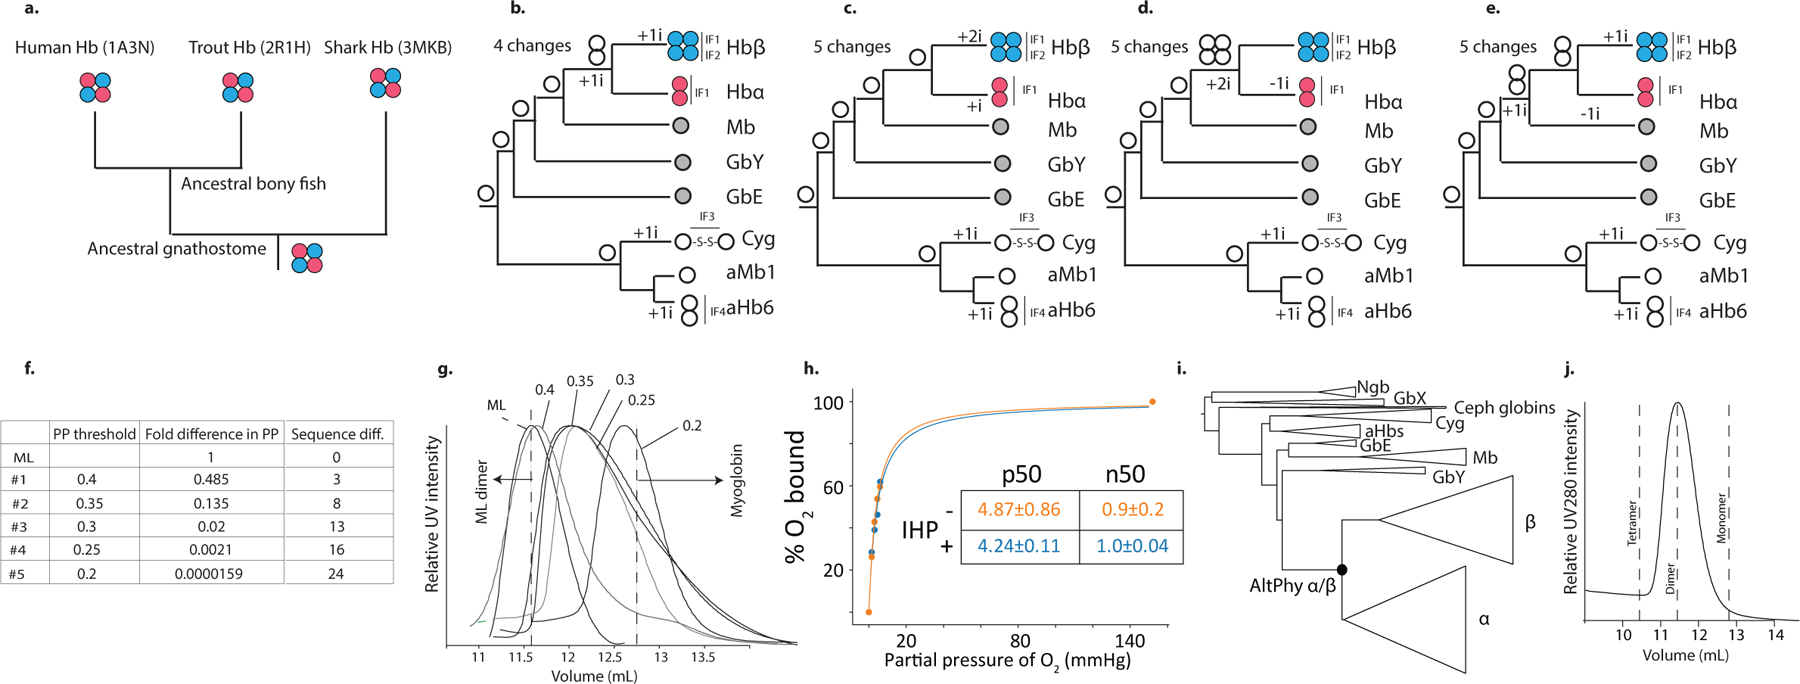
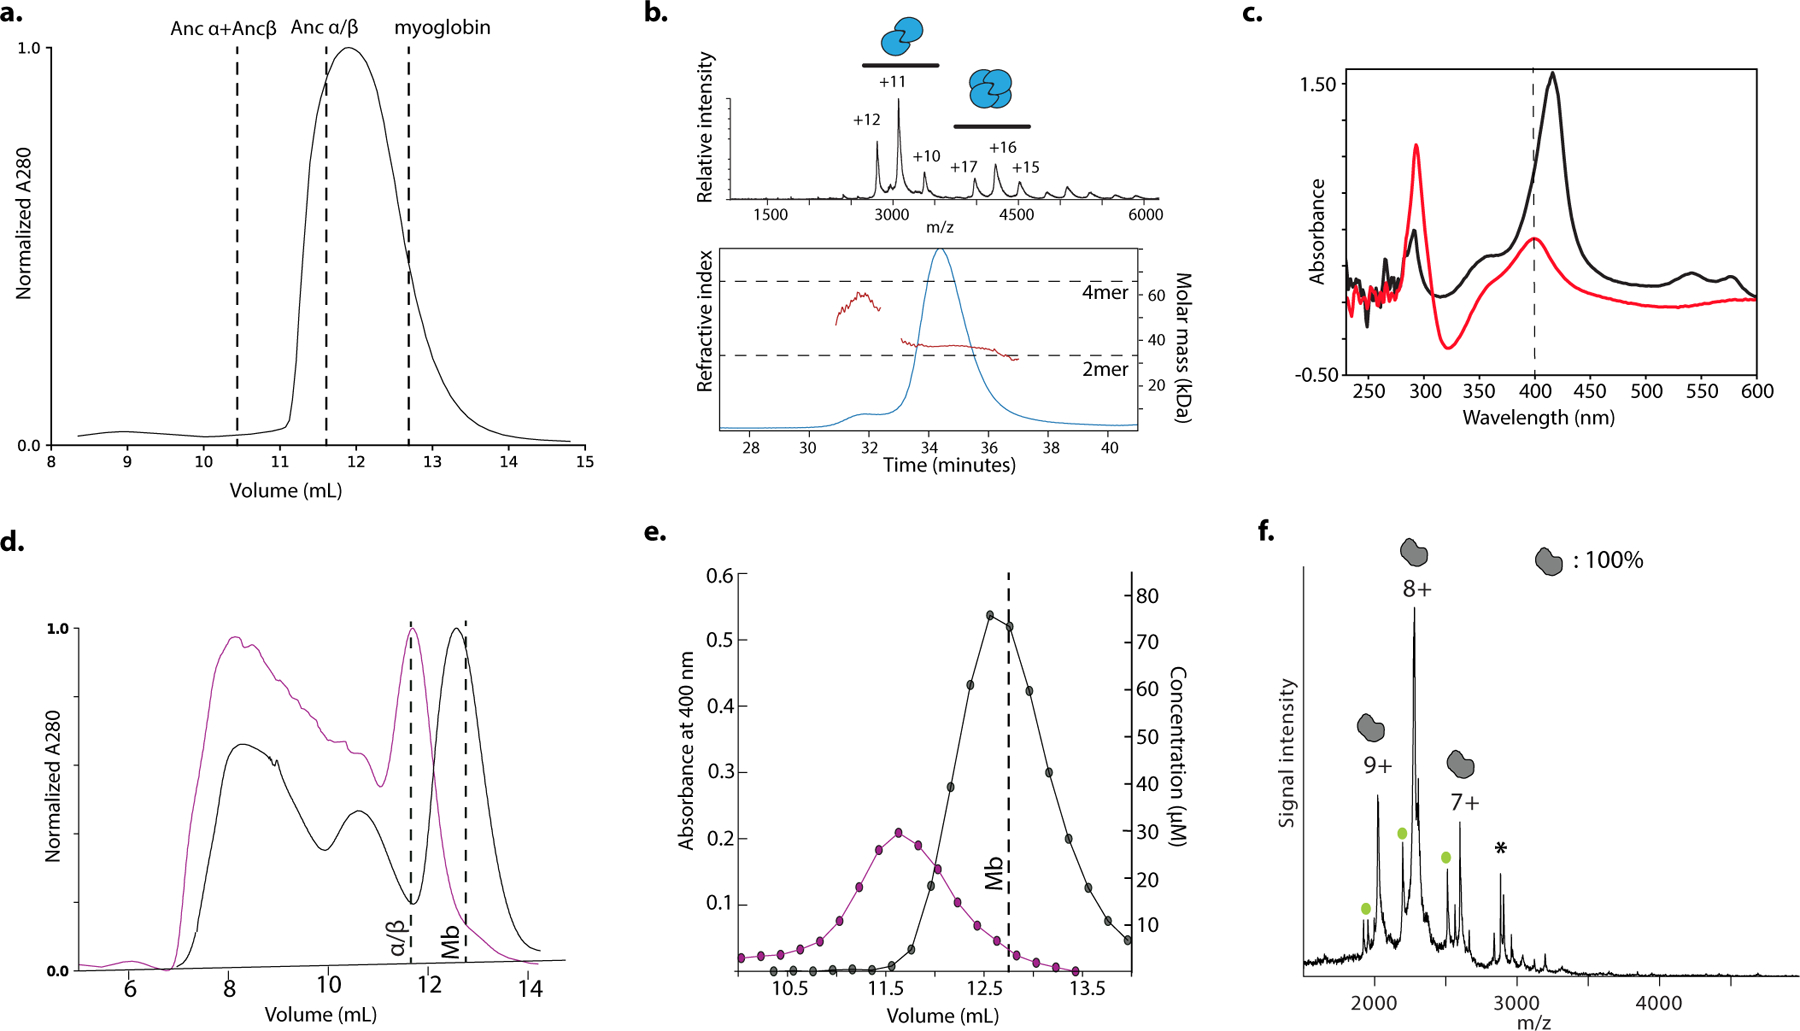
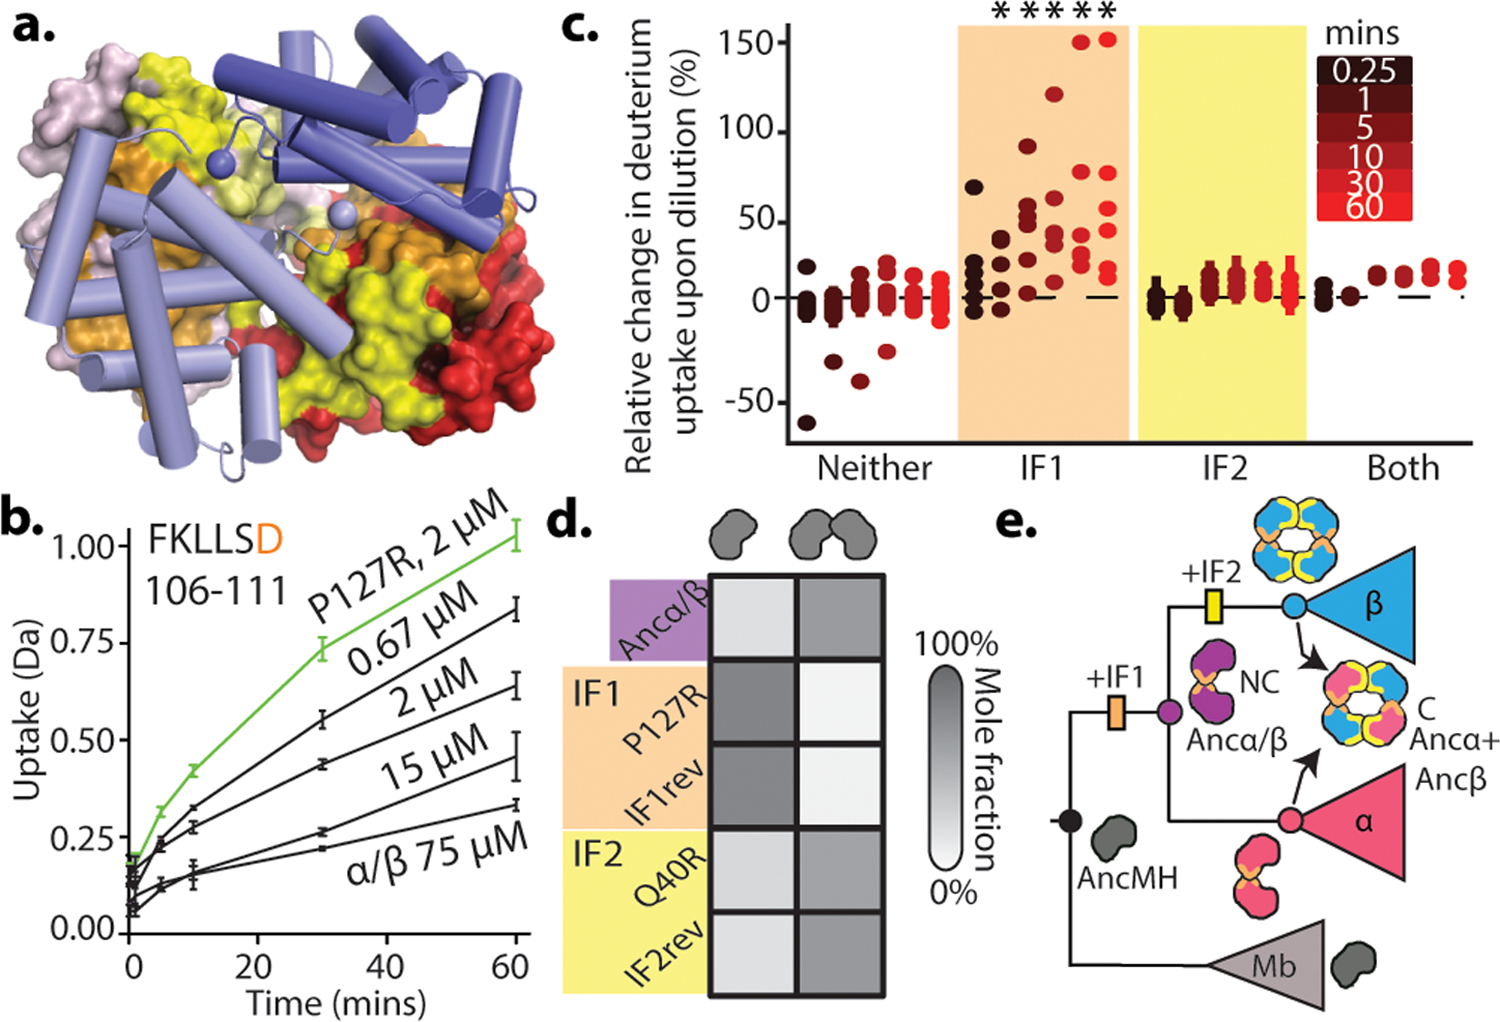
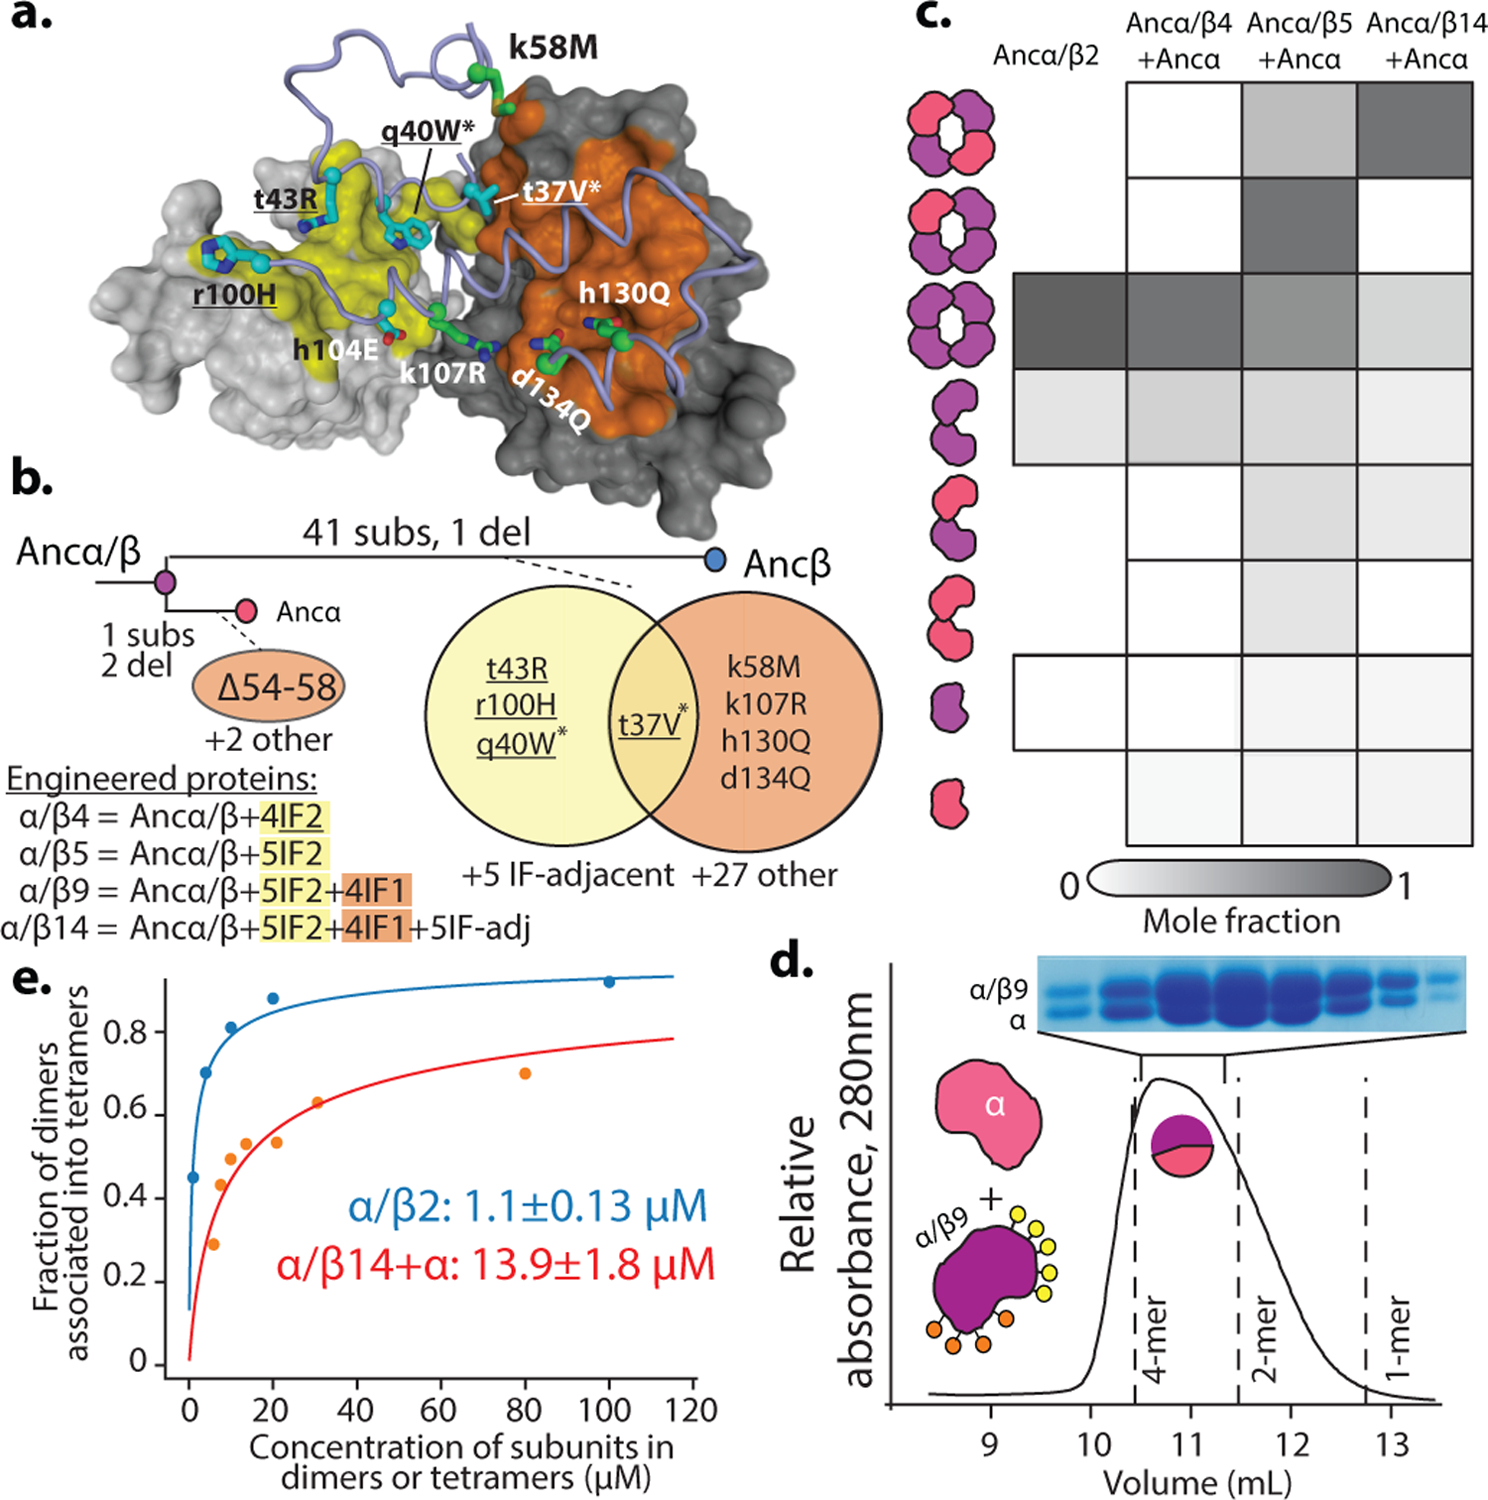
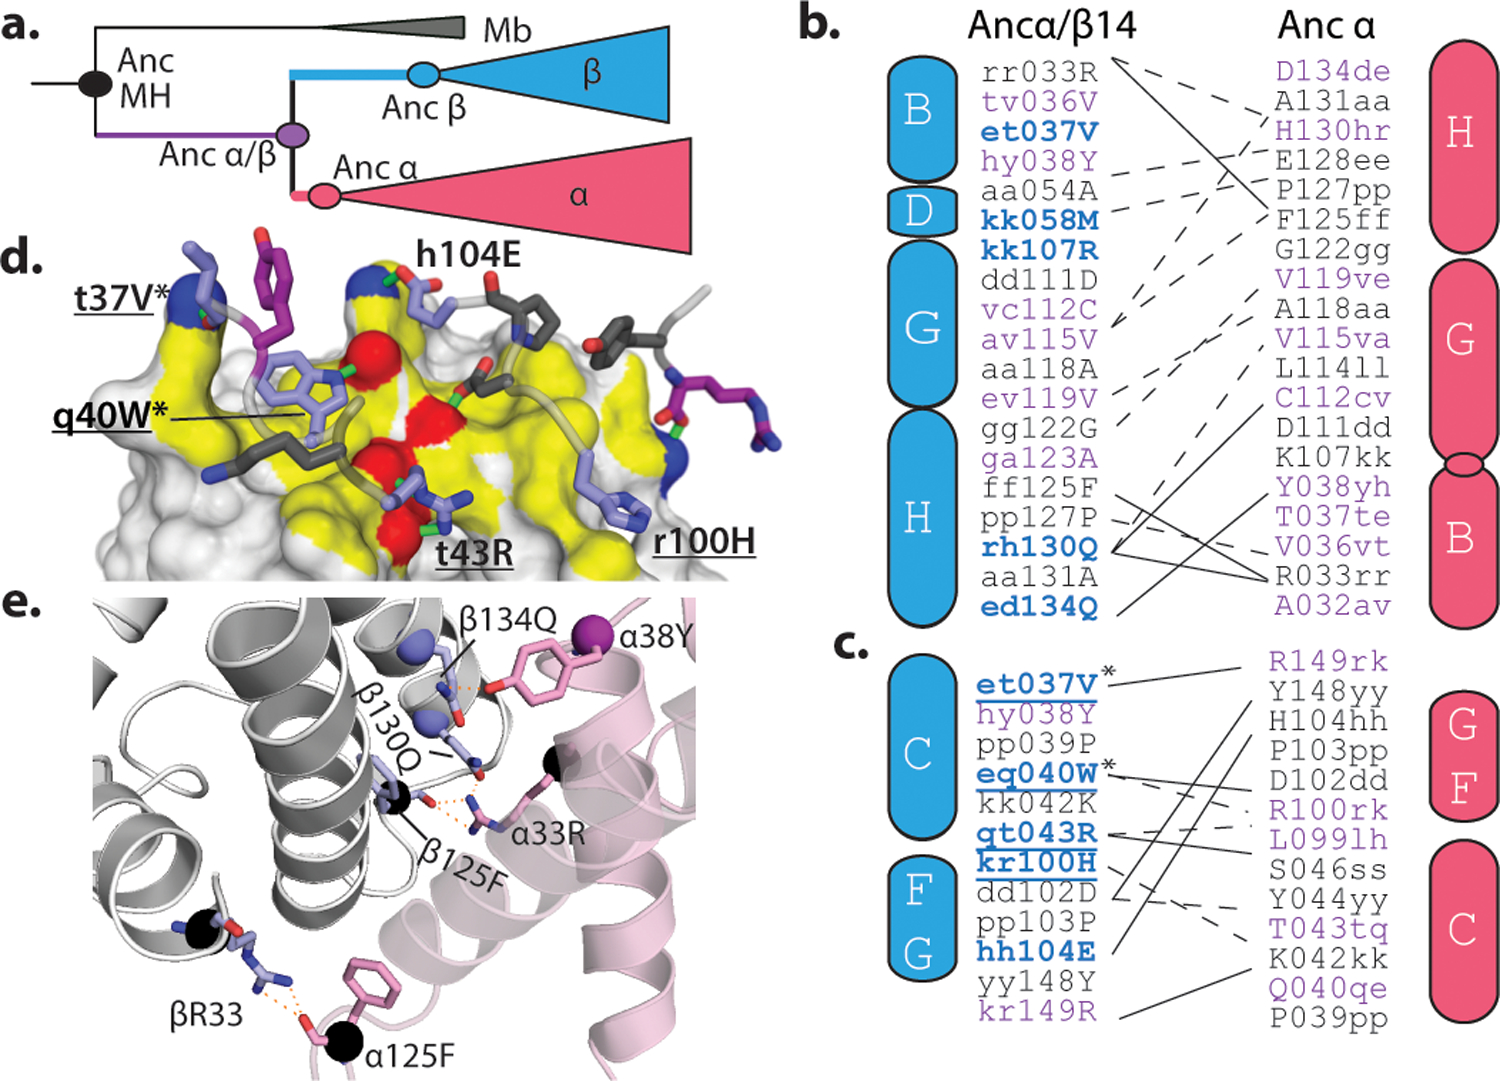
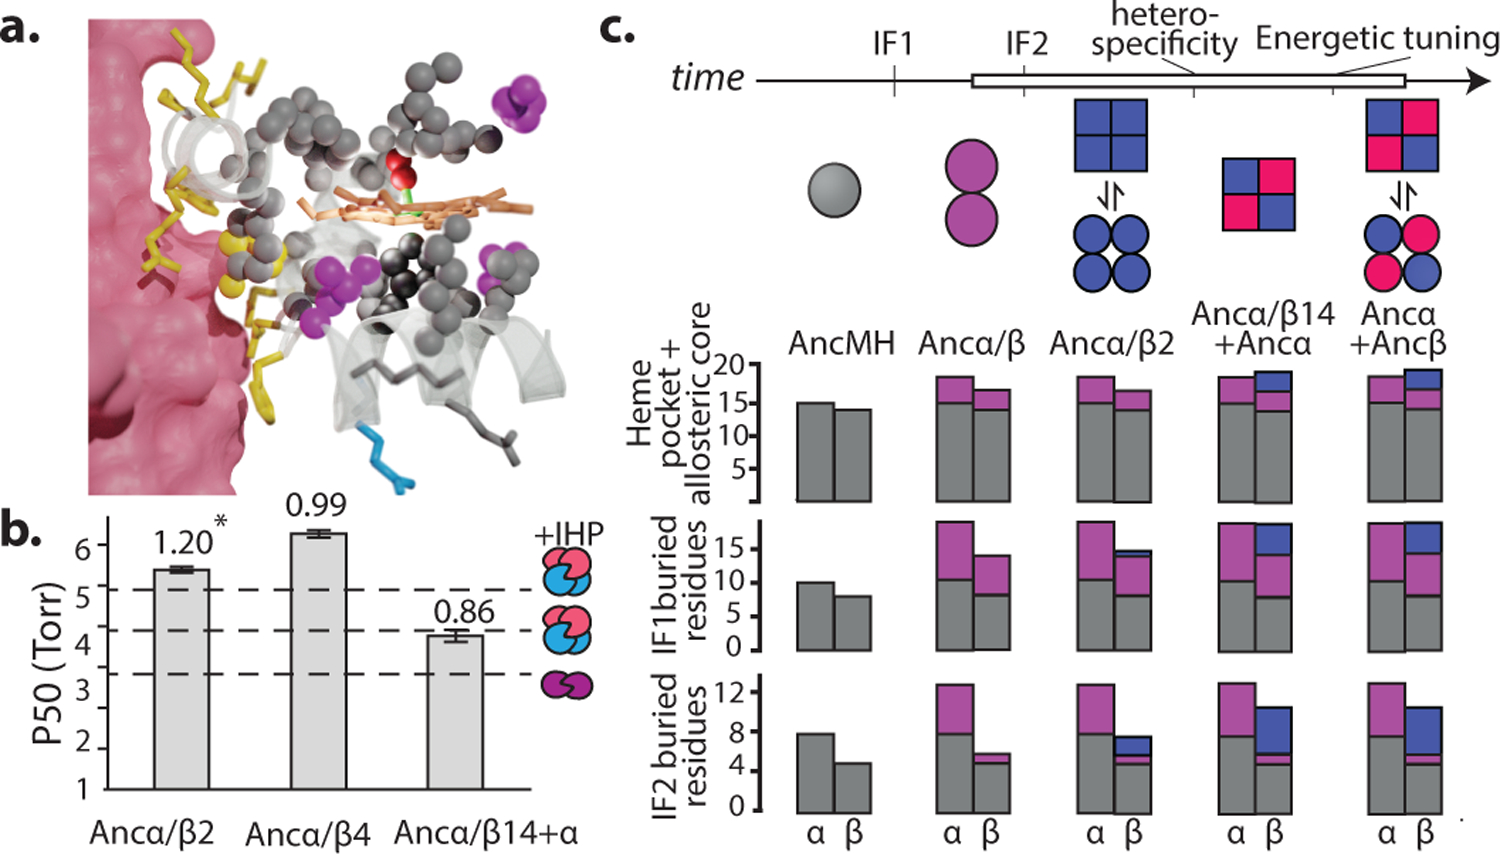
Most proteins associate into multimeric complexes with specific architectures1,2, which often have functional properties such as cooperative ligand binding or allosteric regulation3. No detailed knowledge is available about how any multimer and its functions arose during evolution. Here we use ancestral protein reconstruction and biophysical assays to elucidate the origins of vertebrate haemoglobin, a heterotetramer of paralogous α- and β-subunits that mediates respiratory oxygen transport and exchange by cooperatively binding oxygen with moderate affinity. We show that modern haemoglobin evolved from an ancient monomer and characterize the historical 'missing link' through which the modern tetramer evolved-a noncooperative homodimer with high oxygen affinity that existed before the gene duplication that generated distinct α- and β-subunits. Reintroducing just two post-duplication historical substitutions into the ancestral protein is sufficient to cause strong tetramerization by creating favourable contacts with more ancient residues on the opposing subunit. These surface substitutions markedly reduce oxygen affinity and even confer cooperativity, because an ancient linkage between the oxygen binding site and the multimerization interface was already an intrinsic feature of the protein's structure. Our findings establish that evolution can produce new complex molecular structures and functions via simple genetic mechanisms that recruit existing biophysical features into higher-level architectures.


Conflict of interest statement

Competing interests. The authors declare no competing interests.

Figures

Extended Figure 1.
Extended Figure 1.
Reconstruction of ancestral hemoglobin and precursors. a) Phylogeny of Hb and related globins. Node supports are shown as approximate likelihood ratio statistic,. Numbers of sequences in each group are shown in parentheses. Ancestral sequences reconstructed in this study are shown as colored circles. Arrow, branch swap that differentiates this phylogeny from the unconstrained maximum likelihood phylogeny, which requires additional gene gains/losses. The tree is rooted on neuroglobin and globin X, paralogs that duplicated prior to the divergence of deuterostomes and protostomes. Inset: Pairwise sequence identities among extant (human, Hsa) and reconstructed ancestral globins. b) Distribution across sites of the posterior probabilities (PP) of maximum a posteriori states for reconstructed ancestral proteins. c) Thermal stability of ancestral globins. Points, fraction of secondary structure lost as temperature increases in Ancα/β (purple), Ancα+Ancβ (blue) and AncMH (black), measured by circular dichroism spectroscopy at 222 nm, relative to signal at 23°C. Estimated Tm and SE from nonlinear regression and the best-fit curve (lines) are shown. Each point is the mean of 4 measurements. d) Native mass spectra (nMS) of Globin Y (GbY) from elephant shark (Callorhinchus milii) and African clawed frog (Xenopus laevis) at 30 μM. Charge states of heme-bound monomer shown. Asterisk, cleavage products. Spectra were collected once. e) Sequence alignment of reconstructed ancestral globins. Dots, states identical to Ancα/β. Yellow, IF2 sites; Orange, IF1 sites; h, sites 4 Å away from the heme; a, sites that link the heme-coordinated proximal histidine (H95) to IF2. f) Statistical test of cooperativity of oxygen binding for ancestral proteins and mutants. An F-test was used to compare the fit of a model in which the Hill coefficient (n) is a free parameter to a null model with no cooperativity (n=1). Computed P-value and degrees of freedom (df) are shown. N, number of concentrations measured. *, P<0.05. Data were pooled across replicate experiments for nonlinear regression.
Extended Figure 2.
Extended Figure 2.. Stoichiometric characterization of ancestral globin complexes.
a) Homology model of Ancα+Ancβ (template 1A3N) showing heme (tan spheres). Blue cartoon, Ancβ subunits; red, Ancα. Helices and interfaces are labelled. Green, proximal histidine. b) Size exclusion chromatography and multiangle light scattering of Ancα/β (90 μM) and Ancα + Ancβ (60 μM). Black, relative refractive index. Red, estimated molar mass. Dotted lines, expected mass for dimers and tetramers. c) SEC of human Hb (dashed) and Ancα+Ancβ (solid) at 100 μM. Inset, SDS-PAGE of these complexes, with bands corresponding to α and β subunits. Inset, masses estimated by denaturing MS of Ancα+Ancβ, compared to expected masses based on primary sequence. d) SEC of Ancα/β across a series of concentrations. Dotted lines, elution peak volumes of human hemoglobin tetramer and myoglobin monomer. e) Tandem MS of the heterotetrameric peak in the Ancα + Ancβ nMS (indicated Fig 1b). Ejected monomer and trimer charge series and the subunits they contain are shown. f) nMS of Ancα+Ancβ and Ancα/β at 4 μM and 100 μM. Charge series and fitted stoichiometries are indicated. Dotted peaks represent apo-chains. g) Monomer-dimer association by Ancα/β. Abundance of monomer and dimer were characterized using nMS across a range of concentrations. Circles, fraction of all subunits that were assembled into dimers as a function of the concentration of subunits in all states. Nonlinear regression (line) was used to estimate the dissociation constant (Kd, with standard error). h) SEC of Ancα/β at high concentrations (purple and gray lines). SEC traces of human Hb, myoglobin (Mb) are shown for comparison. i) nMS of Human Hb at 50 μM. j) SEC of AncMH (cyan) at a high concentration. SEC of human Hb and myoglobin (black) are shown for reference. Dashed line, Ancα/β dimer elution peak volume (see f). k) Alternative estimation of affinity of dimer-tetramer association by nMS. For human Hb (blue) and Ancα/β14+Ancα (orange), the fraction of heterodimers incorporated into heterotetramers includes both heme-deficient and holo-heterodimers. For Ancα+Ancβ (red), cesium iodide adduct were included. Compare to Figs. 1d and 3d. Kds (with SE) were estimated by nonlinear regression (lines). All concentrations are expressed in terms of monomer. All nMS and SEC experiments were performed once at each concentration.
Extended Figure 3.
Extended Figure 3.. Biochemical inferences about ancestral Hbs are robust to uncertainty in sequence reconstructions.
a-e) Maximum parsimony inferences of ancestral stoichiometry and interface loss/gains based on the distribution of stoichiometries among extant globins. a, Hbs in all extant lineages of jawed vertebrates are heterotetramers, supporting the inference that AncHb was heterotetrameric. Stoichiometries from representative species’ Hbs are shown with PDB IDs. b-e, Each panel shows a hypothetical set of ancestral stoichiometries, plotted on the phylogeny of extant Hb subunits and closely related globins, with the minimal number of changes required by each scenario. b) The most parsimonious reconstruction is that Ancα/β was a homodimer and AncMH was a monomer. c) For Ancα/β to have been a tetramer, early gain and subsequent loss of IF2 in Hbα would be required. d) For Ancα/β to have been a monomer, IF1 would have been independently gained in Hbα and Hbβ. e) For AncMH to have been a dimer, IF1 would have been lost in lineages leading to the monomers myoglobin (Mb) and globin E (GbE) ,. The dimeric globins most closely related to Hb -- agnathan “hemoglobin” (aHb) and cyotoglobin (Cyg) -- use interfaces that are structurally distinct from those in Hb,, indicating independent acquisition. f-j) Alternative reconstructions of Ancα/β are biochemically similar to ML reconstruction. f) Alternative ancestral versions of Ancα/β were constructed, each containing the the ML state at every unambiguously reconstructed site and the second most likely state at all ambiguously reconstructed sites, using different thresholds of ambiguity. For each alternative reconstruction, the table shows the threshold posterior probability (PP) used to define an ambiguous site, as well as the fold-difference in total PP of the entire sequence and the number of sites different from the ML reconstruction. g) SEC of ML α/β and alternative ancestors at 75 μM. Dotted lines show elution peak volumes for the dimeric ML α/β and monomeric human myoglobin. Constructs that elute between the expected volumes for dimer and monomer indicate dimers that partially dissociate during the run. None tetramerize; all form predominantly dimers, except AltAll(PP >0.2), which is ~62,000 times less probable than ML, which is mostly monomeric. UV traces were collected once for each construct. h) Oxygen binding curves of Ancα/β-AltAll(0.25), the dimeric AltAll with the lowest PP, with and without 2x IHP. Dissociation constant (P50, with SE) estimated by nonlinear regression is shown. Lack of cooperativity is indicated by the Hill coefficient (n50=~1.0). Oxygen binding at each concentration was measured once. i) Alternate globin phylogeny that is more parsimonious than the ML topology with respect to gene duplications and synteny but has lower likelihood given the sequence data. A version of Ancα/β (Ancα/β-AltPhy) was reconstructed on this phylogeny. j) SEC of Ancα/β-AltPhy. Dotted lines show expected elution volumes for various stoichiometric forms.
Extended Data Figure 4.
Stoichiometric analysis of Ancα, Ancβ, and AncMH. a) SEC of Ancα at 75 μM. b) nMS spectra (top, at 20 μM) and SEC-MALS (bottom) of Ancβ. c) Colorimetric hemoglobin concentration assay. Absorbance spectra before (black) and after (red) adding 150 uL Triton/NaOH reagent to 50 uL of purified Ancα/β. In the presence of reagent, globins absorb at 400 nm. d) SEC of crude cell lysate after expression of AncMH (purple) and Ancα/β (black). Dashed lines, expected elution volumes for monomer (human myoglobin) and dimer (Ancα/β). e) Colorimetric hemoglobin concentration assay on collected SEC fractions of crude lysate (panel e) containing AncMH (purple) and Ancα/β (black). f) nMS of His-tagged AncMH at 70 μM, with monomer charge series indicated. *, cleavage product. Green, apo. Fractional occupancy of the monomeric form is shown. All experiments were performed once.
Extended Figure 5.
Extended Figure 5.. HDX-MS of Ancα/β.
a-c) Deuterium uptake measurements across time for three peptides, left vertical axis, raw deuterium incorporation; right vertical axis, deuterium incorporation divided by the total number of exchangeable amide hydrogens per peptide. Uptake curves for four concentrations by mutants IF1rev and P127R are shown. Each point shows mean with SE of 3 replicate measurements. d-f) Raw MS spectra for the peptides shown in a-c at 0.67 μM (red, at which the protein is monomeric), and 75 μM (purple, at which it is entirely dimeric: see Extended Figure 2). The traces are slightly offset to allow visualization. One replicate at each incubation time is shown. g) Amino acids 99 to 111 contact IF1 (orange) or IF2 (yellow). The homology model of one chain of Ancα/β (cartoon and sticks), was aligned to the α subunit of human Hb (PDB 1A3N); β subunits in are shown as surfaces. h) Normalized deuterium uptake difference (mean and SE from 3 replicates), defined as the uptake difference between monomer and dimer, divided by the uptake of the monomer, observed for peptides containing amino acids 99–111. Gray N-terminal residues do not contribute to uptake. Amino acid sequences are aligned and labeled (orange dots, IF1; yellow, IF2).
Extended Figure 6.
Extended Figure 6.. Statistical analysis of HDX-MS results by peptides containing interface residues.
a) Residues in human Hb (PDB 1A3N) that bury at least 50% of their surface area in either IF1 (orange) or IF2 (yellow) are shown as spheres. Alpha subunits, red and pink; beta, blue. b) Homology models of Ancα/β dimer across IF1 (left) or IF2 (right). Two subunits of Ancα/β were computationally docked using HADDOCK using the α1/β1 inerface (IF1, left) or α1/β2 subunits (IF2, right) of human Hb (1A3N) as a template. c) Coverage of peptides produced by trypsinization of Ancα/β, assessed by MS. Sites that bury surface area at IF1 and IF2 in the modeled dimeric structures are orange or yellow, respectively. d) Classification of trypsin-produced peptides that contribute to IF1 or IF2. Each circle represents one peptide, plotted by average surface area per residue buried at each interface (total buried area divided by total number of residues). Dashed line, cutoffs to classify peptides as contributing to IF1 (orange zone) or IF2 (yellow). e,f) Correlation between change in deuterium uptake and burial of surface area at IF1 or IF2. Each point is one of 47 peptides, plotted according to the normalized difference in deuterium uptake between concentrations at which monomer or dimer predominate (0.67 or 75 μM, normalized by uptake at 75 μM) and average buried surface area at IF1 or IF2. r, Pearson correlation coefficient. g) Permutation test to evaluate the difference in deuterium uptake at two time points by peptides containing IF1 vs. all other peptides (orange), or IF2 vs. all other peptides (yellow). To avoid non-independence, the experimental data were reduced to a set of nonoverlapping peptides by sampling without replacement. Peptides were categorized by whether they contained residues at IF1, IF2, or neither; peptides contributing to both IFs were excluded. For each interface, the mean uptake by peptides contributing to the interface was calculated, as was the mean uptake by peptides not in that category, and the difference in means was recorded. Peptide assignment to categories was then randomized, and the difference in mean uptake recorded; this permutation process was repeated until all possible randomized assignment schemes for those peptides had been sampled once. P-value, fraction of permuted assignment schemes with a difference in mean uptake between categories greater than or equal to that from the true scheme. This process was repeated for 1000 nonoverlapping peptide sets; the histogram shows the frequency of P-values across these sets. Dotted line, P=0.05.
Extended Figure 7:
Extended Figure 7:. Dissection of IF1 and IF2 by HDX-MS and mutagenesis.
a,b) Peptides with residues contributing to IF1 (a) or IF2 (b) that have the largest relative uptake difference upon dimerization are shown as purple tubes. Sticks, side chains predicted to contact the other subunit (orange surface, IF1; yellow IF2). Side chains are colored orange or yellow (IF1 or IF2) if they were substituted between AncMH and Ancα/β; purple, unchanged in that interval; green, site for targeted mutation P127; blue, Q40. Circled numbers show the rank of each peptide among all peptides for the normalized difference in deuterium uptake between monomer and dimer conditions. Homology models of the Ancα/β dimer using half-tetramers of human Hb (1A3N) are shown. In panel a, the dimer is modeled using the α1/β1 subunits; in b, it is modeled on the α1/β2 subunits. c,d) nMS of interface mutants Q40R (at IF2) and P127R (at IF1) and for mutants IF1 and IF2, in which interface residues in Ancα/β were reverted to their states in AncMH. All assays at 20 μM. Stoichiometries and charge states are labelled. Unhemed peak series due to heme ejection during nMS is labeled. Spectra were collected once.
Extended Figure 8.
Extended Figure 8.. Alternative methods to normalize deuterium uptake.
a) Deuterium uptake difference between monomer (0.67μM) and dimer (75μM) at each time point was normalized by the length of each peptide. Peptides were categorized by the interface to which they contribute, as in Fig. 2c. *, interface peptide sets that have significantly increased uptake upon dilution when compared to peptides outside of that interface, as determined by a permutation test (see Extended Fig. 6). Each point shows the mean and SE from 3 replicates. b) Permutation test to evaluate the difference in deuterium uptake at 60 minutes by peptides at each interface, when uptake difference per peptide is normalized by length (using the methods described in Extended Fig. 6g). Orange, peptides with IF1-containing residues vs. those with no IF1 residues. Yellow, IF2-containing peptides vs. those with no IF2 residues. Dotted line, P=0.05. c, d) Average deuterium uptake difference per residue (c) and uptake difference normalized by dimer uptake (d) for peptides at different time points. IF1 sites (Orange), IF2 sites (Yellow). Each rectangle shows the position of the peptide in the linear sequence and its uptake (mean of 3 replicates).
Extended Figure 9.
Extended Figure 9.. Effect of interface-disrupting mutations on Ancα/β.
a,b) SEC of mutants at IF2 (Q40R and IF2rev, which reverts all substitutions that occurred between AncMH and Ancα/β at IF2 sites) and at IF1 (P127R and IF1rev), at 100 μM. Dashed line, elution peak volume for Ancα/β. c) Circular dichroism spectra for P127R and Ancα/β, showing comparable helical structure. d) SEC from IF1 mutant V119A at 64 μM. e) nMS of Ancα/β, P127R and IF1rev at 10 μM. Stoichiometries and charges are shown. For a-d, nMS and SEC experiments were performed once per concentration. f) Normalized deuterium uptake by IF1-containing peptide 106–111 in HDX-MS of Ancα/β (75 μM) and mutants P127R(2 μM) and IF1rev (2 μM). Points and error bars, mean and SE of 3 replicates. g,h). Difference between deuterium uptake by each peptide in Ancα/β and uptake by the same peptide IF1 mutants P127R (g) and IF1 rev (h), both at 2 μM, normalized by uptake in Ancα/β. Peptides are classified by interface category. Circles and error bars, mean and SE of 3 replicates. *, peptide sets that have significantly increased relative uptake (by permutation test, see Extended Fig. 6) compared to all other peptides (peptides containing both IF1 and IF2 residues excluded).
Extended Figure 10.
Extended Figure 10.. Genetic mechanisms of tetramer evolution.
a,c) SEC of Ancα/β containing sets of historical substitutions, when coexpressed and purified with Ancα. Vertical lines, elution volumes of known stoichiometries (4mer, Ancα +Ancβ; 2mer, Ancα/β; monomer, human myoglobin). Pie graphs, relative proportions of α (pink) and α/β mutant (purple) subunits in fractions corresponding to each peak, as determined by high resolution MS (Extended Figure 11). b) nMS of tetrameric fraction in a. at 20 μM (monomer concentration). Together, a and b show that tetramers formed by coexpression of Ancα/β4+ Ancα incorporate virtually no alpha subunit. Occupancy from this experiment is shown in Fig. 3b. d, f) nMS of unfractionated purified protein complexes of Ancα/β5+α and Ancα/β14+α at 20 μM. Charge series, stoichiometries indicated. *, apparent impurity. e) Homology model of Ancα/β14+α using Human Hb (1a3n) as template. Yellow and cyan sticks, Ancβ-lineage substitutions on IF2, orange sticks, Ancβ substitutions on IF1. Yellow surface, α IF2; Orange surface, α IF1. Green, 5 β substitutions close to the interfaces included in Ancα/β14+α. Red arrows, peaks isolated for further characterization by tandem MS (Ext. Fig. 11). g) nMS of Ancα/β2 across concentrations. Charge series and stoichiometries indicated. h) Similarity between interfaces in Ancα/β14+Ancα homology model and X-ray crystal structure of Human Hb. Venn diagrams show sites buried at IF1 and IF2 in one or both structures. Small circle, number of shared interface sites with identical amino acid state. i) Hydrogen-bond contacts at interfaces in Ancα/β14+α homology model are also found in X-ray crystal structures of extant hemoglobins. Residue pairs hydrogen-bonded in Ancα/β14+α IF2 (yellow) and IF1 (orange) are listed; +, also present in crystal structure. *, interactions discussed in the text of this paper. PDB identifiers are shown. j. Oxygen equilibrium curves of Ancα/β14+α, Ancα/β4, Ancα/β2. All experiments were performed once per concentration. Lines, best-fit curve by nonlinear regression.
Extended Figure 11.
Extended Figure 11.. Stoichiometric characterization of Ancα/β containing historical substitutions.
a) SEC of Ancα/β5. Circles show stoichiometry associated with each peak’s elution volume. b) High-resolution accuracy mass spectrometry (HRA-MS) of Ancα/β5 + α. Purple circles label peaks associated with Ancα/β5; pink, Ancα. *, 922 m/z reference standard. c) HRA-MS of tetramer-containing SEC fraction of Ancα/β4+Ancα. c) HRA-MS of monomer-containing SEC fraction of Ancα/β4+Ancα. e) HRA-MS of Ancα/β9+Ancα. f) nMS of tetramer-containing SEC fraction of Ancα/β4+Ancα (see Fig. 3a,b). Black circle, most abundant peak used for tandem MS. g) Tandem MS of isolated most-abundant peak in f, showing trimer-containing peaks. Charge states and number of hemes (h) in the 8+ peak are indicated. h) monomer-containing peaks. I, j, k) nMS (i) and tandem MS (j, k) of Ancα/β14+Ancα (see Fig. 3f). l, m, n). nMS and tandem MS of Ancα/β5+Ancα (see Fig. 3c,d). Black dots in (n) mark charge species produced by cleavage of Ancα/β5. All experiments were performed once.
Figure 1.
Figure 1.. Structure and function of ancestral globins.
a) Simplified phylogeny of vertebrate globins. Icons, oligomeric states. *, approximate likelihood ratio statistic >10. Complete phylogeny in Extended Figure 1a. Circles, reconstructed ancestral proteins. b) nMS spectra of Ancα/β (upper, purple) and Ancα+Ancβ (lower, pink+blue) at 20 μM. Charge states, stoichiometries, and occupancy (fraction of moles of subunits) shown. Red, analyzed by MSMS in Extended Fig. 2e. c) Dimer-to-tetramer affinity of Ancα+Ancβ (red) and Human Hb (green). Circles, fraction of α+β heterodimers incorporated into α2β2 tetramers, measured once by nMS. Kd (dissociation constant, with SE, in moles of subunits in heterodimers or heterotetramers) estimated by nonlinear regression. d,e) Oxygen affinity (P50) and cooperativity (Hill coefficient, n) of Ancα/β and Ancα+Ancβ. +IHP, 2x molar excess inositol hexaphosphate. Mean and 95% c.i. from 3–5 replicates (dots) shown. *, significant cooperativity (n≠1, P<0.05, F-test; Extended Fig. 1f).
Figure 2.
Figure 2.. Identification of homodimerization interface in Ancα/β.
a) Hb heterotetramers assemble via two interfaces (IF1, orange; IF2, yellow) on each subunit. Red and pink surfaces, α subunits; blue cartoon, β subunits. Ancα+Ancβ homology model is shown. b) Deuterium incorporation by an Ancα/β peptide that contributes to IF1 (Extended Fig. 5g,h). Uptake (mean and SE from 3 replicates per incubation time) is shown for Ancα/β (black) and monomeric IF1 mutant P127R (green). c)Each circle, mean difference in deuterium uptake by one Ancα/β peptide when expressed at monomer-favoring vs. dimer-favoring concentrations (0.67 and 75 μM, 3 replicates each, with SE). Peptides are classified by the interface to which they contribute and colored by incubation time. *, mean uptake in interface category significantly different from other categories (P<0.05, permutation test, Extended Figs. 6g,7). d) Dimer and monomer occupancy by Ancα/β and mutants, assessed using nMS at 20 μM. P127R and Q40R disrupt IF1 and IF2, respectively. IF1rev and IF2rev revert historical substitutions to state in AncMH (spectra in Extended Fig. 7c–d). e) Evolution of Hb tetramer. Rectangles, acquisition of IF1 and IF2. C, cooperative; NC, noncooperative. Mb, myoglobin.
Figure 3.
Figure 3.. Genetic mechanisms of tetramer evolution.
a) Homology model of Ancα+Ancβ tetramer with interface residues substituted between Ancα/β and Ancβ. Gray surfaces, two Ancα subunits; yellow, IF2; orange, IF1. Blue cartoon, partial backbone of one Ancβ subunit; sticks, side chains of substituted sites (IF2 cyan, IF1, green). Labels show state in Ancα/β (lower case) and Ancβ (upper). *, sites in Ancα/β2; underlined, Ancα/β4. b) Phylogenetic interval between Ancα/β and Ancα+Ancβ with number of substitutions and deletions per branch. Venn diagrams, sites substituted at interfaces. Below, substitutions incorporated in mutant proteins. c) Occupancy of multimers, measured by nMS at 20 μM, as fraction of moles of subunits in each state. Ancα/β2 was expressed in isolation, so only homomers are plotted. Spectra in Extended Fig. 10. d) SEC of Ancα/β9+Ancα at 80 μM. Lines, elution volumes of tetramer (Ancα+Ancβ), dimer (Ancα/β), monomer (Human Mb). Pie, proportions of Ancα and Ancα/β9 subunits in tetramer-containing fraction, by denaturing MS (Extended Fig. 11e). Above, electrophoresis of tetramer-containing fraction. e) Dimer-to-tetramer affinity of Ancα/β2 (blue) and Ancα/β14+Ancα (orange). Orange circles, fraction of Ancα/β14+Ancα heterodimers incorporated into heterotetramers; blue, fraction of Ancα/β2 homodimers in homotetramers, measured by nMS once. Kd (with SE) estimated by nonlinear regression.
Figure 4.
Figure 4.. Structural mechanisms of Hb interface evolution.
a) Phylogenetic classification of ancestral states and substitutions. Black, state in AncMH; purple, substituted from AncMH to Ancα/β; blue or red, substituted from Ancα/β to Ancβ or Ancα. b,c) Contact maps for residues buried at IF1 (b) and IF2 (c) Ancα+Ancβ. Residues colored by scheme in a. Letters, state in AncMH (outside, lower case), Ancα/β (middle, lower case) and Ancβ or Ancα (inside, upper case). Solid lines, predicted hydrogen bonds; dotted, van der Waals interactions. Underlined, substitutions in Ancα/β4; *, in Ancα/β2. Cylinders, helices (See Extended Fig. 2a). Circle, deletion of helix. d) IF2 contacts in Ancα+Ancβ. Grey surface, Ancα, with yellow IF2; hydrogen-bonding atoms are red (oxygen) or blue (nitrogen), with bonds as green lines. Cartoon, Ancβ backbone, with IF2 interacting sidechains (sticks, colored as in a). e) Close-up of IF1 in Ancα+Ancβ model. Sticks, hydrogen-bonding residues; spheres, Cα atoms, colored by a.
Fig. 5.
Fig. 5.. Evolution of cooperativity by interface acquisition.
a) Heme pocket and IF2 in Ancα+Ancβ. Pink surface, one Ancα. Heme (tan sticks, with green iron and red oxygen). Spheres, Ancβ residues within 4 Å of heme, colored by temporal category: grey, conserved since AncMH (dark grey, iron-coordinating histidine); purple, conserved since Ancα/β; blue, substituted between Ancα/β and Ancβ. Sticks, other residues on helix connecting histidine to IF2, colored temporally. Yellow, Ancβ residues at IF2. No changes near heme or IF2 occurred in Ancα. b) Oxygen binding by Ancα/β mutants with historical substitutions. Columns and error bars, P50 ± SE, with Hill coefficient n above, estimated by nonlinear regression under effector-stripped conditions (raw data in Extended Figure 10j). *, significant cooperativity (n≠1, P=<0.05, F-test, Extended Fig. 1f). Dotted lines, affinities of Ancα+Ancβ and Ancα/β, which is unaffected by IHP. c) Evolution of the cooperative Hb heterotetramer. Circles and squares, conformations with high and low oxygen affinity, respectively. Two IF2 substitutions cause homotetramerization, cooperativity, and reduced affinity (see B). Other substitutions that confer heterotetramerization change the relative stabilities of high and low-affinity conformations, abolishing/restoring cooperativity. White box, interval in which order of substitutions is unknown. d) Acquisition of residues in structurally defined categories in Ancα and Ancβ, ordered as in d, colored by temporal category. No changed occurred in Ancα.

Comment in

References

    1. Ahnert SE, Marsh JA, Hernández H, Robinson CV & Teichmann SA Principles of assembly reveal a periodic table of protein complexes. Science (80-. ) 350, (2015). - PubMed
    1. Marsh JA & Teichmann SA Structure, Dynamics, Assembly, and Evolution of Protein Complexes. Annu. Rev. Biochem 84, 551–575 (2015). - PubMed
    1. Monod J, Wyman J, & Changeux JP On the nature of allosteric transitions: a plausible model. Jounal Mol. Biol 12, 88–118 (1965). - PubMed
    1. Goodsell DS & Olson AJ Structural symmetry and protein function. Annu. Rev. Biophys. Biomol. Struct 29, 105–153 (2000). - PubMed
    1. Rivalta I et al. Allosteric pathways in imidazole glycerol phosphate synthase. Proc. Natl. Acad. Sci 109, E1428–E1436 (2012). - PMC - PubMed

REFERENCES FOR METHODS AND EXTENDED DATA

    1. Katoh K, Rozewicki J & Yamada KD MAFFT online service: multiple sequence alignment, interactive sequence choice and visualization. Brief. Bioinform 1–7 (2017) 10.1093/bib/bbx108. - DOI - PMC - PubMed
    1. Guindon S et al. New algorithms and methods to estimate maximum-likelihood phylogenies: Assessing the performance of PhyML 3.0. Syst. Biol 59, 307–321 (2010). - PubMed
    1. Le SQ & Gascuel O An improved general amino acid replacement matrix. Mol. Biol. Evol 25, 1307–1320 (2008). - PubMed
    1. Anisimova M & Gascuel O Approximate likelihood-ratio test for branches: A fast, accurate, and powerful alternative. Syst. Biol 55, 539–552 (2006). - PubMed
    1. Anisimova M, Gil M, Dufayard JF, Dessimoz C & Gascuel O Survey of branch support methods demonstrates accuracy, power, and robustness of fast likelihood-based approximation schemes. Syst. Biol 60, 685–699 (2011). - PMC - PubMed

Publication types