. 2020 May;581(7809):459-464.
doi: 10.1038/s41586-020-2267-z. Epub 2020 May 27.

Evaluating drug targets through human loss-of-function genetic variation

Collaborators, Affiliations

Evaluating drug targets through human loss-of-function genetic variation

Eric Vallabh Minikel et al. Nature. 2020 May.

Erratum in

  • Author Correction: Evaluating drug targets through human loss-of-function genetic variation.
    Minikel EV, Karczewski KJ, Martin HC, Cummings BB, Whiffin N, Rhodes D, Alföldi J, Trembath RC, van Heel DA, Daly MJ; Genome Aggregation Database Production Team; Genome Aggregation Database Consortium; Schreiber SL, MacArthur DG. Minikel EV, et al. Nature. 2021 Feb;590(7846):E56. doi: 10.1038/s41586-020-03177-5. Nature. 2021. PMID: 33536628 Free PMC article. No abstract available.

Abstract

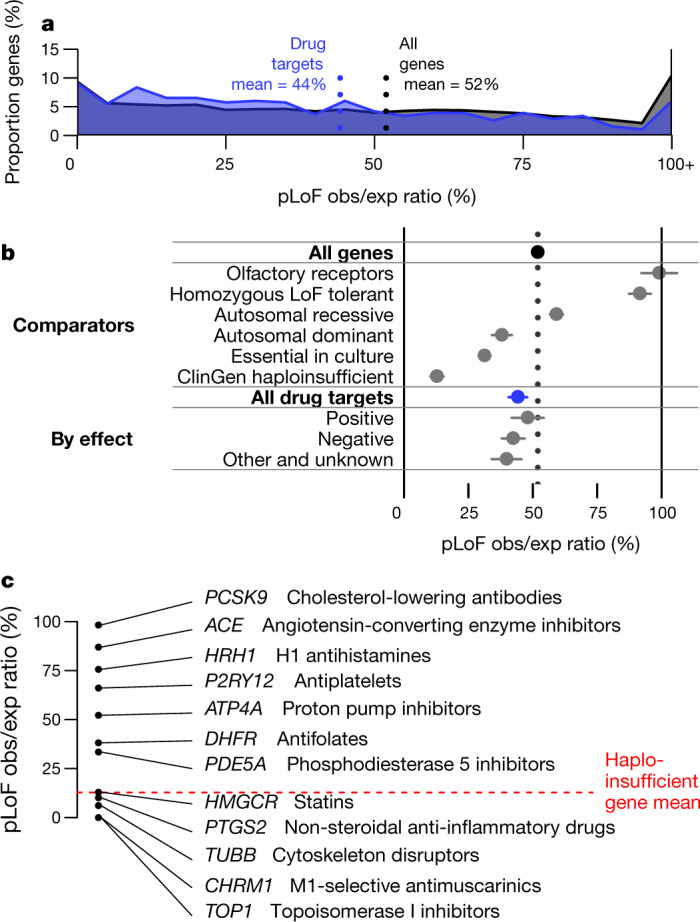
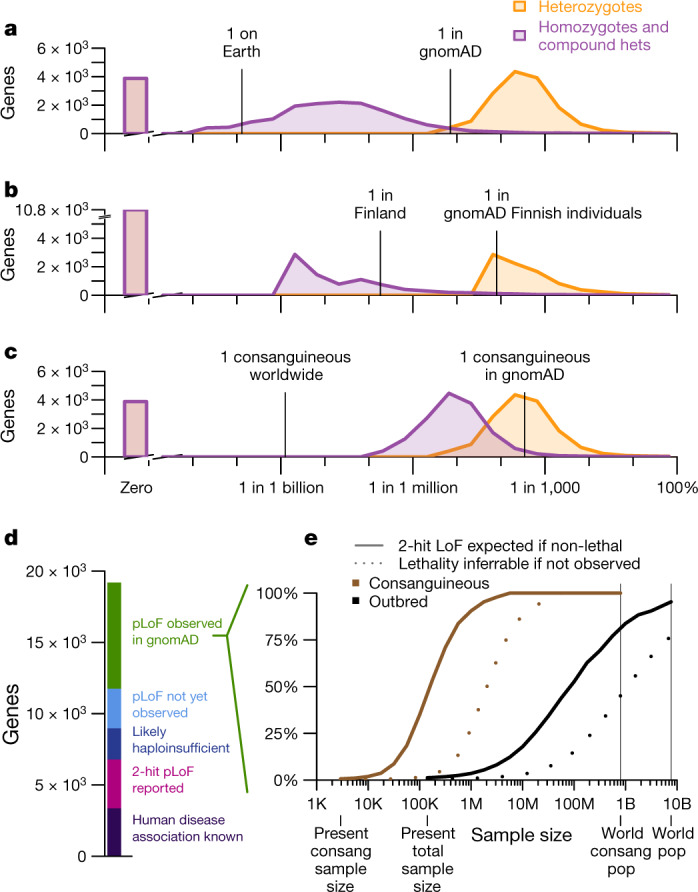
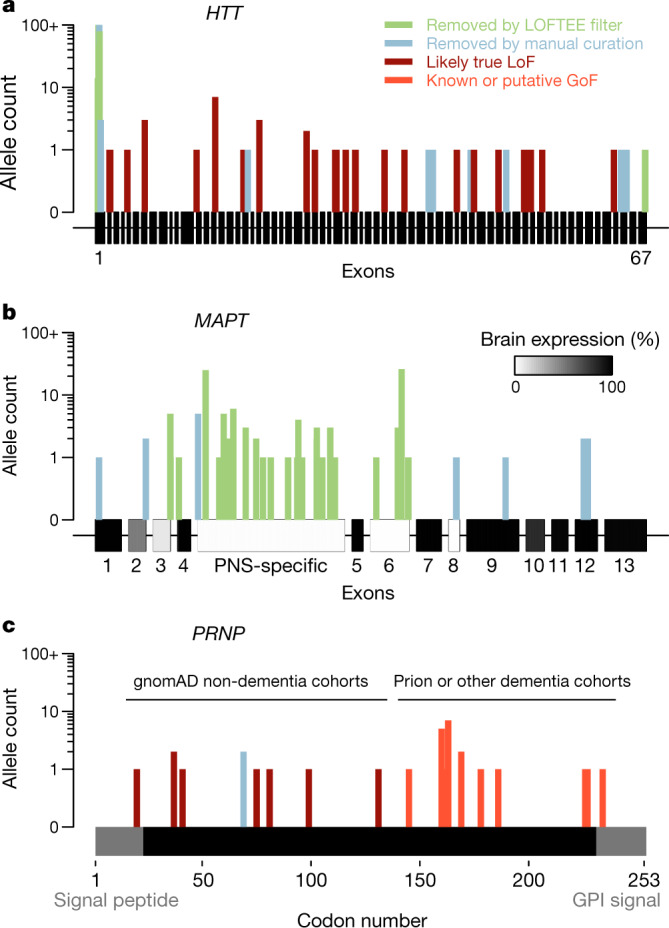
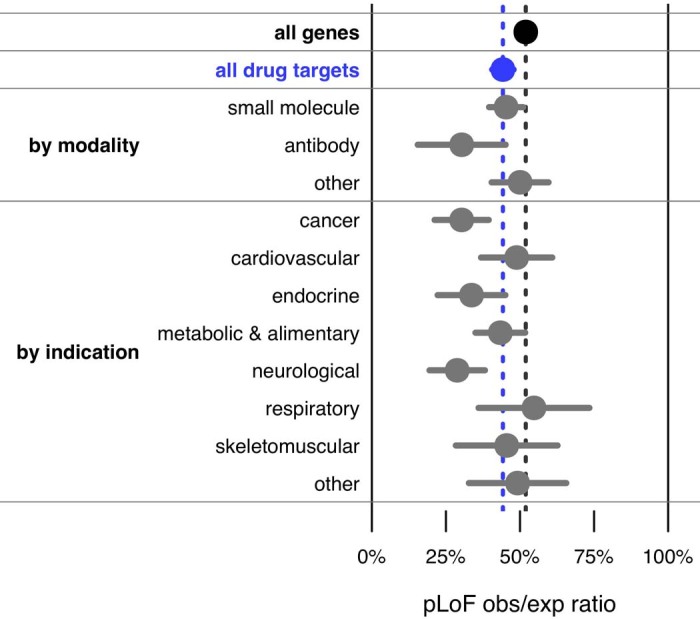
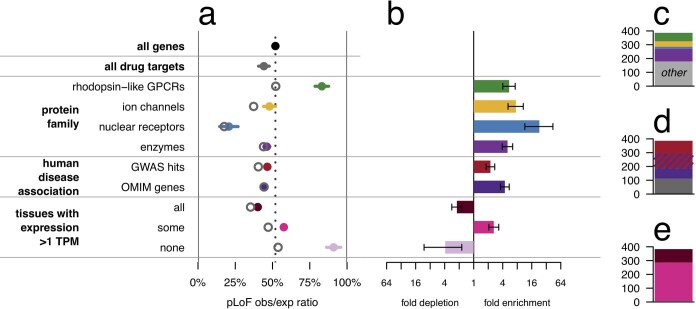
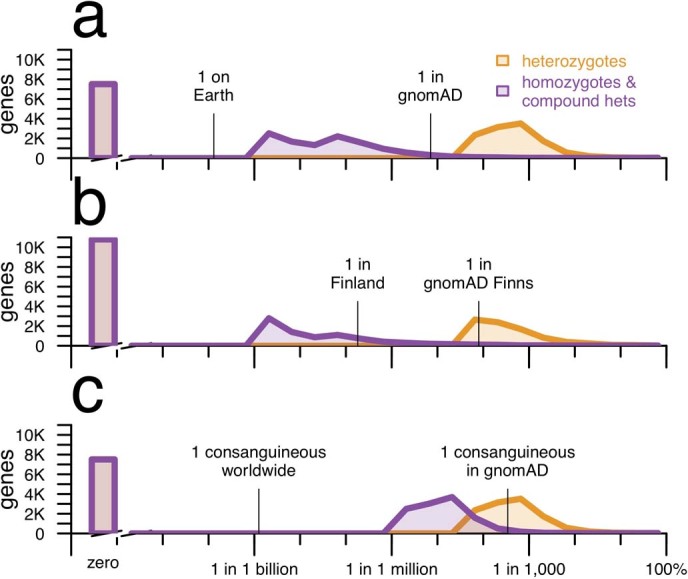
Naturally occurring human genetic variants that are predicted to inactivate protein-coding genes provide an in vivo model of human gene inactivation that complements knockout studies in cells and model organisms. Here we report three key findings regarding the assessment of candidate drug targets using human loss-of-function variants. First, even essential genes, in which loss-of-function variants are not tolerated, can be highly successful as targets of inhibitory drugs. Second, in most genes, loss-of-function variants are sufficiently rare that genotype-based ascertainment of homozygous or compound heterozygous 'knockout' humans will await sample sizes that are approximately 1,000 times those presently available, unless recruitment focuses on consanguineous individuals. Third, automated variant annotation and filtering are powerful, but manual curation remains crucial for removing artefacts, and is a prerequisite for recall-by-genotype efforts. Our results provide a roadmap for human knockout studies and should guide the interpretation of loss-of-function variants in drug development.


Conflict of interest statement

E.V.M. has received research support in the form of charitable contributions from Charles River Laboratories and Ionis Pharmaceuticals, and has consulted for Deerfield Management. K.J.K. is a shareholder of Personalis. H.C.M., B.B.C., M.W., D.R. and J.A. have no competing interests to declare. R.C.T. serves on the Scientific Advisory Board of Ipsen Ltd and has current funding from the Wellcome Trust and the National Institute for Health Research UK. D.A.v.H. is a shareholder of Nexpep Pty Ltd; has current or recent research funding from Wellcome Trust, Medical Research Council UK, National Institute for Health Research UK, Alnylam Pharmaceuticals; and serves on the Population & Systems Medicine Board of the Medical Research Council UK. MJD is a founder of Maze Therapeutics. S.L.S. serves on the Board of Directors of the Genomics Institute of the Novartis Research Foundation (‘GNF’); is a shareholder and serves on the Board of Directors of Jnana Therapeutics; is a shareholder of Forma Therapeutics; is a shareholder and advises Decibel Therapeutics and Eikonizo Therapeutics; serves on the Scientific Advisory Boards of Eisai Co., Ltd., Ono Pharma Foundation, Exo Therapeutics, and F-Prime Capital Partners; and is a Novartis Faculty Scholar. D.G.M. is a founder with equity in Goldfinch Bio, and has received research support from AbbVie, Astellas, Biogen, BioMarin, Eisai, Merck, Pfizer, and Sanofi-Genzyme.

Figures

Fig. 1
Fig. 1. pLoF constraint in drug targets.
a, Histogram of pLoF obs/exp values for all genes (black, n = 17,604) versus drug targets (blue, n = 383). b, Forest plot of means (dots) and 95% confidence intervals of the mean (line segments), for constraint in the indicated gene sets (data sources and n values in Extended Data Table 1). For drug effect, ‘positive’ indicates agonist, activator or inducer, whereas negative indicates antagonist, inhibitor or suppressor, for example. c, Examples of drug targets and corresponding drug classes from across the constraint spectrum. Details in Extended Data Table 2.
Fig. 2
Fig. 2. Prospects for discovery of human knockouts.
ac, Histograms (ac): genes by expected heterozygote frequency (orange), and two-hit homozygote and compound heterozygote frequency (purple). a, Outbred populations. b, Finnish individuals; an example of a bottlenecked population. c, Consanguineous individuals. d, Current status of pLoF or disease association discovery for all protein-coding genes. e, Projected sample sizes required for discovery of two-hit individuals (solid lines) and for statistical inference that a two-hit genotype is lethal if no such individuals are observed (dashed lines), for ‘pLoF observed in gnomAD’ genes (d) for consanguineous and outbred individuals.
Fig. 3
Fig. 3. Insights from non-random positional distributions of pLoF variants.
ac, HTT (a), MAPT, with brain expression data from GTEx (b) and PRNP, a single protein-coding exon with domains removed by post-translational modification in grey (c), showing previously reported variants and those newly identified in gnomAD and in the literature (Extended Data Table 5). GPI, glycosylphosphatidylinositol. Detailed variant curation results are provided in Supplementary Table 1.
Extended Data Fig. 1
Extended Data Fig. 1. Drug target constraint by modality and indication.
Mean (dots) and 95% confidence interval (line segments) for constraint in subsets of drug-targets sets (data sources and number of genes for each list are provided in Extended Data Table 1). Modality information was extracted from DrugBank and indication information from ATC codes; see Extended Data Table 1 for details.
Extended Data Fig. 2
Extended Data Fig. 2. Drug-target gene set confounding.
a, Forest plot of means (dots) and 95% confidence intervals of the mean (line segments) for gene sets evaluated for confounding with drug-target status. Data sources and number of genes for each list are provided in Extended Data Table 1. LoF obs/exp ratios differ significantly from the set of all genes for four canonically druggable protein families (top), human disease-associated genes (middle), and genes by broadness of tissue expression (bottom). Within each class, the genes that are drug targets have a lower mean obs/exp ratio (hollow grey circles) than the class overall. b, The druggable protein families, disease-associated genes, and genes expressed in some tissues but not others are enriched several-fold among the set of drug targets. Bars indicate fold enrichment and error bars indicate 95% confidence intervals. ce, Composition of drug targets when broken down by protein family (c), disease association (d), or broadness of tissue expression (e). The enriched classes account for most drug targets. In a linear model, after controlling for protein family, disease association status, and number of tissues with expression >1 transcript per million (TPM), drug targets are still more constrained than other genes (−8.0% obs/exp, nominal P = 0.00011, t = −3.9, df = 17,325 for the contribution of drug_target in the linear regression obs/exp ~ drug_target + family + dz_assoc + n_tissues), but the probable existence of additional unobserved confounders cautions against over-interpretation of this observation (see main text).
Extended Data Fig. 3
Extended Data Fig. 3. Expected frequency of individuals with one or two null alleles for every protein-coding gene across different population models, with sample size held constant.
This is identical to Fig. 2 except as follows. As noted in the Methods, one caveat about Fig. 2 is that the sample size is larger for the plots using all gnomAD exomes (Fig. 2a, c) than for Finnish exomes (Fig. 2b). This figure shows the same analysis, but with the global gnomAD population downsampled to 10,824 randomly chosen exomes so that the same size is identical to that of Finnish exomes. Computation of P = 1 − sqrt(q) as described in the Methods is computationally expensive for downsampled datasets because it requires individual-level genotypes. Instead, this analysis uses ‘classic’ CAF, which is simply the sum of allele frequencies of all high-confidence pLoF variants each at allele frequency <5%, capped at a total of 100%, for both global and Finnish exomes. The results show that even when the sample size is held constant, the number of genes with zero pLoF variants observed is higher in a bottlenecked population than in a mostly outbred population. A constant y axis with no axis breaks is used in this figure to make this difference more clearly visible.

Comment in

References

    1. Plenge, R. M., Scolnick, E. M. & Altshuler, D. Validating therapeutic targets through human genetics. Nat. Rev. Drug Discov. 12, 581–594 (2013). - PubMed
    1. Hay, M., Thomas, D. W., Craighead, J. L., Economides, C. & Rosenthal, J. Clinical development success rates for investigational drugs. Nat. Biotechnol. 32, 40–51 (2014). - PubMed
    1. Nelson, M. R. et al. The support of human genetic evidence for approved drug indications. Nat. Genet. 47, 856–860 (2015). - PubMed
    1. King, E. A., Davis, J. W. & Degner, J. F. Are drug targets with genetic support twice as likely to be approved? Revised estimates of the impact of genetic support for drug mechanisms on the probability of drug approval. PLoS Genet. 15, e1008489 (2019). - PMC - PubMed
    1. Musunuru, K. & Kathiresan, S. Genetics of common, complex coronary artery disease. Cell177, 132–145 (2019). - PubMed

Publication types

MeSH terms