. 2020 Sep;585(7825):464-469.
doi: 10.1038/s41586-020-2317-6. Epub 2020 May 27.

Structures of α-synuclein filaments from multiple system atrophy

Affiliations

Structures of α-synuclein filaments from multiple system atrophy

Manuel Schweighauser et al. Nature. 2020 Sep.

Abstract

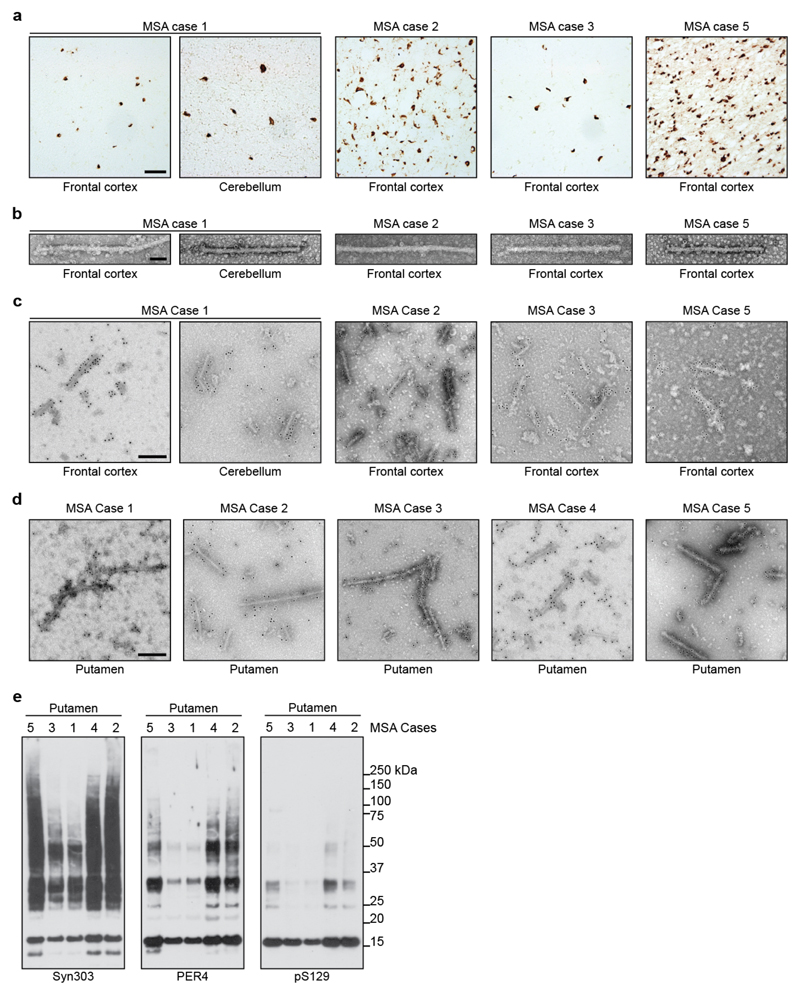
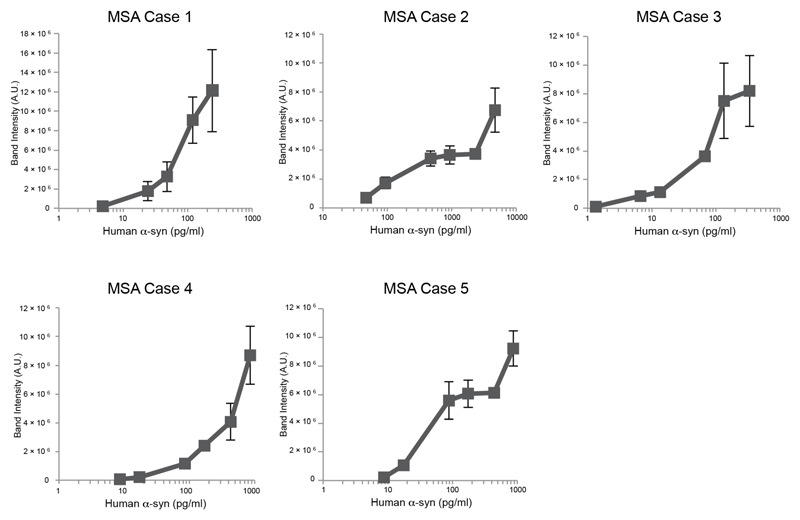
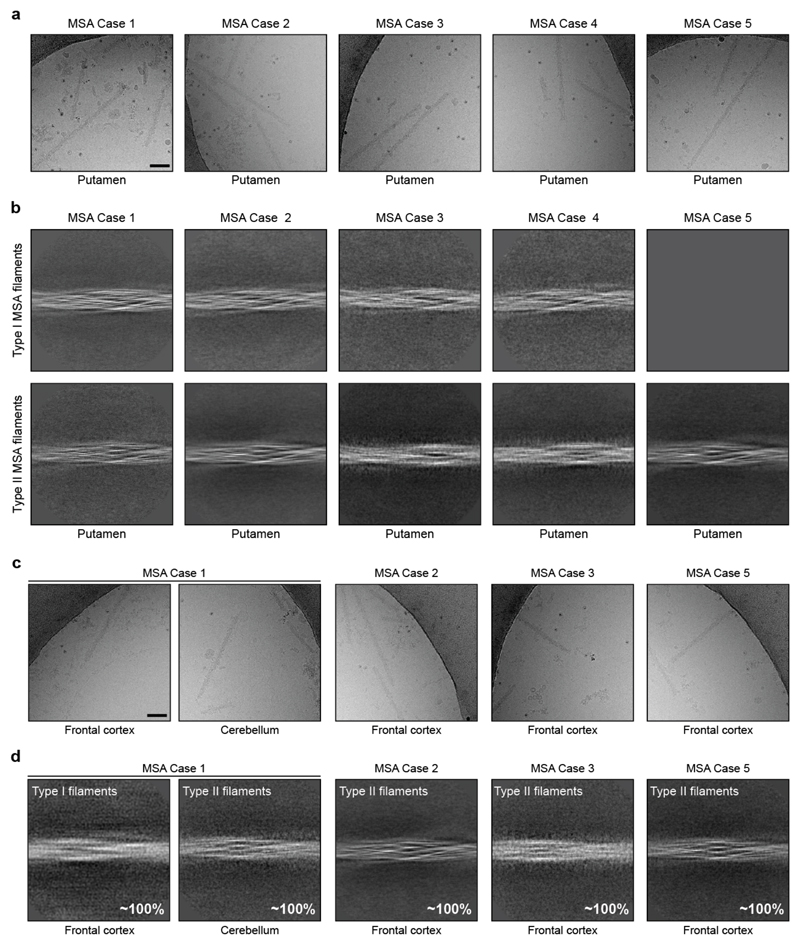
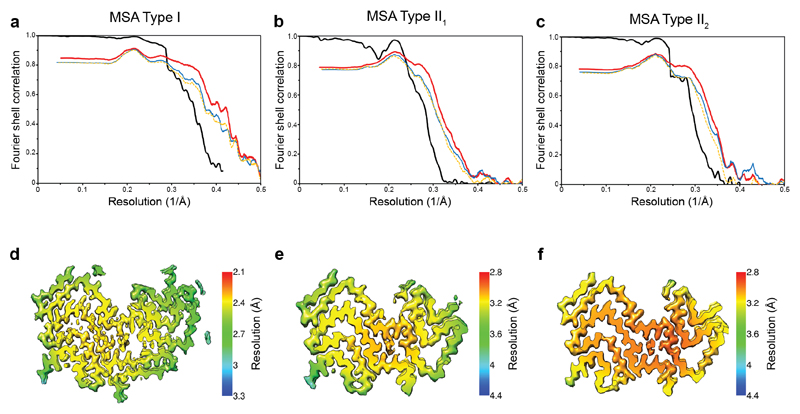
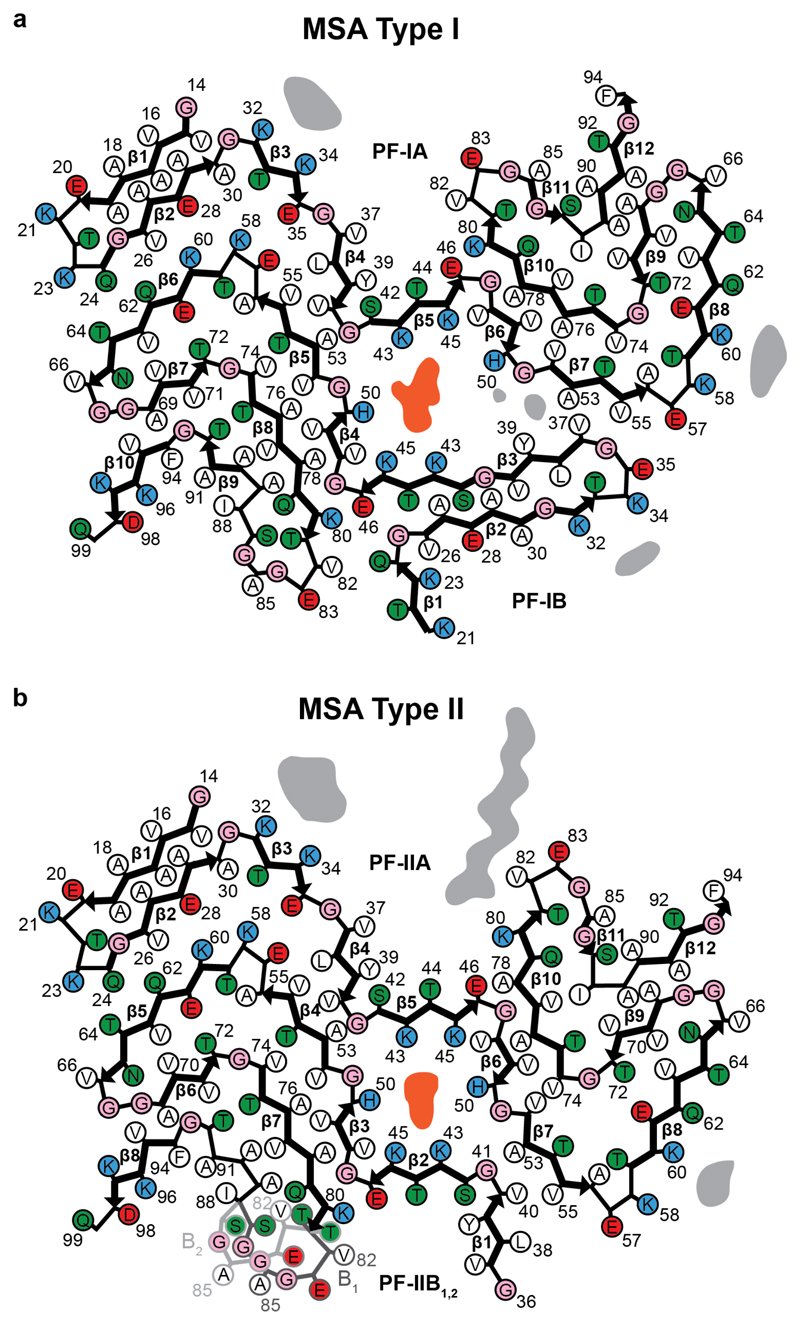
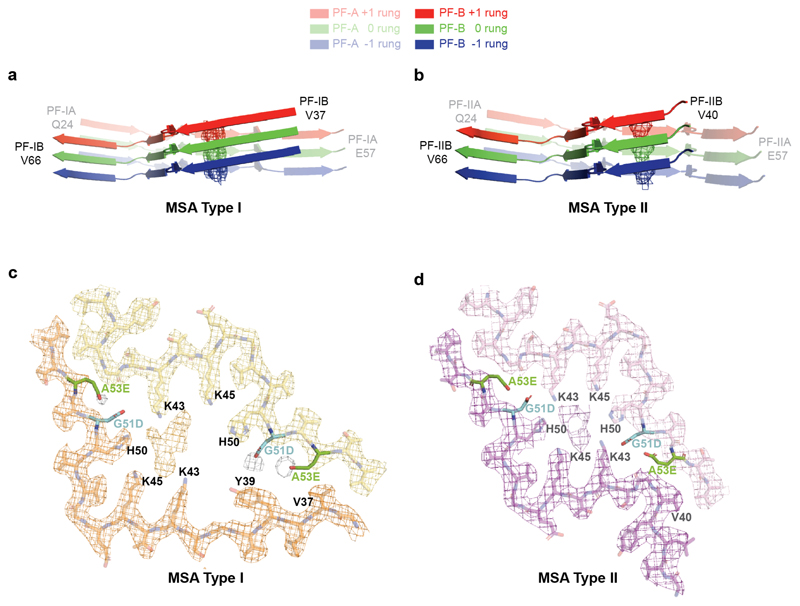
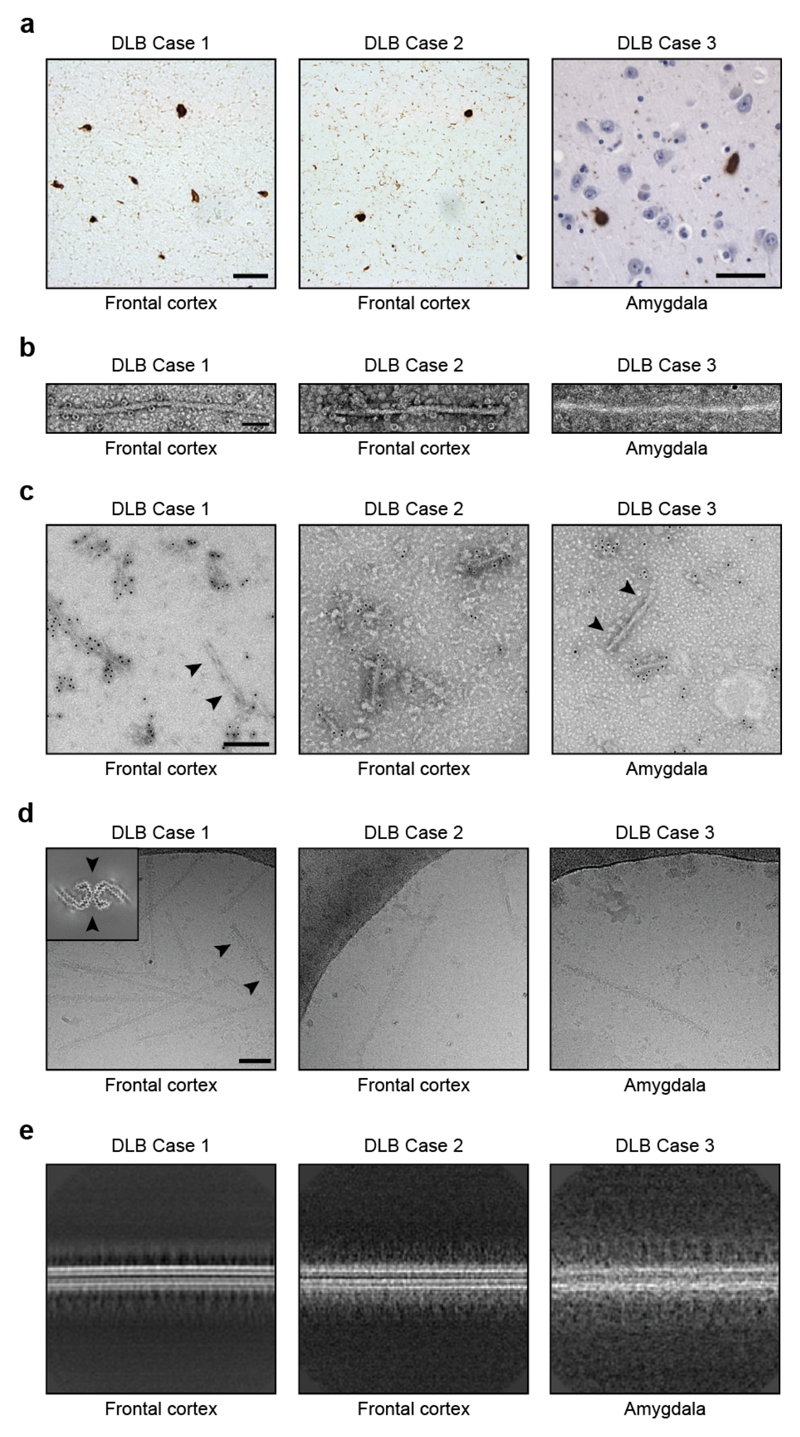
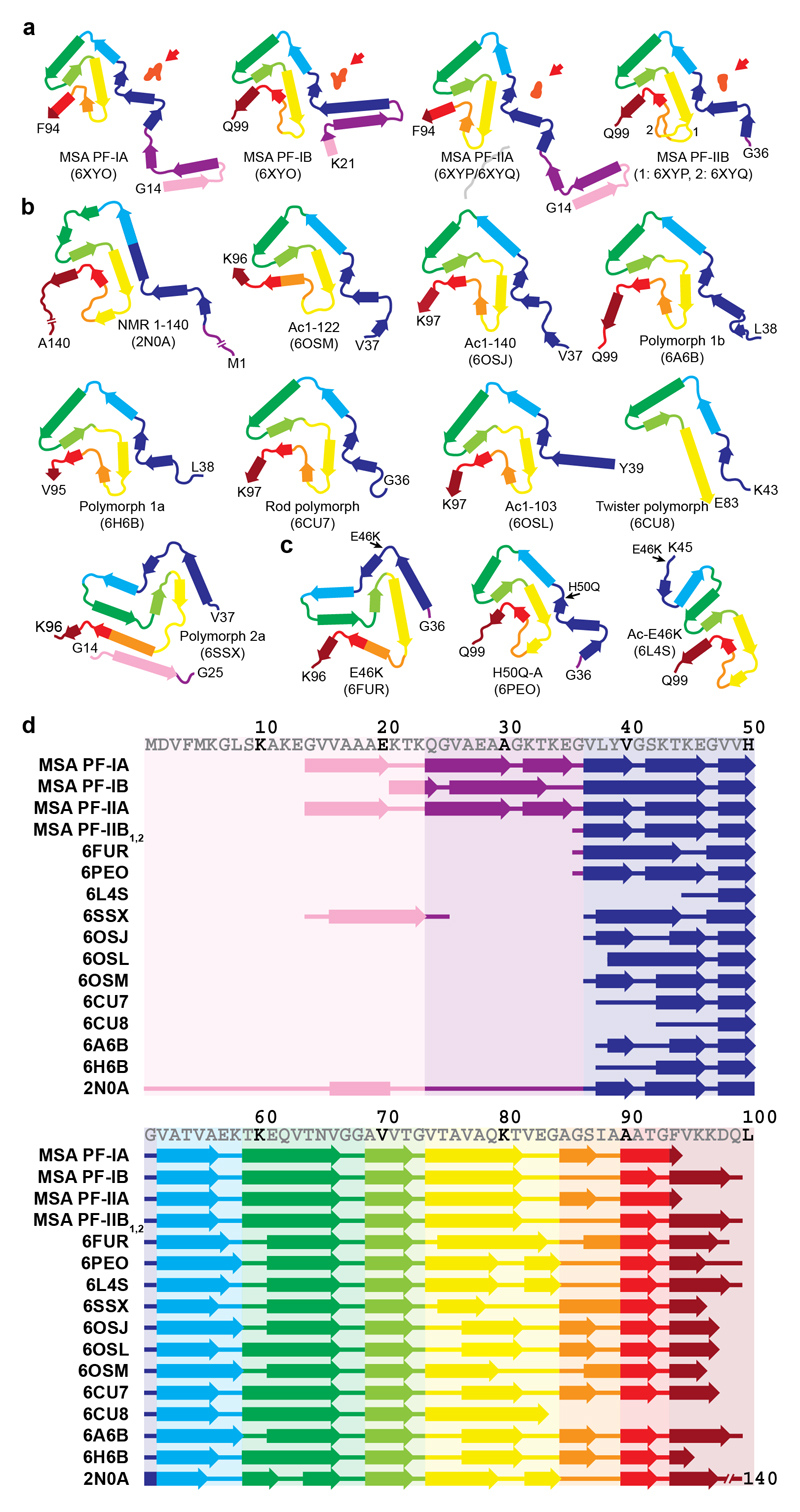
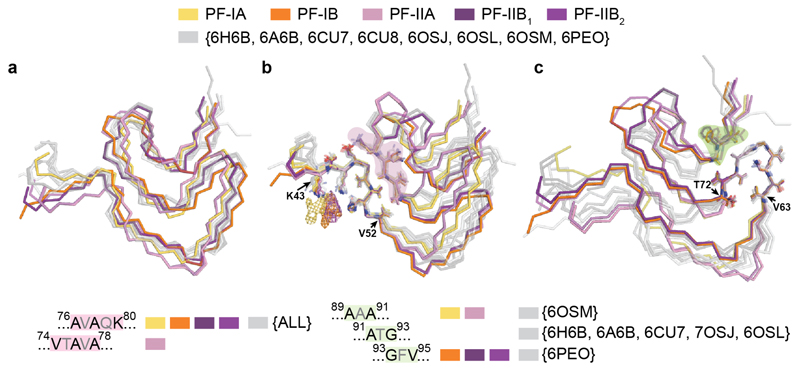
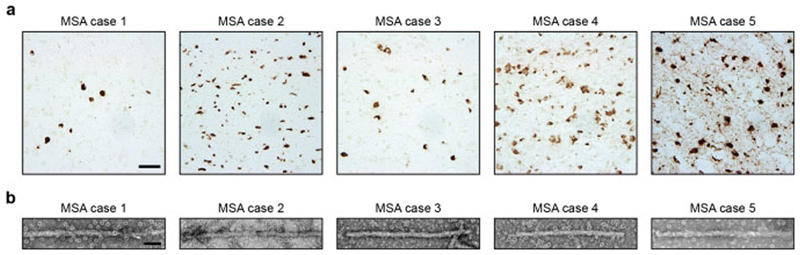
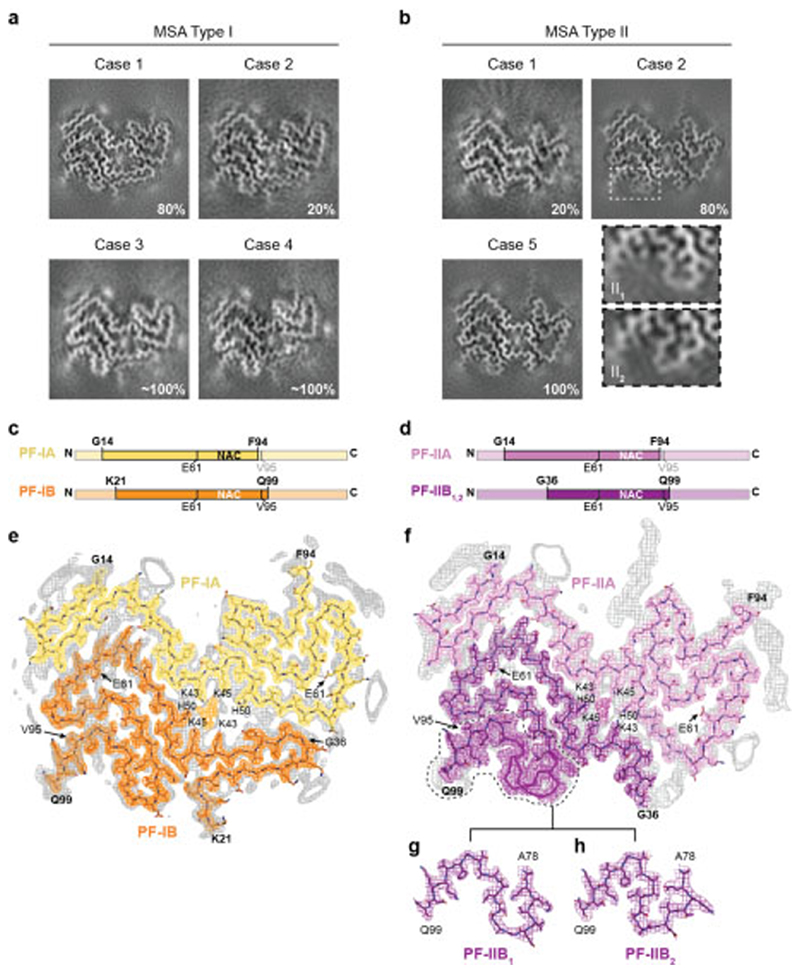
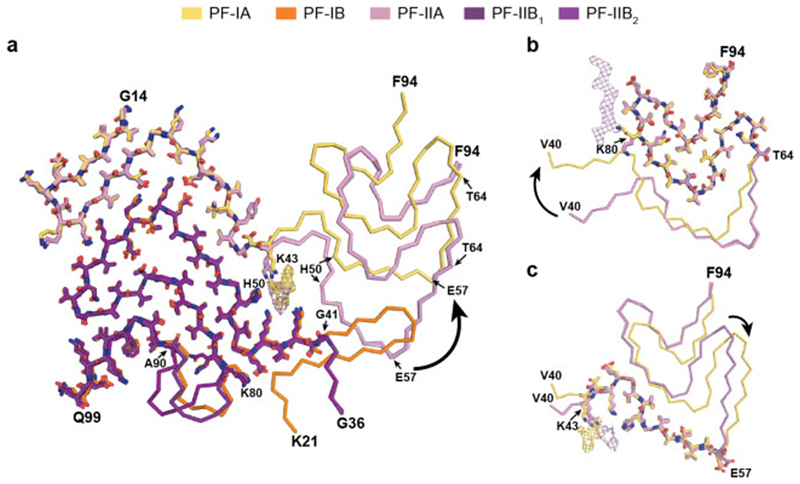
Synucleinopathies, which include multiple system atrophy (MSA), Parkinson's disease, Parkinson's disease with dementia and dementia with Lewy bodies (DLB), are human neurodegenerative diseases1. Existing treatments are at best symptomatic. These diseases are characterized by the presence of, and believed to be caused by the formation of, filamentous inclusions of α-synuclein in brain cells2,3. However, the structures of α-synuclein filaments from the human brain are unknown. Here, using cryo-electron microscopy, we show that α-synuclein inclusions from the brains of individuals with MSA are made of two types of filament, each of which consists of two different protofilaments. In each type of filament, non-proteinaceous molecules are present at the interface of the two protofilaments. Using two-dimensional class averaging, we show that α-synuclein filaments from the brains of individuals with MSA differ from those of individuals with DLB, which suggests that distinct conformers or strains characterize specific synucleinopathies. As is the case with tau assemblies4-9, the structures of α-synuclein filaments extracted from the brains of individuals with MSA differ from those formed in vitro using recombinant proteins, which has implications for understanding the mechanisms of aggregate propagation and neurodegeneration in the human brain. These findings have diagnostic and potential therapeutic relevance, especially because of the unmet clinical need to be able to image filamentous α-synuclein inclusions in the human brain.


Figures

Extended Data Figure 1
Extended Data Figure 1. Filamentous α-synuclein pathology and immunolabelling of α-synuclein filaments in MSA.
(a) Staining of inclusions in frontal cortex of MSA cases 1, 2, 3, 5 and cerebellum of case 1 by an antibody specific for α-synuclein phosphorylated at S129 (brown). Scale bar, 50 μm. (b), Negative-stain EM images of filaments from frontal cortex of MSA cases 1, 2, 3, 5, and cerebellum of case 1. Scale bar, 50 nm. (c,d) Representative immunogold negative-stain EM images of α-synuclein filaments extracted from frontal cortex of MSA cases 1, 2, 3, 5, cerebellum of case 1 and putamen of cases 1-5. Filaments were labelled with antibody PER4, Scale bar, 200 nm. (e), Immunoblots of sarkosyl-insoluble material from putamen of MSA cases 1-5, using anti-α-synuclein antibodies Syn303 (N-terminus), PER4 (C-terminus) and pS129 (phosphorylation of S129).
Extended Data Figure 2
Extended Data Figure 2. Aggregation of α-synuclein in SH-SY5Y cells following addition of seeds from the putamen of MSA cases 1-5.
Quantitation of wild-type human α-synuclein phosphorylated at S129 in SH-SY5Y cells following addition of variable amounts of α-synuclein seeds from the putamen of MSA cases 1-5. The results are expressed as means ± S.E.M. (n=3).
Extended Data Figure 3
Extended Data Figure 3. Cryo-EM images and 2D classification of MSA filaments.
(a,c), Representative cryo-EM images of α-synuclein filaments from putamen of MSA cases 1-5, frontal cortex of cases 1, 2, 3, 5 and cerebellum of case 1. Scale bar, 100 nm. (b,d), Two-dimensional class averages spanning an entire crossover of Type I and Type II filaments extracted from putamen of MSA cases 1-5, frontal cortex of cases 1, 2, 3, 5 and cerebellum of case 1.
Extended Data Figure 4
Extended Data Figure 4. Resolution evaluation of cryo-EM maps and of refined models.
(a-c), For MSA Type I (a), Type II1 (b) and Type II2 (c) filaments: Fourier shell correlation (FSC) curves of two independently refined half-maps (black line); FSC curves of final cryo-EM reconstruction and refined atomic model (red); FSC curves of first half-map and the atomic model refined against this map (blue); FSC curves of second half-map and the atomic model refined against the first half-map (yellow dashes). (d-f), Local resolution estimates of the reconstructions of MSA Type I (d), Type II1 (e) and Type II2 (f) filaments.
Extended Data Figure 5
Extended Data Figure 5. MSA Type I and Type II α-synuclein filaments.
(a), Schematic of MSA Type I filament, showing asymmetric protofilaments IA and IB. The non-proteinaceous density at the protoflament interface is shown in light red. (b), Schematic of MSA Type II filament, showing asymmetric protofilaments IIA and IIB. The non-proteinaceous density at the protofilament interface is shown in light red.
Extended Data Figure 6
Extended Data Figure 6. The inter-protofilament interfaces of MSA Type I and Type II α-synuclein filaments.
Rendered view of secondary structure elements in MSA Type I (a) and Type II (b) protofilament folds perpendicular to the helical axis of inter-protofilament interfaces, depicted as three rungs. Because of variations in the height of both polypeptide chains along the helical axis, each α-synuclein molecule interacts with three different molecules in the opposing protofilament. If one considers the interaction between two opposing molecules to be on the same β-sheet rung in the central cavity, the N-terminal arm of PF-A interacts with the C-terminal body of the PF-B molecule, which is one rung higher, while the C-terminal body of PF-IA interacts with the N-terminal arm of the PF-IB molecule, which is one rung lower. (c,d), Compatibility of mutant α-synuclein (G51D and A53E) with MSA Type I and Type II filaments. Close-up views of atomic models of Type I (c) and Type II (d) α-synuclein folds containing D51 (cyan) and E53 (green). Each mutation adds two negatively charged side chains per rung in the second shell of residues around the central cavity, thus reducing the shell’s net positive charge.
Extended Data Figure 7
Extended Data Figure 7. Filamentous α-synuclein pathology in DLB.
(a), Staining of inclusions in frontal cortex of DLB cases 1 and 2 and amygdala of DLB case 3 by an antibody specific for α-synuclein phosphorylated at S129 (brown). Scale bar, 50 μm. (b), Negative-stain EM images of filaments from frontal cortex of DLB cases 1 and 2 and amygdala of DLB case 3. Scale bar, 50 nm. (c), Representative immunogold negative-stain EM images of α-synuclein filaments extracted from frontal cortex of DLB cases 1 and 2 and amygdala of DLB case 3. Filaments were labelled with antibody PER4, which recognises the C-terminus of α-synuclein. Arrowheads point to an unlabelled tau paired helical filament. Scale bar, 200 nm. (d), Representative cryo-EM images of α-synuclein filaments from frontal cortex of DLB cases 1 and 2, and amygdala of DLB case 3. Scale bar, 200 nm. Arrowheads point to a tau paired helical filament, as evidenced by a three-dimensional reconstruction (inset), calculated as described (6). (e), Two-dimensional class averages of α-synuclein filaments extracted from frontal cortex of DLB cases 1 and 2 and amygdala of DLB case 3.
Extended Data Figure 8
Extended Data Figure 8. Structures of α-synuclein protofilament cores.
(a), Schematic of secondary structure elements in the α-synuclein protofilament (PF) cores of MSA. Red arrows point to the non-proteinaceous density (in light red) at protofilament interfaces. (b,c), Secondary structure elements in the α-synuclein protofilament cores assembled from recombinant wild-type (b) and mutant (c) α-synuclein. β-Strands are shown as thick arrows. (d), Schematic depicting the first 100 amino acids of human α-synuclein, comparing secondary structure elements in PF cores from MSA with those in PF cores assembled from recombinant α-synuclein. As observed previously for tau filaments (9), the arrangement of residues in β-strands is largely conserved among protofilament cores. This is especially the case for residues that adopt the conserved three-layered L-shaped motif, and less so for residues in the N-terminal arms.
Extended Data Figure 9
Extended Data Figure 9. MSA filaments differ from those assembled with recombinant α-synuclein.
(a), Overlay of the three-layered L-shaped motifs of MSA α-synuclein filaments (yellow, orange, pink and purple) and filaments assembled in vitro using recombinant α-synuclein that contain a similar motif (grey). Despite topological similarities, none of the three-layered L-shaped motifs in recombinant α-synuclein protofilaments are identical to those of MSA protofilaments. The closest similarity to an in vitro structure is between PF-IIB2 and 6PEO (52), which differ only in the bend positions in the outer layer (between E57 and K58 for PF-IIB2 and between T59 and K60 for 6PEO). (b), Overlay of MSA and recombinant α-synuclein structures based on the turn at K43-V52, revealing a conserved interface between E46-V49 and V74-A78 or A76-K80 (red highlight), including the formation of a salt bridge between E46 and K80. (c), Overlay of MSA and recombinant α-synuclein structures based on the conserved turn at V63-T72, revealing a second conserved turn (V63-T72) and a conserved packing through tight interdigitations of small side chains between A69-T72 and residues on the inner layer (green highlight). In MSA PF-IA and PF-IIA filaments, as well as in 6OSM (47), these residues are A89 and A91; in MSA PF-IB and PF-IIB filaments, as well as in 6PEO, they are G93 and V95; in several recombinant α-synuclein structures, they are A91 and G93.
Figure 1
Figure 1. Filamentous α-synuclein pathology of MSA.
(a), Staining of neuronal and glial inclusions in the putamen of MSA cases 1-5 by an antibody specific for α-synuclein phosphorylated at S129 (brown). Scale bar, 50 μm. (b), Negative stain electron micrographs of filaments from the putamen of MSA cases 1-5. Spherical densities likely correspond to ferritin that purified with the filaments. Scale bar, 50 nm.
Figure 2
Figure 2. Cryo-EM maps and atomic models of MSA Type I and Type II α-synuclein filaments
(a,b), Cryo-EM maps of Type I filaments from the putamen of MSA cases 1, 2, 3 and 4 (a) and of Type II filaments from the putamen of MSA cases 1, 2 and 5 (b). For MSA case 2, zoomed-in views of the different regions in Type II1 and II2 filaments are also shown. (c,d), Schematic of the primary structure of human α-synuclein, indicating the cores of protofilaments (PF) IA, IB, IIA and IIB. The NAC domain (residues 61-95) is also shown. (e,f), Sharpened, high-resolution cryo-EM maps of MSA Type I (e) and Type II (f) α-synuclein filaments with overlaid atomic models. Unsharpened, 4.5 Å low pass-filtered maps are in grey. They show weaker densities that extend from the N- and C-terminal regions, a peptide-like density in PF-IIA, as well as weaker densities bordering the solvent-exposed chains of K32 and K34 in PF-IA, PF-IB and PF-IIA. Weaker densities bordering the solvent-exposed chains of K58 and K60 in PF-IA and PF-IIA are also present. (g,h), Cryo-EM structures of A78-Q99 of PF-IIB, illustrating heterogeneity (PF-IIB1 and PF-IIB2). Note the strong density at the protofilament interfaces of MSA Type I and Type II filaments. It is surrounded by the side chains of K43, K45 and H50 from each protofilament.
Figure 3
Figure 3. Comparison of MSA α-synuclein protofilament folds
(a), Overlay of the structures of MSA PF-IA, PF-IB, PF-IIA and PF-IIB. The black arrow indicates the direction of the conformational change that occurs at K43 of PF-IA and PF-IIA. (b,c), Three-layered L-shaped motifs of PF-IA (yellow) and PF-IIA (pink) are aligned, based on the structural similarities between T64-F94 (b) and T44-E57 (c). Black arrows indicate the direction of the conformational change that occurs at T64 (b) or E57 (c) of PF-IA and PF-IIA. The peptide-like density in PF-IIB is shown as a pink mesh.

Similar articles

Cited by

References

    1. Goedert M, Jakes R, Spillantini MG. The Synucleinopathies: twenty years on. J Parkinson’s Dis. 2017;7:S51–S69. - PMC - PubMed
    1. Spillantini MG, et al. α-synuclein in Lewy bodies. Nature. 1997;388:839–840. - PubMed
    1. Polymeropoulos MH, et al. Mutation in the α-synuclein gene identified in families with Parkinson’s disease. Science. 1997;276:2045–2047. - PubMed
    1. Fitzpatrick AWP, et al. Cryo-EM structures of tau filaments from Alzheimer’s disease. Nature. 2017;547:185–190. - PMC - PubMed
    1. Falcon B, et al. Structures of filaments from Pick’s disease reveal a novel tau protein fold. Nature. 2018;561:137–140. - PMC - PubMed

Publication types

MeSH terms

Substances