. 2020 Jun;582(7812):426-431.
doi: 10.1038/s41586-020-2327-4. Epub 2020 May 27.

Ensuring meiotic DNA break formation in the mouse pseudoautosomal region

Affiliations

Ensuring meiotic DNA break formation in the mouse pseudoautosomal region

Laurent Acquaviva et al. Nature. 2020 Jun.

Abstract

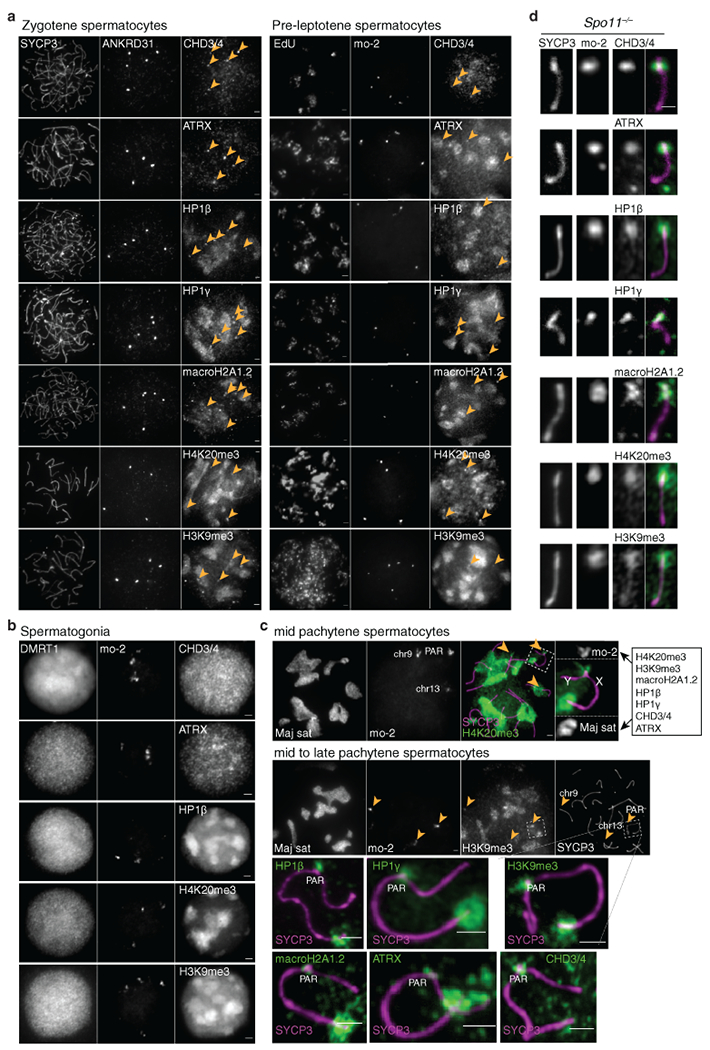
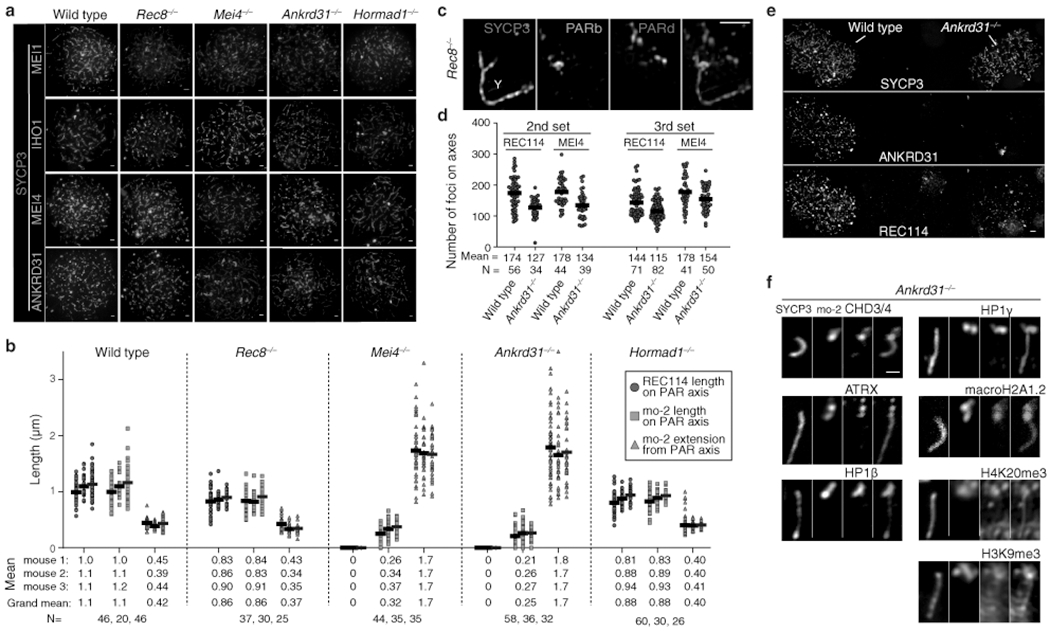
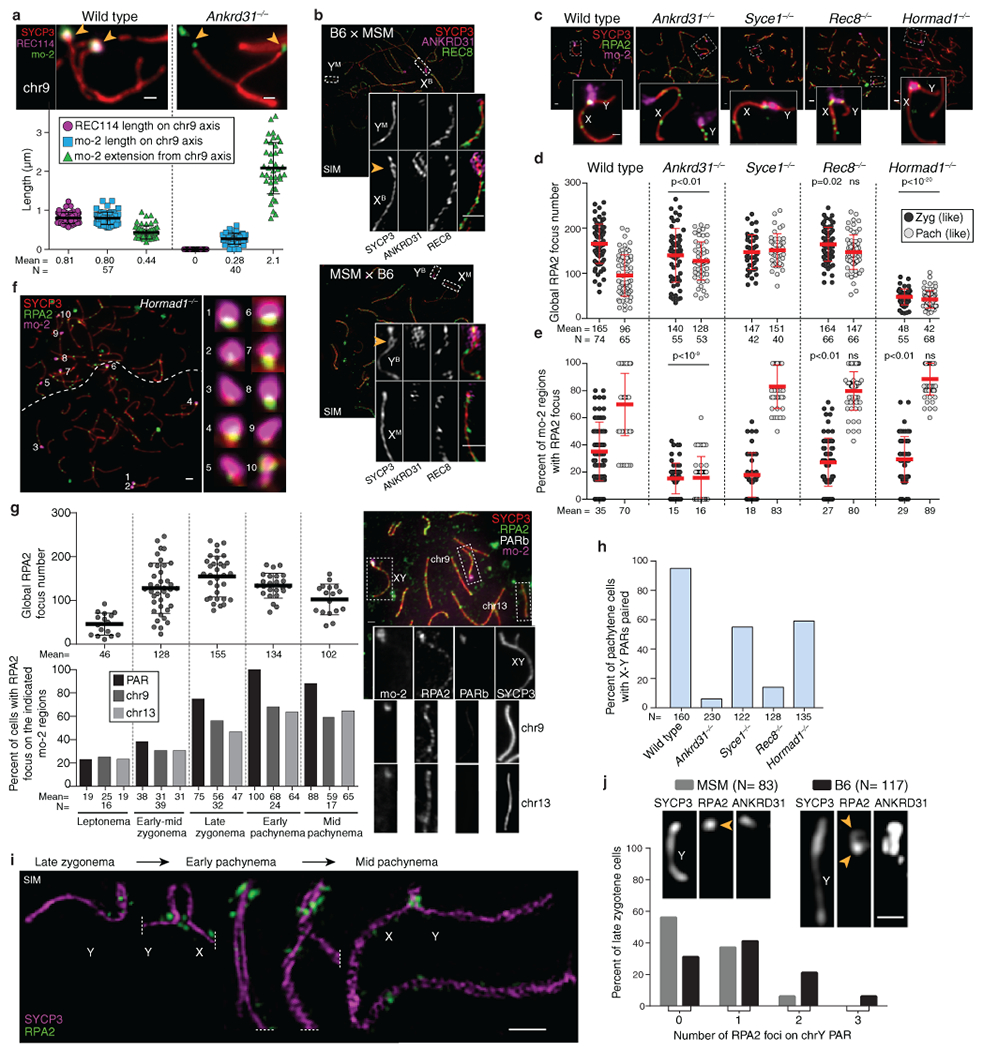
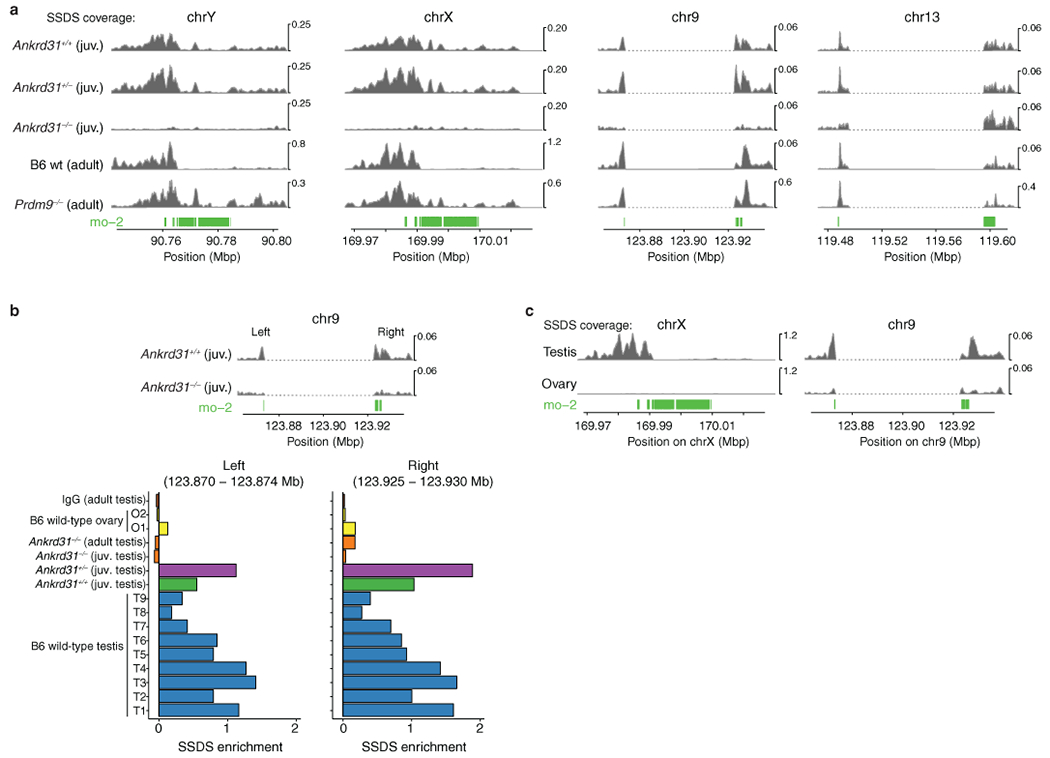
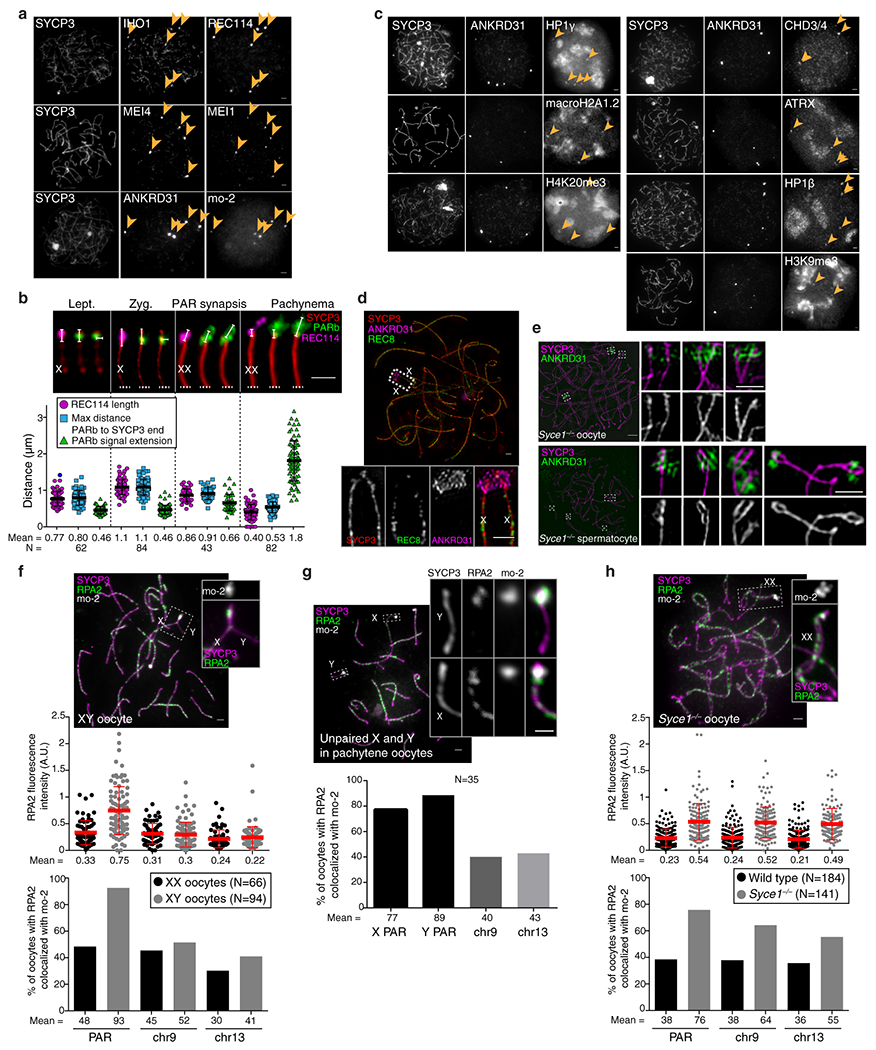
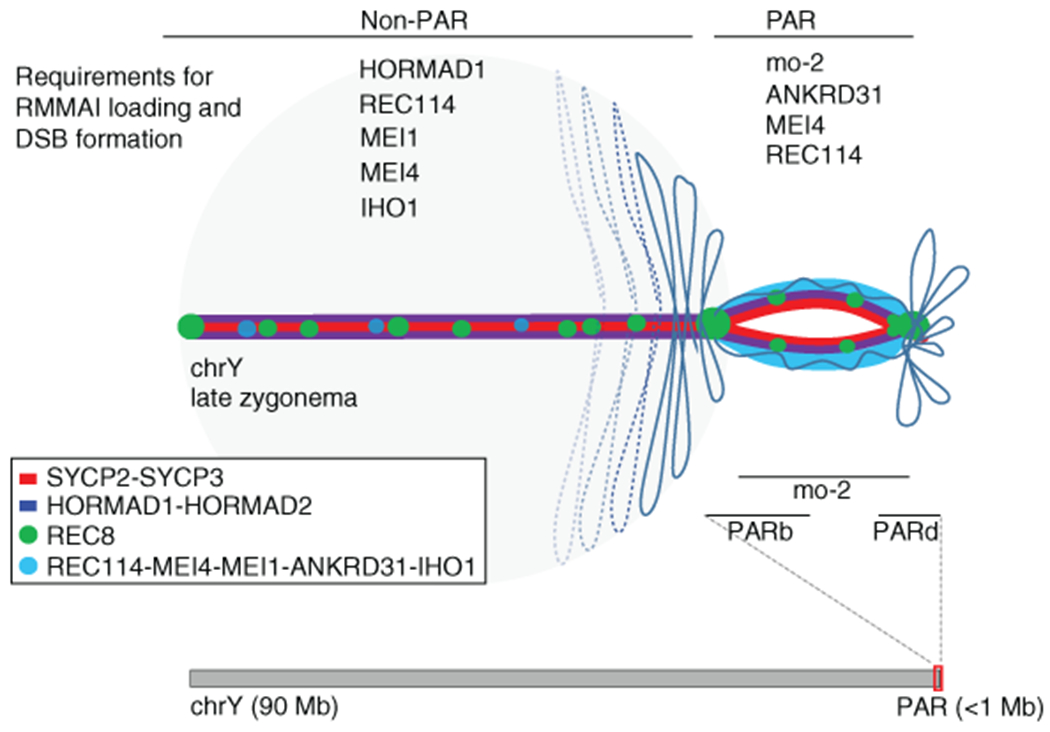
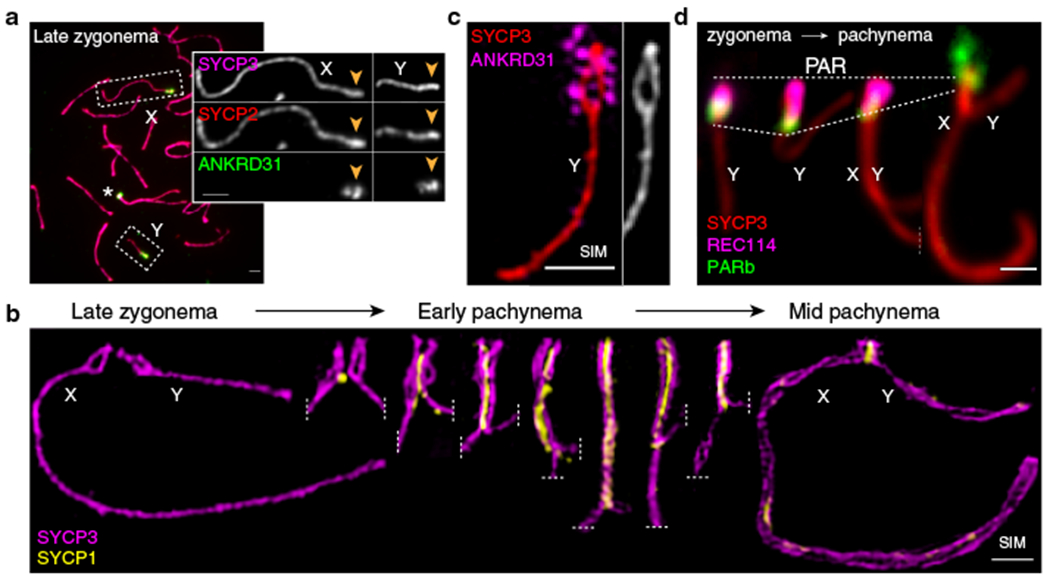
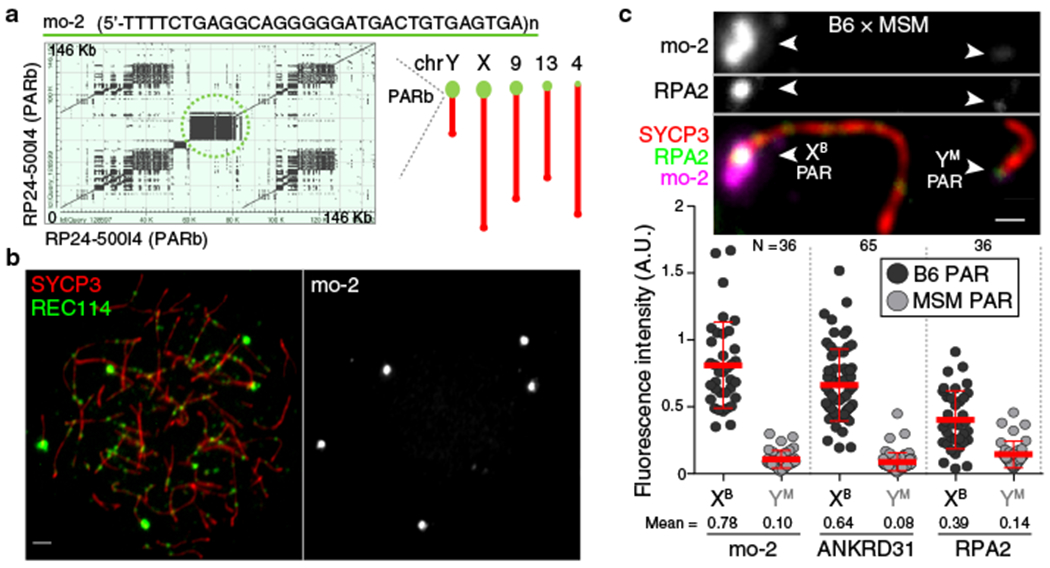
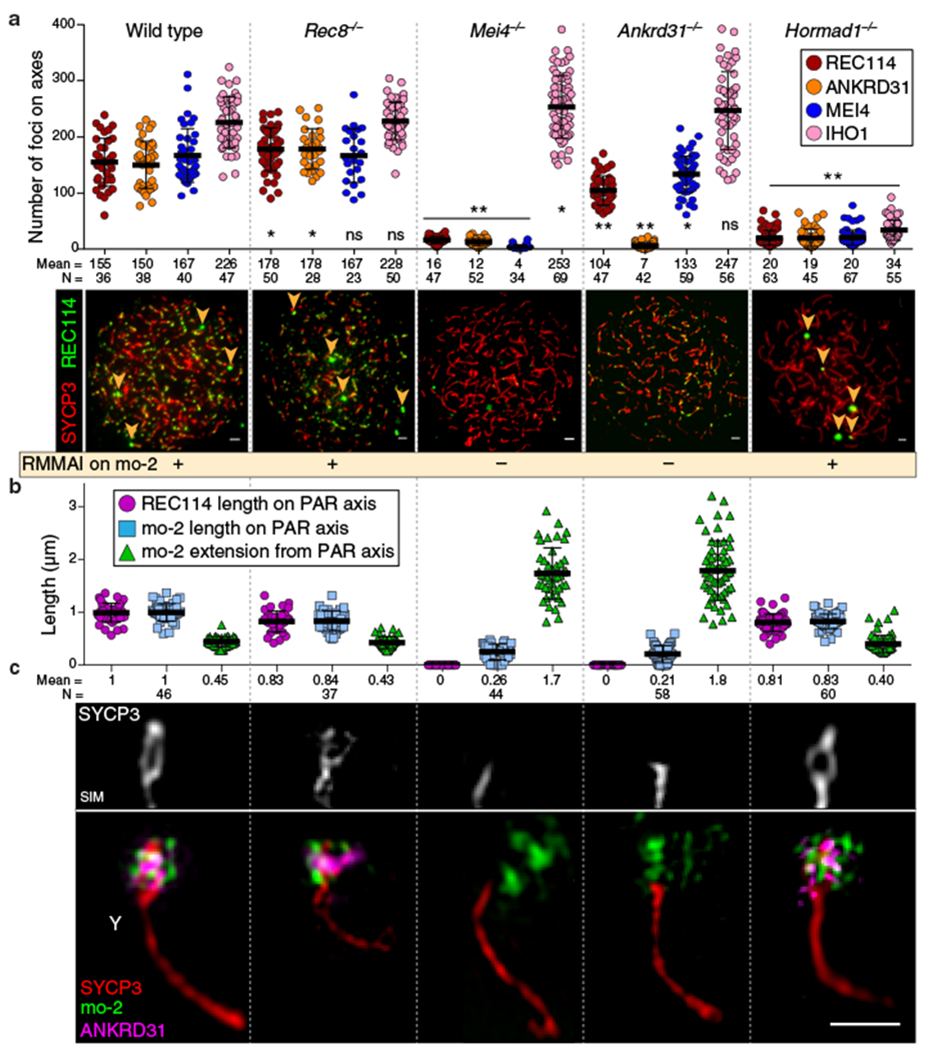
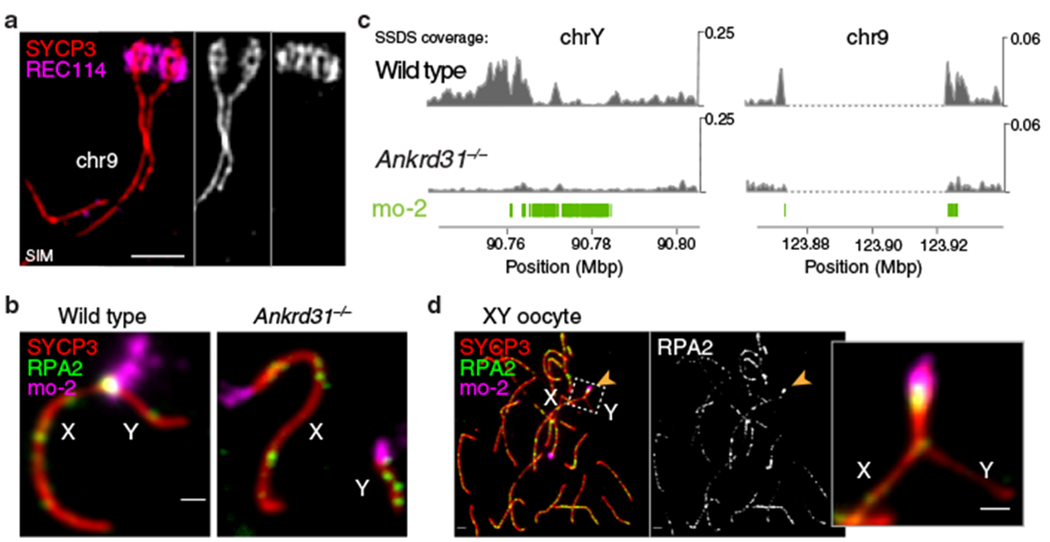
Sex chromosomes in males of most eutherian mammals share only a small homologous segment, the pseudoautosomal region (PAR), in which the formation of double-strand breaks (DSBs), pairing and crossing over must occur for correct meiotic segregation1,2. How cells ensure that recombination occurs in the PAR is unknown. Here we present a dynamic ultrastructure of the PAR and identify controlling cis- and trans-acting factors that make the PAR the hottest segment for DSB formation in the male mouse genome. Before break formation, multiple DSB-promoting factors hyperaccumulate in the PAR, its chromosome axes elongate and the sister chromatids separate. These processes are linked to heterochromatic mo-2 minisatellite arrays, and require MEI4 and ANKRD31 proteins but not the axis components REC8 or HORMAD1. We propose that the repetitive DNA sequence of the PAR confers unique chromatin and higher-order structures that are crucial for recombination. Chromosome synapsis triggers collapse of the elongated PAR structure and, notably, oocytes can be reprogrammed to exhibit spermatocyte-like levels of DSBs in the PAR simply by delaying or preventing synapsis. Thus, the sexually dimorphic behaviour of the PAR is in part a result of kinetic differences between the sexes in a race between the maturation of the PAR structure, formation of DSBs and completion of pairing and synapsis. Our findings establish a mechanistic paradigm for the recombination of sex chromosomes during meiosis.


Conflict of interest statement

Authors declare no competing interests.

Figures

Extended Data Fig. 1:
Extended Data Fig. 1:. PAR axis thickening and accumulation of RMMAI proteins.
(a) Axis thickening (SYCP3 and HORMAD2 staining) on the PAR (arrowhead) in a late zygotene spermatocyte. Scale bar: 2 μm. HORMAD2 staining in the PAR at late zygonema mimics SYCP3 staining in all late zygonema spermatocytes analyzed (N>20) in three mice. (b) Image adapted under Creative Commons CC-BY license from ref. showing enrichment of HORMAD1 on the thick PAR axis of the Y chromosome. (c) Colocalization of ANKRD31 and MEI4, REC114, IHO1, and MEI1. Representative zygotene spermatocytes are shown. Arrowheads indicate densely staining blobs. Areas indicated by dashed boxes are shown at higher magnification. The graphs show the total number of foci colocalized in leptotene/zygotene spermatocytes (error bars are mean ± SD). N.D., not determined: The low immunofluorescence signal for MEI1 did not allow us to quantify the colocalization with ANKRD31, although MEI1 showed clear colocalization with ANKRD31 in the blobs and at least some autosomal foci (insets). Scale bars: 2 μm. Underlying data for all graphs are in Data Files S1–4. Further evidence for extensive colocalization with ANKRD31 is documented in separate studies,. (d) PARb FISH probe colocalizes with REC114 blobs. Two blobs are on PAR, as judged by chromosome morphology and bright fluorescence in situ hybridization (FISH) with a PAR boundary probe (PARb) and others highlight specific autosome ends. Scale bar: 2 μm. The colocalization between REC114 blobs and PARb FISH signals has been observed in all spermatocytes analyzed (N>60), from pre-leptonema to early pachynema, in more than three mice. (e) ANKRD31, REC114, and MEI1 immunostaining starts to appear in pre-leptonema. Seminiferous tubules were cultured with 5-ethynyl-3-deoxyuridine (EdU) to label replicating cells, then chromosome spreads were stained for SYCP3 and either MEI1 plus REC114 or ANKRD31 plus PARb FISH. Colocalized foci appear in pre-leptonema (EdU-positive cells that are weakly SYCP3-positive), as previously shown for MEI4 and IHO1,. Because we can already detect ANKRD31 accumulation at sites of PARb-hybridization, we infer that the stronger sites of accumulation of MEI1 and REC114 also include PARs. Scale bars: 2 μm. PARb colocalized with ANKRD31 blobs (top panel) and MEI1 with REC114 (bottom panel) in all pre-leptotene spermatocytes analyzed (N>20) in one mouse. (f) REC114 is not detected in the mo-2 regions in spermatogonia. Seminiferous tubules were cultured with EdU, and chromosome spreads were stained for DMRT1 (a marker of spermatogonia) and REC114 plus mo-2 FISH. REC114 blobs colocalized with mo-2 FISH signals in the preleptotene spermatocyte (bottom) but were not apparent in the DMRT1-positive spermatogonium (top). Both cells shown were captured in a single microscopic field. Scale bar: 2 μm. Mo-2 FISH signals do not colocalize with REC114 signal in all the spermatogonia analyzed (N>20) in one mouse. (g) Candidate ANKRD31 interacting proteins. To identify other PAR-associated proteins, ANKRD31 was immunoprecipitated from extracts made from whole testes of 12-dpp-old mice using two different polyclonal antibodies. This table shows a subset of proteins that were identified by mass spectrometry in immunoprecipitates from wild-type testes but not from Ankrd31−/−animals, and not from immunoprecipitates using an irrelevant antibody (anti-Cyclin B3). Full results are in Data File S3. LFQ, label-free quantification. REC114, MEI4, and MEI1 were recovered, confirming specificity. REC114 is known to interact directly with ANKRD31 and MEI4 is a direct partner of REC114,. MEI1 colocalizes with ANKRD31 on chromatin (panel c). We also identified ZMYM3 and PTIP. ZMYM3 (zinc finger, myeloproliferative, and mental retardation-type 3) is a component of LSD1-containing transcription repressor complexes and has incompletely understood functions in DNA repair in somatic cells. Mutation of Zmym3 results in adult male infertility from unknown causes. However, the spermatocyte metaphase I arrest in this mutant may be consistent with presence of achiasmate chromosomes, possibly including X and Y. PTIP (Pax transactivation domain interacting protein; also known as PAXIP1) contains multiple BRCT (BRCA1 C-terminal) domains and regulates gene transcription, class switch recombination, and DNA damage responses in somatic cells. Conditional knockout of Ptip causes spermatogenic arrest, but the function of PTIP during meiosis remains unclear. Neither ZMYM3 nor PTIP was implicated previously in sex chromosome recombination. (h) Enrichment of ZMYM3 (top) and PTIP (bottom) on the PAR. Sex chromosomes of representative early pachytene spermatocytes are shown. Scale bars: 1 μm. ZMYM3 and PTIP were enriched in the PAR in all spermatocytes analyzed (N>20) in three mice. (i) Yeast two-hybrid assays testing interaction of full-length ANKRD31 fused to the Gal4 activating domain (AD) with either full-length PTIP or the C-terminal 191 amino acids of ZMYM3 fused to the Gal4 DNA binding domain (BD). (Full-length ZMYM3 autoactivates in this assay.) DDO (double dropout) medium selects for presence of both the AD and BD vectors (positive control for growth); QDO (quadruple dropout) and QXA (QDO plus X-α-gal and aureobasidin A) media select for a productive two-hybrid interaction at lower and higher stringency, respectively. Image is representative of two experiments using the same yeast strains.
Extended Data Fig. 2:
Extended Data Fig. 2:. PAR ultrastructure.
(a) Comparison of conventional microscopy and SIM, showing that the thickened PAR axis in conventional microscopy is resolved as separated axial cores (arrowheads). Scale bars: 2 μm. The thickening of the PAR axis in conventional microscopy and the splitting of the PAR axis in SIM was observed in more than 60 spermatocytes at late zygonema in at least three mice. (b) Ultrastructure of axis proteins SYCP2, SYCP3, and HORMAD2 in the PAR. Scale bars: 1 μm. SYCP2 (left) and HORMAD2 (right) staining mimic SYCP3 staining in late zygonema by conventional microscopy in all cells analyzed (N>30) in at least three mice, and by SIM (N=5, one mouse) (except that HORMAD2 appears rather depleted at the telomeres compared to SYCP3 and SYCP2). (c-d) Ruling out a crozier configuration. In principle, sister chromatid axes could be split apart or the PAR could adopt a crozier configuration in which a single conjoined axis for both sister chromatids is folded back on itself. A crozier (cartooned in c) was ruled out because the telomere binding protein TRF1 decorates the tip of the PAR bubble (d) and FISH signal for the PARb probe is arrayed relatively symmetrically on both axial cores (e), consistent with separated sister chromatid axes (a bubble configuration). Scale bars: 1 μm. We conclude that each axis is a sister chromatid, with a “bubble” from near the PAR boundary almost to the telomere. The presence of TRF1 at the distal tip of the PAR was observed in all spermatocytes analyzed, in one mouse (by conventional microscopy, N>20; by SIM, N=3). PARb FISH signals were relatively symmetrically arranged along the split PAR axes (by conventional microscopy, N>100 in at least three mice, or by SIM, N=9 in three mice). (f) Schematic of PAR ultrastructure and distribution of axis and RMMAI proteins at late zygonema. (g, h) Paired PARs with elongated and split axes occur in late zygonema to early pachynema. Shown are electron micrographs adapted with permission from ref. in comparison with SIM immunofluorescence images of spermatocytes at early pachynema (panel g) or late zygonema (panel h; cyan arrowheads indicate examples of incomplete autosomal synapsis). The spermatocytes in the electron micrographs were originally considered to be in mid-to-late pachynema. However, in our SIM experiments, we can only detect this structure (paired X and Y with elongated and split axes, resembling a crocodile’s jaws) around the zygotene-to-pachytene transition, when RMMAI proteins are still highly abundant on the PAR axes, and when most or all autosomes are completely synapsed. Moreover, other published electron micrographs from mid-to-late pachytene spermatocytes show diagnostic ultrastructural features that are not present in the electron micrographs reproduced here, including a short PAR axis length, multi-stranded stretches of axis on non-PAR portions of the X and Y chromosomes with excrescence of axial elements, and a clear thickening of autosomal telomeres,. These observations allow us to conclude definitively that the elongation and splitting of PAR axes are a hallmark of cells from late zygonema into early pachynema. Scale bars in SIM images: 1 μm in panel g, 2 μm in panel h. Extended and split PAR axes were observed by SIM (N>30 spermatocytes) around the zygonema-pachynema transition in more than three mice. (i) REC114 enrichment and axis splitting occurs in the absence of SPO11, thus neither is provoked by DSB formation. Scale bar: 1 μm. PAR axis splitting and extension of the RMMAI signal were observed by SIM in Spo11−/− mice in more than 20 late zygotene-like spermatocytes in more than three mice. The differentiation of the PAR axis became hardly detectable at later stages in some pachytene-like spermatocytes as cells entered apoptosis.
Extended Data Fig. 3:
Extended Data Fig. 3:. Time course of the spatial organization of the PAR loop–axis ensemble.
(a) Time course of REC8 and ANKRD31 immunostaining along the PAR axis from pre-leptonema (preL, left) to mid pachynema (right). A montage of representative SIM images is shown. Chromosomes a–e are presumptive X or Y, but could be the distal end of chr9. Chromosomes at later stages were unambiguously identified by morphology. Chromosomes i–k show examples where the initial pairing (probably synaptic) contact between X and Y is (i) centromere-proximal (that is, closer to the PAR boundary), (k) distal (closer to the telomere), or (j) interstitial. Scale bar: 1 μm. The preferential enrichment of REC8 at the border of the PAR split axes was observed in more than 30 zygotene spermatocytes by SIM in more than three mice. (b) We collected three measurements of conventional immuno-FISH images from leptonema through mid-pachynema: length of the REC114 signal along the PAR axis; maximal distance from the PARb FISH signal to the distal end of the SYCP3-defined axis; and axis-orthogonal extension of FISH signal for the PARb probe (a proxy for loop sizes). Data were collected on three males. Insets show examples of each type of measurement at each stage. Horizontal black lines indicate means. Means of each measurement for each mouse at each stage are given below, along with the means across all three mice. Means are rounded to two significant figures; the grand means were calculated using unrounded values from individual mice. The number of cells of each stage from each mouse is given (N). Modest variability in the apparent dimensions of the Y chromosome PAR between different mice may be attributable to variation in copy number of mo-2 and other repeats because of unequal exchange during meiosis. Nonetheless, highly similar changes in spatial organization over time in prophase were observed in all mice examined, namely progressive elongation then shortening of axes and concomitant lengthening of loops. Scale bar: 1 μm. Briefly, panels a and b show the following. At pre-leptonema, ANKRD31 blobs had a closely juxtaposed focus of the meiotic cohesin subunit REC8 (chromosome a). In leptonema and early zygonema, ANKRD31 and REC114 signals stretched along the presumptive PAR axes, with REC8 restricted to the borders (panel a, chromosomes b–e). The SYCP3-defined axis was already long as soon as it was detectable (0.73 μm) and the PARb FISH signal was compact (0.52 μm) (panel bi). At late zygonema, the PAR axis had lengthened still further (1.0 μm), while the PARb signal remained compact (panel bii). The PAR split into separate axes during this stage, each with abundant RMMAI (panel a, chromosomes f–h). The split was a REC8-poor zone bounded by REC8 foci (panel a, chromosomes f–h and Extended Data Fig. 2f). After synapsis, axes shortened and chromatin loops decompacted, with concomitant RMMAI dissociation. As cells transitioned into early pachynema and the X and Y PARs synapsed (panel a, chromosomes i–m), the PAR axes began to shorten slightly (0.85 μm) while the PARb signal expanded (0.85 μm) (panel biii). Meanwhile, the elongated ANKRD31 signals progressively decreased in intensity, collapsed along with the shortening axes, and separated from the axis while remaining nearby (panel a, chromosomes l–m). By mid-pachynema, PAR axes collapsed still further, to about half their zygotene length (0.50 μm) and the PARb chromatin expanded to more than twice the zygotene measurement (1.3 μm). ANKRD31 and REC114 enrichment largely disappeared, leaving behind a bright bolus of REC8 on the short remaining axis (panel a, chromosomes n–o and panel biv). (c) Non-homologous synapsis appears sufficient to trigger collapse of the PAR loop-axis structure. We measured REC114 signal length along the PAR axis and extension of mo-2 chromatin orthogonal to the axis in Spo11−/− spermatocytes in which the X PAR had non-homologously synapsed with an autosome while the Y PAR remained unsynapsed. Within any given cell, the unsynapsed Y PAR maintained the characteristic late zygotene configuration (long axis, short loops) whereas the synapsed X PAR adopted the configuration characteristic of mid-pachynema (short axis, long loops). Error bars are mean ± SD. Scale bar: 2μm. We do not exclude that DSB formation without synapsis may also be sufficient (Supplementary Discussion).
Extended Data Fig. 4:
Extended Data Fig. 4:. RMMAI enrichment at mo-2 minisatellite arrays in the PAR and on specific autosomes.
(a) Top panel: Self alignment of the PARb FISH probe (reproduced from Fig. 2a). The circled block is a 20-kb mo-2 cluster. Bottom panel: Schematic depicting the last 1.4 Mb of the non-centromeric ends of the indicated chromosomes, showing the positions of mo-2 repeats (green) adjacent to assembly gaps (mm10); mo-2 repeats were identified by BLAST search using the mo-2 consensus sequence. Mo-2 repeats also appear at the distal end of chr4 in the Celera assembly (Mm_Celera, 2009/03/04). PARb and PARd BAC clones are indicated. (b) Confirmation that autosomal mo-2 FISH signals match the chromosomal locations indicated by mm10 or Celera genome assemblies. FISH was performed using an oligonucleotide probe containing the mo-2 consensus sequence in combination with BAC probes for adjacent segments of chromosomes 13, 9 and 4, as indicated. Magenta arrows point to concordant FISH signals. The chr9 BAC probe also hybridizes to the PAR. Scale bars: 2μm. The colocalization of mo-2 and the three autosomal FISH signals was observed in two mice (N>20 spermatocytes). (c) Comparison of mo-2 FISH with REC114 localization relative to the PAR boundary (PARb FISH probe) and the distal PAR (PARd probe). In mid zygonema, the mo-2 FISH signal colocalizes well with REC114 staining in between the PARb and PARd FISH signals. In late zygonema, mo-2 and REC114 are similar to one another and are elongated along the thickened SYCP3 staining of the PAR axis. From early to mid pachynema, REC114 progressively disappears, whereas the mo-2 FISH signal becomes largely extended away from the PAR axes. Note that the relative positions of the PARb and PARd probes reinforce the conclusion that the PAR does not adopt a crozier configuration. Scale bar: 1 μm. The different positioning of PARb and PARd FISH signals compared to mo-2 or REC114 signals was observed in more than 30 spermatocytes in at least three mice. (d) Illustration of the compact organization of the PAR chromatin (mo-2 FISH signal) compared to a whole-Y-chromosome paint probe. Scale bar: 2 μm. The costaining of mo-2 and full chrY probe was evaluated in one mouse (N>20 spermatocytes). (e) Lower mo-2 copy number in the M. m. molossinus subspecies correlates with lower REC114 staining in mo-2 regions. The left panels compare MSM and B6 mice for the colocalization between REC114 immunostaining and mo-2 FISH in leptotene spermatocytes. The REC114 and SYCP3 channels are shown at equivalent exposure for the two strains, whereas a longer exposure is shown for the mo-2 FISH signal in the MSM spermatocyte. Note that the mo-2-associated REC114 blobs are much brighter relative to the smaller dispersed REC114 foci in the B6 spermatocyte than in MSM. The right panel shows representative pachytene spermatocytes to confirm the locations of mo-2 clusters at autosome ends and the PAR in the MSM background. Scale bars: 2 μm. The lower intensity of REC114 blobs in MSM compared to B6 was observed in N>30 spermatocytes in three different pairs of mice. (f) PAR enrichment for ANKRD31 and RPA2 correlates with mo-2 copy number. Top panel: late zygotene spermatocytes from MSM x B6 F1 hybrid. Scale bar: 1 μm. Bottom panel: PAR-associated signals (A.U., arbitrary units) on B6-derived (YB) and MSM-derived chromosomes (XM) from the indicated number of spermatocytes (N). Red lines: means ± SD. Differences between X and Y PAR intensities are significant for both proteins and for mo-2 FISH in both F1 hybrids (p < 10−13, paired t-test; exact two-sided p values are in Data File S5). (g) Representative micrographs of late zygotene spermatocytes from reciprocal F1 hybrid males from crosses of B6 (high mo-2 copy number) and MSM (low mo-2 copy number) parents. Scale bar: 1 μm. (h) Frequency of paired X and Y at late zygonema and mid pachynema analyzed in three MSM and three B6 males. Differences between strains were not statistically significant at either stage (p = 0.241 for late zygonema and p = 0.136 for mid pachynema; two-sided Student’s t test). Note also that MSM X and Y are late-pairing chromosomes, as in the B6 background. The similar pairing kinetics indicates that the lower intensity of RMMAI staining on the MSM PAR is not attributable to earlier PAR pairing and synapsis in this strain. The number of spermatocytes analyzed is indicated (N).
Extended Data Fig. 5:
Extended Data Fig. 5:. Mo-2 regions accumulate heterochromatin factors.
(a) Costaining of ANKRD31 or mo-2 with the indicated proteins and histone marks known to localize at the pericentromeric heterochromatin (mouse major satellite), in zygotene spermatocytes (left) and pre-leptotene spermatocytes (right). Each of the heterochromatin factors shows locally enriched signal coincident with mo-2 regions (arrowheads), in addition to broader staining of other sub-nuclear regions. Scale bars: 2 μm. The CHD3/4 antibody recognizes both proteins. The colocalization of ANKRD31 blobs with heterochromatin blobs was observed in all zygotene spermatocytes analyzed (N>20) in at least three mice for each antibody (left panel) and in one mouse for pre-leptotene spermatocytes (N>10) for each antibody (right panel). (b) CHD3/4, ATRX, HP1β, H4K20me3, H3K9me3 and macroH2A1.2 are not detectably enriched at mo-2 regions in spermatogonia (small, DMRT1-positive cells). These factors may be present at mo-2 regions in these cells, but do not appear to accumulate to elevated levels. Scale bars: 2 μm. The absence of colocalization between mo-2 FISH signals and heterochromatin factors was noted in all spermatogonia analyzed (N>30) from one mouse. (c) Heterochromatin factors can be detected in the PAR up to late pachynema. Each of the assayed proteins and histone marks showed staining on the autosomal and X-specific pericentromeric heterochromatin, the sex body, and euchromatin, albeit with variations between sites in the timing and level of accumulation. Importantly, however, they also showed enriched staining at all mo-2 regions up to early/mid-pachynema, as shown for H4K20me3 (top panel). By mid-to-late pachynema, as shown for H3K9me3 here, the signal persisted in the PAR but was usually barely detectable on chr9 or chr13 mo-2 regions. This observation indicates that, at least for the PAR, the heterochromatin factors can continue to be enriched on mo-2 chromatin after RMMAI proteins have dissociated. These results substantially extend previous observations about CHD3/4 colocalizing with PAR FISH signals; H4K20me3 being localized in the PAR and other chromosome ends; and H3K9me3, HP1β and macroH2A1.2 detection in the PAR in late pachynema. Scale bars: 2 μm. The colocalization between Maj sat and H4K20me3 and H3K9me3 was observed in all spermatocytes analyzed (N>20) in one mouse. The colocalization between H4K20me3 and mo-2 FISH signals was observed in all spermatocytes analyzed (N>60), from preleptotene to mid pachytene in more than three mice. (d) Enrichment of the heterochromatin factors is independent of SPO11. Representative images of Y chromosomes from a Spo11−/− mouse are shown. Scale bar: 1 μm. The colocalization between PAR mo-2 FISH signals and heterochromatin factors was observed in all Spo11−/− spermatocytes analyzed (N>30) in more than three mice for CHD3/4 and at least one mouse each for ATRX, HP1β, HP1γ, macroH2A1.2, H3K9me3, and H4K20me3.
Extended Data Fig. 6:
Extended Data Fig. 6:. Genetic requirements for RMMAI assembly on chromosomes and for PAR loop–axis organization.
(a) Representative micrographs of ANKRD31, MEI4, IHO1 and MEI1 staining in wild type and the indicated mutants (quantification is in Fig. 3a). Scale bars: 2 μm. (b) Measurements of PAR loop–axis organization, as in Fig. 3b, on two additional males. Data from mouse 1 are reproduced from Fig. 3b to facilitate comparison. Means of each measurement for each mouse at each stage are given below, along with the means across all three mice. Means are rounded to two significant figures; the grand means were calculated using unrounded values from individual mice. The number of cells of each stage from each mouse is given (N). (c) REC8 is dispensable for splitting apart of PAR sister chromatid axes, but is required to maintain the connection between sisters at the distal tip of the chromosome. A representative SIM image is shown of a Y chromosome from a late zygotene Rec8−/− spermatocyte. The SYCP3-labeled axes adopt an open-fork configuration. Note that the distal FISH probe (PARd) shows that there are clearly disjoined sisters whereas the PAR boundary (PARb) shows only a single compact signal comparable to wild type. The disposition of the probes and SYCP3 further rules out the crozier configuration as an explanation for split PAR axes. Scale bar: 1 μm. The Y or X PAR structure was resolved by SIM as “fork-shaped” in all spermatocytes analyzed (N>20) from three mice. (d) Quantification of REC114 and MEI4 foci in two additional pairs of wild-type and Ankrd31−/− mice. Horizontal lines indicate means. Fewer foci were observed in the Ankrd31−/− mutant (two-sided Student’s t tests for each comparison of mutant to wild type: p = 5.6 × 10⁻⁶ (2nd set, REC114); p = 1.1 × 10⁻⁵ (2nd set, MEI4); p = 2.1 × 10⁻⁶ (3rd set, REC114); p = 0.017 (3rd, MEI4)). (e) Reduced REC114-staining intensity of axis-associated foci in Ankrd31−/− mutants. To rigorously control for slide-to-slide and within-slide variation in immunostaining, we mixed together wild-type and Ankrd31−/− testis cell suspensions before preparing chromosome spreads. A representative image is shown of a region from a single microscopic field containing two wild-type zygotene spermatocytes (left) and two Ankrd31−/− spermatocytes of equivalent stage (right). Note the diminished intensity of REC114 foci in the Ankrd31−/− spermatocytes. Scale bar: 2 μm. REC114 (non-blob) foci showed lower fluorescence intensity in Ankrd31−/− compared to wild type in all pairs of spermatocytes captured in the same imaging field (N=8 pairs), from one pair of mice. (f) PAR enrichment of heterochromatin-associated factors is independent of ANKRD31. Representative images of the Y chromosome at late zygonema/early pachynema showing colocalization between the decompacted mo-2 chromatin and the indicated proteins. Note that both the FISH and immunofluorescence signals are localized mostly off the axis. Compare with the same signals in absence of SPO11 (Extended Data Fig. 5d). Scale bar: 1 μm. Mo-2 FISH signal colocalized off the axis with the heterochromatin factors in Ankrd31−/− mice in all spermatocytes analyzed (N>30) in more than three mice for CHD3/4 and at least one mouse for ATRX, HP1β, HP1γ, macroH2A1.2, H3K9me3, and H4K20me3.
Extended Data Fig. 7:
Extended Data Fig. 7:. PAR-associated RPA2 foci.
(a) Loop-axis organization of the mo-2 region of chr9 in late zygonema. Compare with the PAR (Fig. 3b). Scale bars: 1 μm. Error bars: means ± SD. (b) Low mo-2 copy number correlates with less loop–axis reorganization (SIM images of late-zygotene F1-hybrid spermatocytes). Scale bars: 1 μm. The differentiation of the B6 PAR was observed in both hybrids B6 × MSM and MSM × B6 in 3 and 4 spermatocytes, respectively by SIM (1 mouse for each) and in more than 20 spermatocytes by conventional microscopy in two mice of each genotype. (c,d,e) Immuno-FISH for RPA2 and mo-2 was used to detect DSBs cytologically in wild type and the indicated mutants. To analyze Rec8 and Hormad1 mutations, we compared to mutants lacking SYCE1 (a synaptonemal complex central element component) because Syce1−/− mutants show similar meiotic progression defects without defective RMMAI recruitment. Panel c shows representative images. Scale bars: 2 μm, inset 1 μm. Panel d shows the global counts of RPA2 foci for zygotene (zyg) or zygotene-like cells and for pachytene (pach) or pachytene-like cells. Panel e shows, for each cell, the fraction of mo-2 regions that had a colocalized RPA2 focus. Red lines: means ± SD. Statistical significance is indicated in panels c and d for comparisons (two-sided Student’s t tests) of wild type to Ankrd31−/− or of Syce1−/− to either Rec8−/− or Hormad1−/− for matched stages. Exact p values are in Data File S7. Note that the number of discretely scorable mo-2 regions in panel e varied from cell to cell depending on pairing status. (f) Frequent DSB formation at mo-2 regions in the PARs and on autosomes does not require HORMAD1. Micrograph at left shows two adjacent spermatocytes (boundary indicated by dashed line). Scale bar: 2 μm. Insets at right show higher magnification views of the numbered mo-2 regions, all of which are associated with RPA2 immunostaining of varying intensity. This picture illustrates the preferential RPA2 focus formation in mo-2 regions in a Hormad1−/− mouse; quantification is in panel e. (g) Autosomal mo-2 regions often form DSBs late. Immuno-FISH for RPA2, mo-2, and PARb was used to detect DSBs cytologically in wild type from leptonema to mid-pachynema, and to distinguish the X or Y PAR from chromosomes 9 and 13. Chr4 was not assayed because the mo-2 FISH signal was often barely detectable. The top panel shows the global number of RPA2 foci per cell. Black lines are means ± SD. The bottom panel shows the percentage of spermatocytes with an RPA2 focus overlapping the PAR (X, Y, or both) or overlapping chr9 or chr13. A representative image of an early pachytene spermatocyte is shown. Note that, as previously shown for the PAR, autosomal mo-2 regions continue to accumulate RPA2 foci beyond the time when global RPA2 foci have largely or completely ceased accumulating. Scale bar: 2 μm. (h) X–Y pairing status, quantified by immuno-FISH for SYCP3 and the PARd probe. (i) Montage of SIM images from a B6 male showing that multiple, distinct RPA2 foci can be detected from late zygonema to mid pachynema, suggesting that multiple PAR DSBs can be formed during one meiosis (see also ref. for further discussion). Scale bar: 1μm. The presence of multiple RPA2 foci in the PAR was observed by SIM in more than 20 spermatocytes from late zygonema to mid pachynema in one mouse. (j) Percentage of spermatocytes at the zygotene-pachytene transition with no (0), 1, 2 or 3 distinguishable RPA2 foci on the unsynapsed Y chromosome PAR of MSM and B6 mice. The difference between the strains is statistically significant (negative binomial regression, p = 7.2 × 10⁻⁵). N indicates the number of spermatocytes analyzed. A representative picture is shown for each genotype, with one RPA2 focus on the MSM PAR and two apparent sites of RPA2 accumulation on the B6 PAR. The detection of multiple foci is consistent with reported double crossovers. Scale bar: 1 μm.
Extended Data Fig. 8:
Extended Data Fig. 8:. DSB maps on the PAR and autosomal mo-2 regions.
(a) SSDS sequence coverage (data from refs. ,) is shown for the X PAR (shown previously in different form in ref. ), the Y PAR, and the mo-2-adjacent regions of chr9 and chr13. The dashed segments indicate gaps in the mm10 genome assembly. We did not assess chr4 because available assemblies are too incomplete. (b) Regions adjacent to the mo-2 region on chr9 show SSDS signal that is reproducibly elevated relative to chr9 average in wild-type testis samples but not in maps from Ankrd31−/− testes or wild-type ovaries. Two of the SSDS browser tracks are reproduced from panel a. The bar graph shows enrichment values from individual SSDS maps (T1–T9 are maps from wild-type testes; O1 and O2 are from wild-type ovaries). Enrichment values are defined as coverage across the indicated coordinates relative to mean coverage for chr9 (see Methods for details). Note that ovary sample O1 and the Ankrd31−/− adult sample are known to have poorer signal:noise ratios than the other samples,. For all SSDS coverage tracks, reads mapping to multiple locations are included after random assignment to one of their mapped positions. However, the same conclusions are reached about ANKRD31-dependence and PRDM9-independence of signal on chr9 and chr13 if only uniquely mapped reads are used. (c) Oocytes incur substantially less DSB formation than spermatocytes near the mo-2 region on chr9. SSDS signal is from ref. (samples T1 and O2). The X-PAR is shown for comparison (previously shown to be essentially devoid of DSBs in ovary samples). See panel b for quantification.
Extended Data Fig. 9:
Extended Data Fig. 9:. RMMAI accumulation and low-level DSB formation on mo-2 regions in oocytes.
(a) Examples of zygotene oocytes showing the colocalization between blobs of IHO1 and REC114, MEI4 and MEI1, or ANKRD31 and mo-2 FISH signal (arrowheads). Scale bars: 2μm. RMMAI blobs colocalized with mo-2 FISH signals in all zygotene oocytes analyzed (N>30) from at least three mice. (b) PAR ultrastructure in oocytes, quantified as in Extended Data Fig. 3b. Late zygotene cells with PAR synapsis are compiled separately from other zygotene cells. Error bars: means ± SD. Scale bar: 1 μm. (c) Examples of zygotene oocytes showing colocalization of ANKRD31 blobs with enrichment for heterochromatin factors. Scale bars: 2 μm. ANKRD31 colocalized with heterochromatin factors blobs in all zygotene oocytes analyzed (N>20) from one mouse. (d) Representative SIM image of a wild-type late zygotene oocyte showing neither detectable splitting of the PAR axis nor REC8 enrichment. Scale bar: 2 μm. The absence of spermatocyte-like differentiation of the PAR axis was observed (N>30 zygotene oocytes) in more than three mice. A modest degree of differentiation was observed in a minority of oocytes (5/45) analyzed by SIM, but this did not resemble the typical PAR axis splitting found in spermatocytes. (e) Prolonged asynapsis does not allow axis splitting to occur in oocytes. Because synapsis appears sufficient to trigger collapse of PAR ultrastructure in spermatocytes (Extended Data Fig. 3b), we asked if preventing synapsis (i.e., in a Syce1−/− mutant) could reveal a cryptic tendency toward axis splitting in oocytes. However, whereas axis splitting was clearly observed by SIM in Syce1−/− mutant spermatocytes, PAR axes were not detectably split in oocytes. Scale bars: 2 μm for main micrograph, 1 μm for insets. Axis splitting of chr9 was observed by SIM in multiple (N>20) Syce1−/− spermatocytes from three different mice. The chr13 or chr4 centromere-distal axes were also occasionally seen to be split, but we did not quantify this for these chromosomes. In males, the differentiation of the PAR or the chr9 axes becomes hardly detectable at later stages in some pachytene-like spermatocytes as cells enter apoptosis, similar to Spo11−/− or Hormad1−/− mice. However, in Syce1−/− oocytes, no significant axis differentiation or splitting was observed by conventional microscopy or by SIM in multiple spermatocytes (N>30) from three different mice, similar to what we observed in wild-type oocytes. (f,h) Delaying synapsis promotes PAR DSB formation in oocytes. Top panels: representative micrographs of pachytene XY (f) and Syce1−/− XX oocytes (h). Middle panels: RPA2 fluorescence intensity at the border of mo-2 FISH signals from PAR, chr9, and chr13. Bottom panels: Percentage of oocytes with RPA2 focus colocalizing with mo-2 regions on PAR, chr9, and chr13. Graphs show data only for pachytene oocytes in which PARs are synapsed (two mice of each genotype). Error bars: means ± SD. Scale bars: 2 μm. (g) Percentage of pachytene oocytes with one or more RPA2 foci colocalizing with mo-2 FISH signal from PAR, chr9 and chr13 in XY pachytene oocytes that had unsynapsed X and Y chromosomes. Scale bar: 2 μm, inset: 1 μm.
Extended Data Fig. 10:
Extended Data Fig. 10:. Summary of PAR ultrastructure and molecular determinants of axis remodeling and DSB formation.
Schematic representation of the meiotic Y chromosome loop/axis structure before X–Y pairing/synapsis at the transition between zygonema and pachynema. The chromosome axis comprises the meiosis-specific axial proteins SYCP2, SYCP3, HORMAD1, and HORMAD2; cohesin subunits (only REC8 is represented); and the RMMAI proteins (REC114, MEI4, MEI1, ANKRD31, and IHO1). On the non-PAR portion of the Y chromosome axis (left), RMMAI protein loading and DSB formation are partly dependent on HORMAD1 and ANKRD31, and strictly dependent on MEI4, REC114, IHO1, and presumably MEI1. The DNA is organized into large loops, with a low number of axis-associated RMMAI foci. By contrast, in the PAR (right), the hyper-accumulation of RMMAI proteins at mo-2 minisatellites (possibly spreading into adjacent chromatin) promotes the elongation and subsequent splitting of the PAR sister chromatid axes. Short mo-2-containing chromatin loops stretch along this extended PAR axis, increasing the physical distance between the PAR boundary and the distal PAR sequences, including the telomere. The degree of RMMAI protein loading, PAR axis differentiation, and DSB formation are proportional to the mo-2 FISH signal (which we interpret as reflecting mo-2 copy number), and depend on MEI4, ANKRD31, and presumably REC114.
Fig. 1:
Fig. 1:. Ultrastructure of the PAR during male meiosis.
(a) Axis thickening (SYCP2 and SYCP3) and ANKRD31 accumulation on X and Y PARs (arrowheads) in late zygonema. The asterisk shows an autosomal ANKRD31 blob. Scale bar: 2 μm. (b) Ultrastructure of the PAR before and after synapsis (montage of representative SIM images). Dashed lines indicate where chromosomes are cropped. SIM: Structured Illumination Microscopy. Scale bar: 1 μm. (c) RMMAI enrichment along split PAR axes in late zygonema. Scale bar: 1 μm. (d) Schematic showing the dynamic remodeling of the PAR loop–axis ensemble during prophase I. See measurements in Extended Data Fig. 3b. Scale bar: 1 μm.
Fig. 2:
Fig. 2:. Arrays of the mo-2 minisatellite are sites of RMMAI protein enrichment in the PAR and on autosomes.
(a) Left panel: Self alignment of the PARb FISH probe. The circled block is a 20-kb mo-2 cluster. Right panel: Schematic showing the non-centromeric chromosome ends identified by BLAST search using the mo-2 consensus sequence. (b) Colocalization of REC114 blobs with mo-2 oligonucleotide FISH signal (zygotene spermatocyte). Scale bar: 2 μm. (c) PAR enrichment for ANKRD31 and RPA2 correlates with mo-2 copy number. Top panels: late zygotene spermatocyte from F1 hybrid from crosses of B6 × MSM. Scale bars: 1 μm. Bottom panels: PAR-associated signals (A.U., arbitrary units) on B6-derived (XB) and MSM-derived chromosomes (YM) from the indicated number of spermatocytes (N). Red lines: means ± SD. Differences between X and Y PAR intensities are significant for both proteins and for mo-2 FISH (p < 10−6, paired t-test; exact two-sided p values are in Data File S1).
Fig. 3:
Fig. 3:. Requirements for RMMAI recruitment and PAR axis remodeling.
(a) Quantification of REC114, ANKRD31, MEI4, and IHO1 foci along unsynapsed axes in leptotene/early zygotene spermatocytes. Error bars: means ± SD. Comparisons to wild type are indicated (two-sided Student’s t test): * = p<0.02, ** = p≤10−7, ns = not significant (p>0.05); exact p values are in Data File S2. Representative micrographs of REC114 staining are shown; other proteins are in Extended Data Fig. 6a. Presence of mo-2 associated blobs (arrowheads) is indicated in the bottom panel. Scale bars: 2 μm. (b) Genetic requirements for PAR loop–axis organization (length of REC114 and mo-2 FISH signals along the PAR axis and axis-orthogonal extension of mo-2). Error bars: means ± SD. (c) Representative SIM images of Y-PAR loop–axis structure in each mutant at late zygonema. Scale bar: 1 μm.
Fig. 4:
Fig. 4:. PAR-like structural reorganization and DSB formation on autosomal mo-2 arrays.
(a) The mo-2 region of chr9 undergoes axis elongation and splitting similar to PARs (SIM image of a wild-type zygotene spermatocyte). Scale bar: 1 μm. (b) ANKRD31 is required for high-level DSB formation in mo-2 regions and XY pairing. Immuno-FISH for RPA2 and mo-2 was used to detect DSBs. Illustration from Extended Data Fig. 7c. (c) PAR-like DSB formation near autosomal mo-2 regions. Excerpt from Extended Data Fig. 8a. SSDS coverage, is shown for the Y PAR (left) and the mo-2-adjacent region of chr9 (right). Positions of mo-2 repeats are shown below. (d) Early pachytene XY oocyte showing bright RPA2 focus in the PAR. Scale bar: 2 μm.

Comment in

References

    1. Raudsepp T & Chowdhary BP The eutherian pseudoautosomal region. Cytogenet Genome Res 147, 81–94 (2015). - PubMed
    1. Kauppi L et al. Distinct properties of the XY pseudoautosomal region crucial for male meiosis. Science 331, 916–920 (2011). - PMC - PubMed
    1. Perry J, Palmer S, Gabriel A & Ashworth A A short pseudoautosomal region in laboratory mice. Genome Res 11, 1826–1832 (2001). - PMC - PubMed
    1. Raudsepp T, Das PJ, Avila F & Chowdhary BP The pseudoautosomal region and sex chromosome aneuploidies in domestic species. Sex Dev 6, 72–83 (2012). - PubMed
    1. Palmer S, Perry J, Kipling D & Ashworth A A gene spans the pseudoautosomal boundary in mice. Proc Natl Acad Sci U S A 94, 12030–12035 (1997). - PMC - PubMed

Publication types

MeSH terms

LinkOut - more resources