. 2020 Jul;583(7814):122-126.
doi: 10.1038/s41586-020-2337-2. Epub 2020 May 27.

Hepatic NADH reductive stress underlies common variation in metabolic traits

Affiliations

Hepatic NADH reductive stress underlies common variation in metabolic traits

Russell P Goodman et al. Nature. 2020 Jul.

Abstract

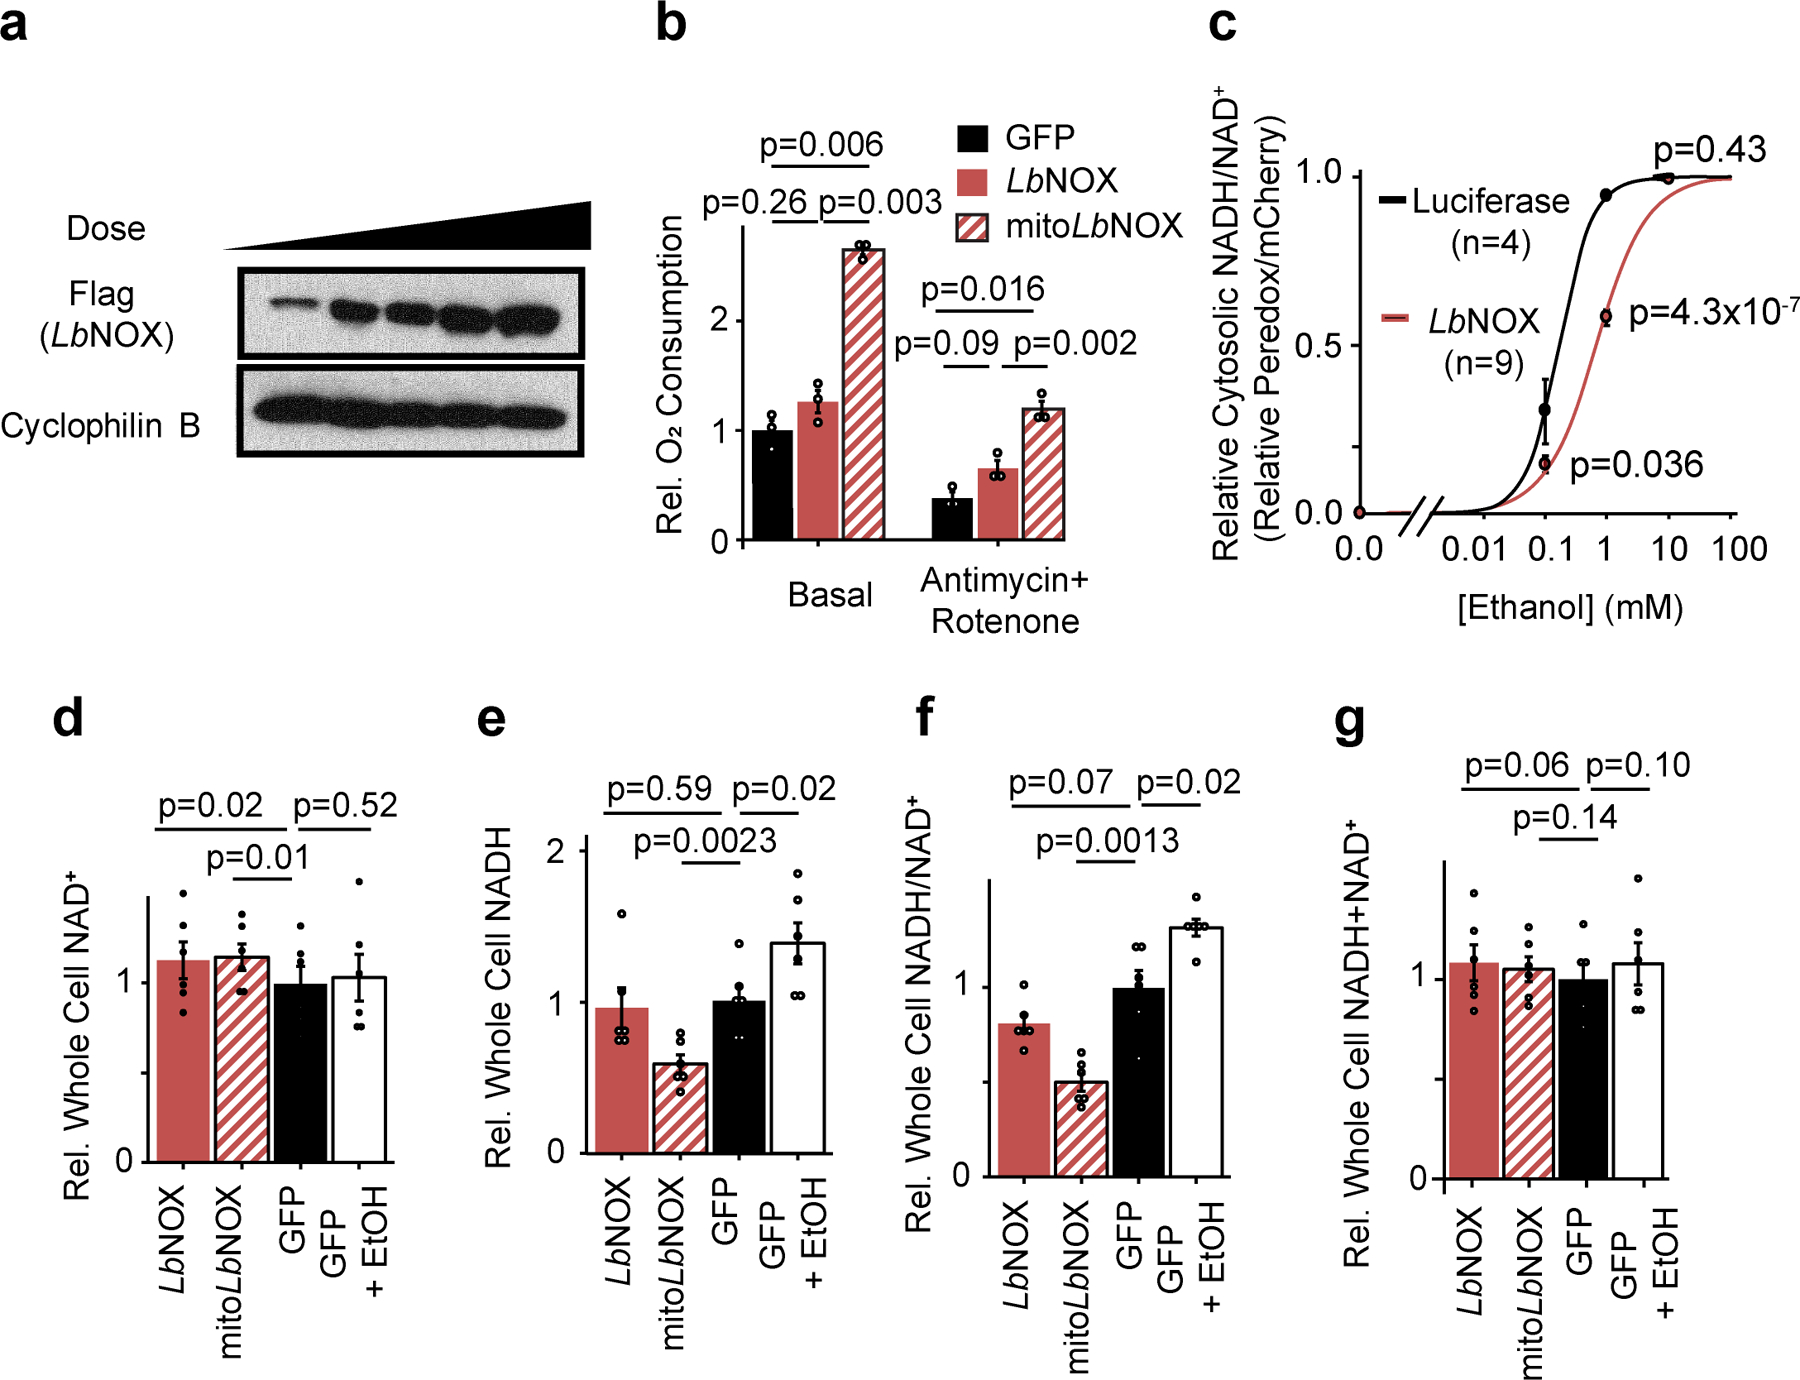
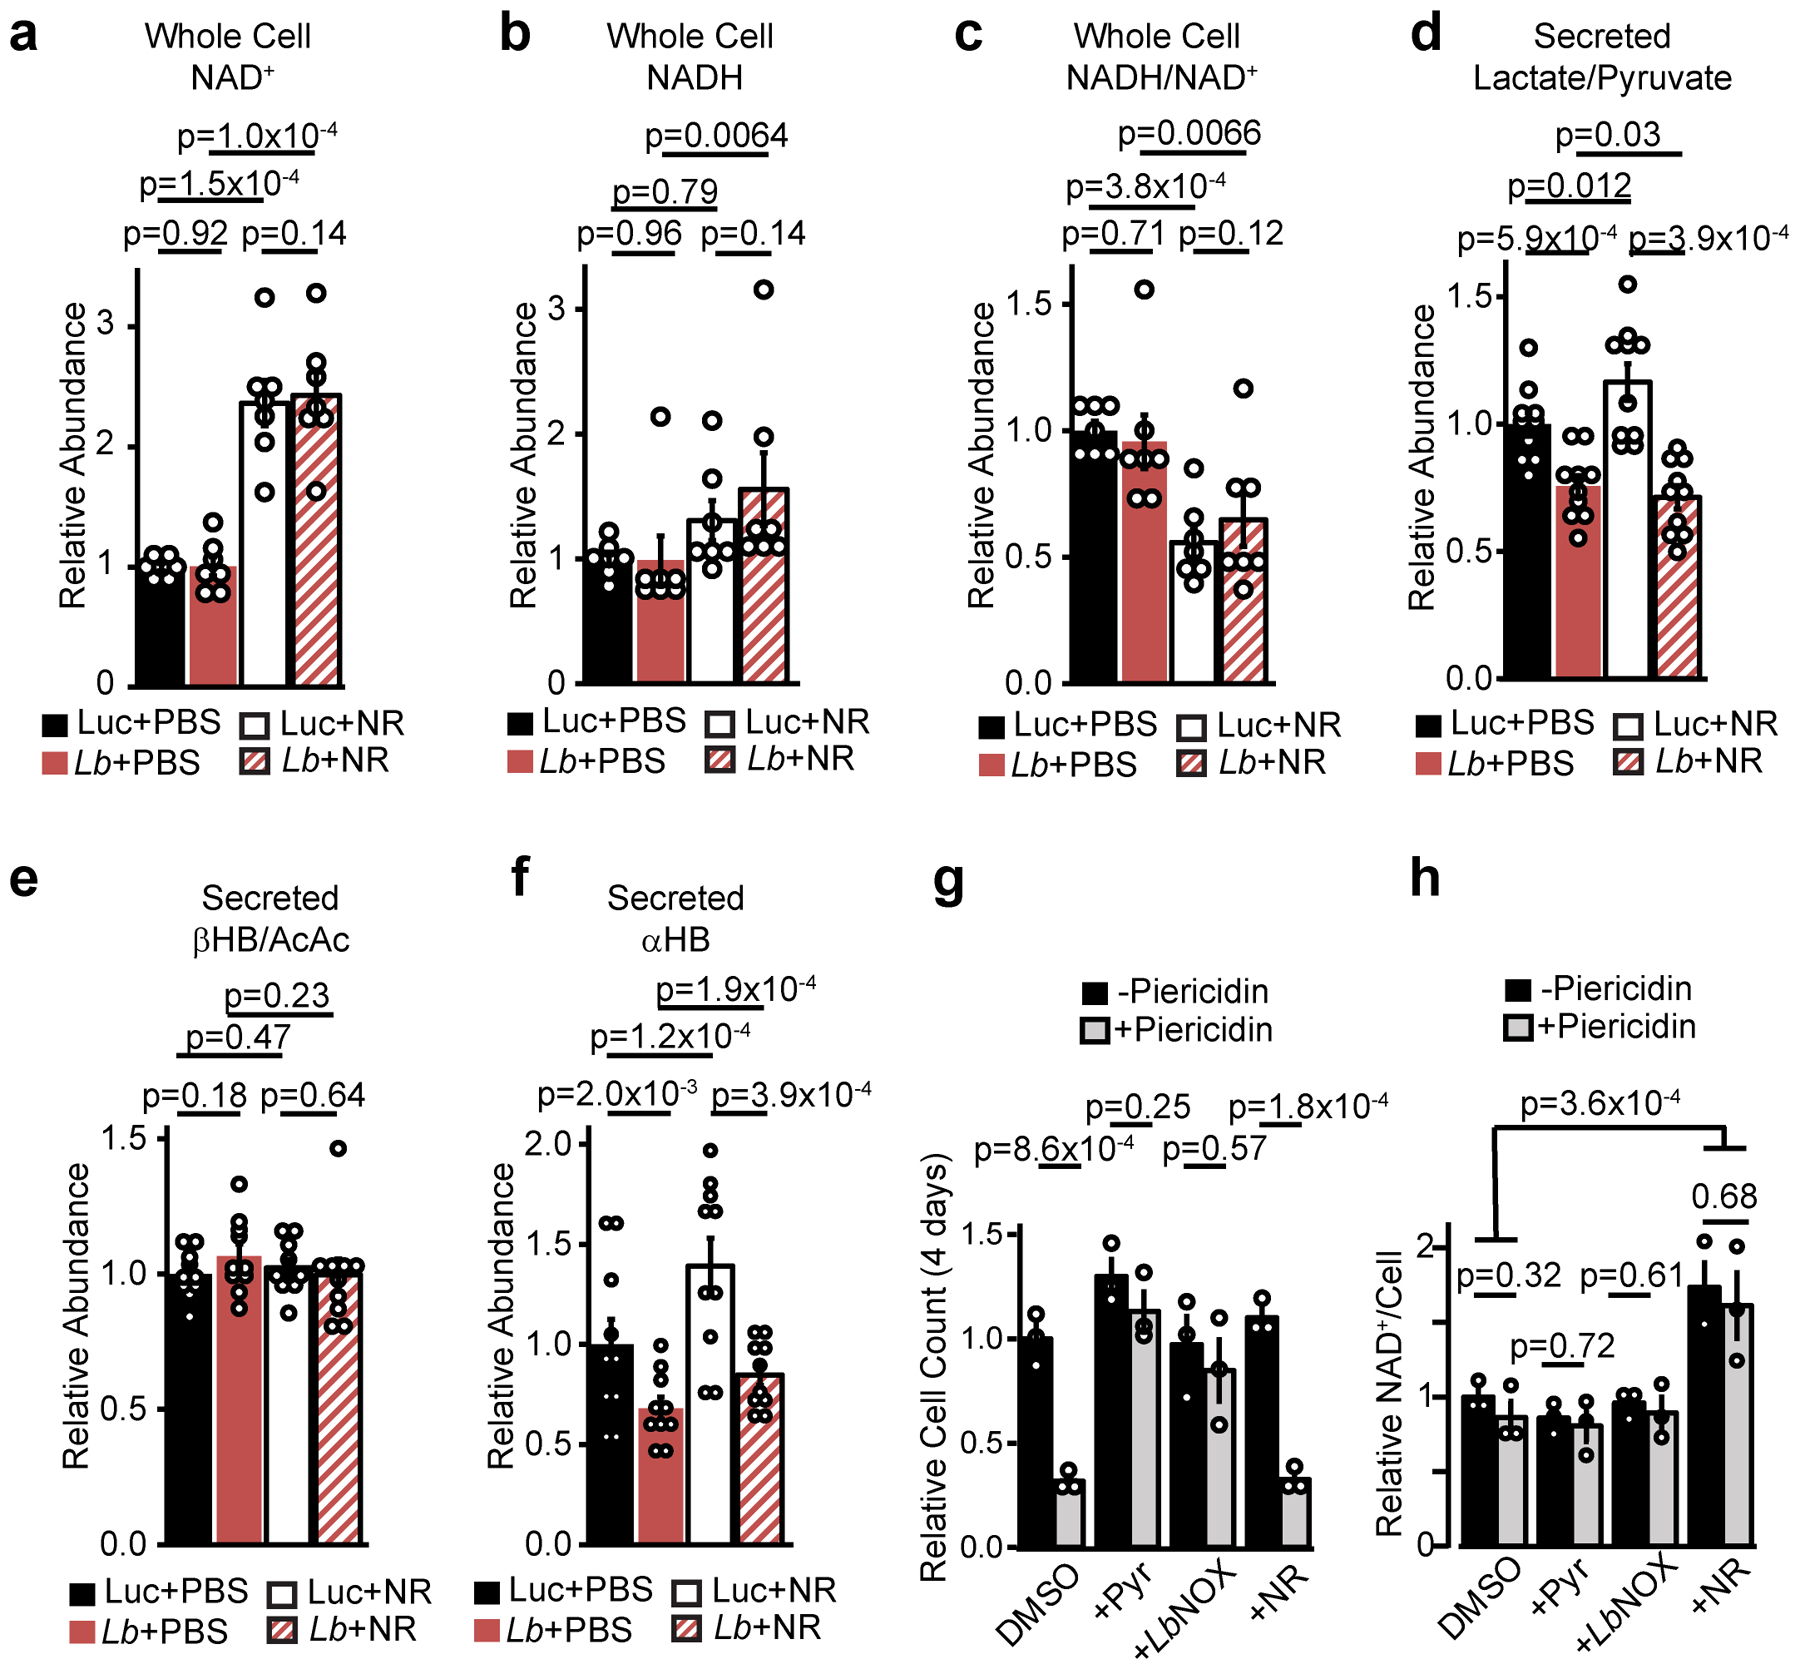
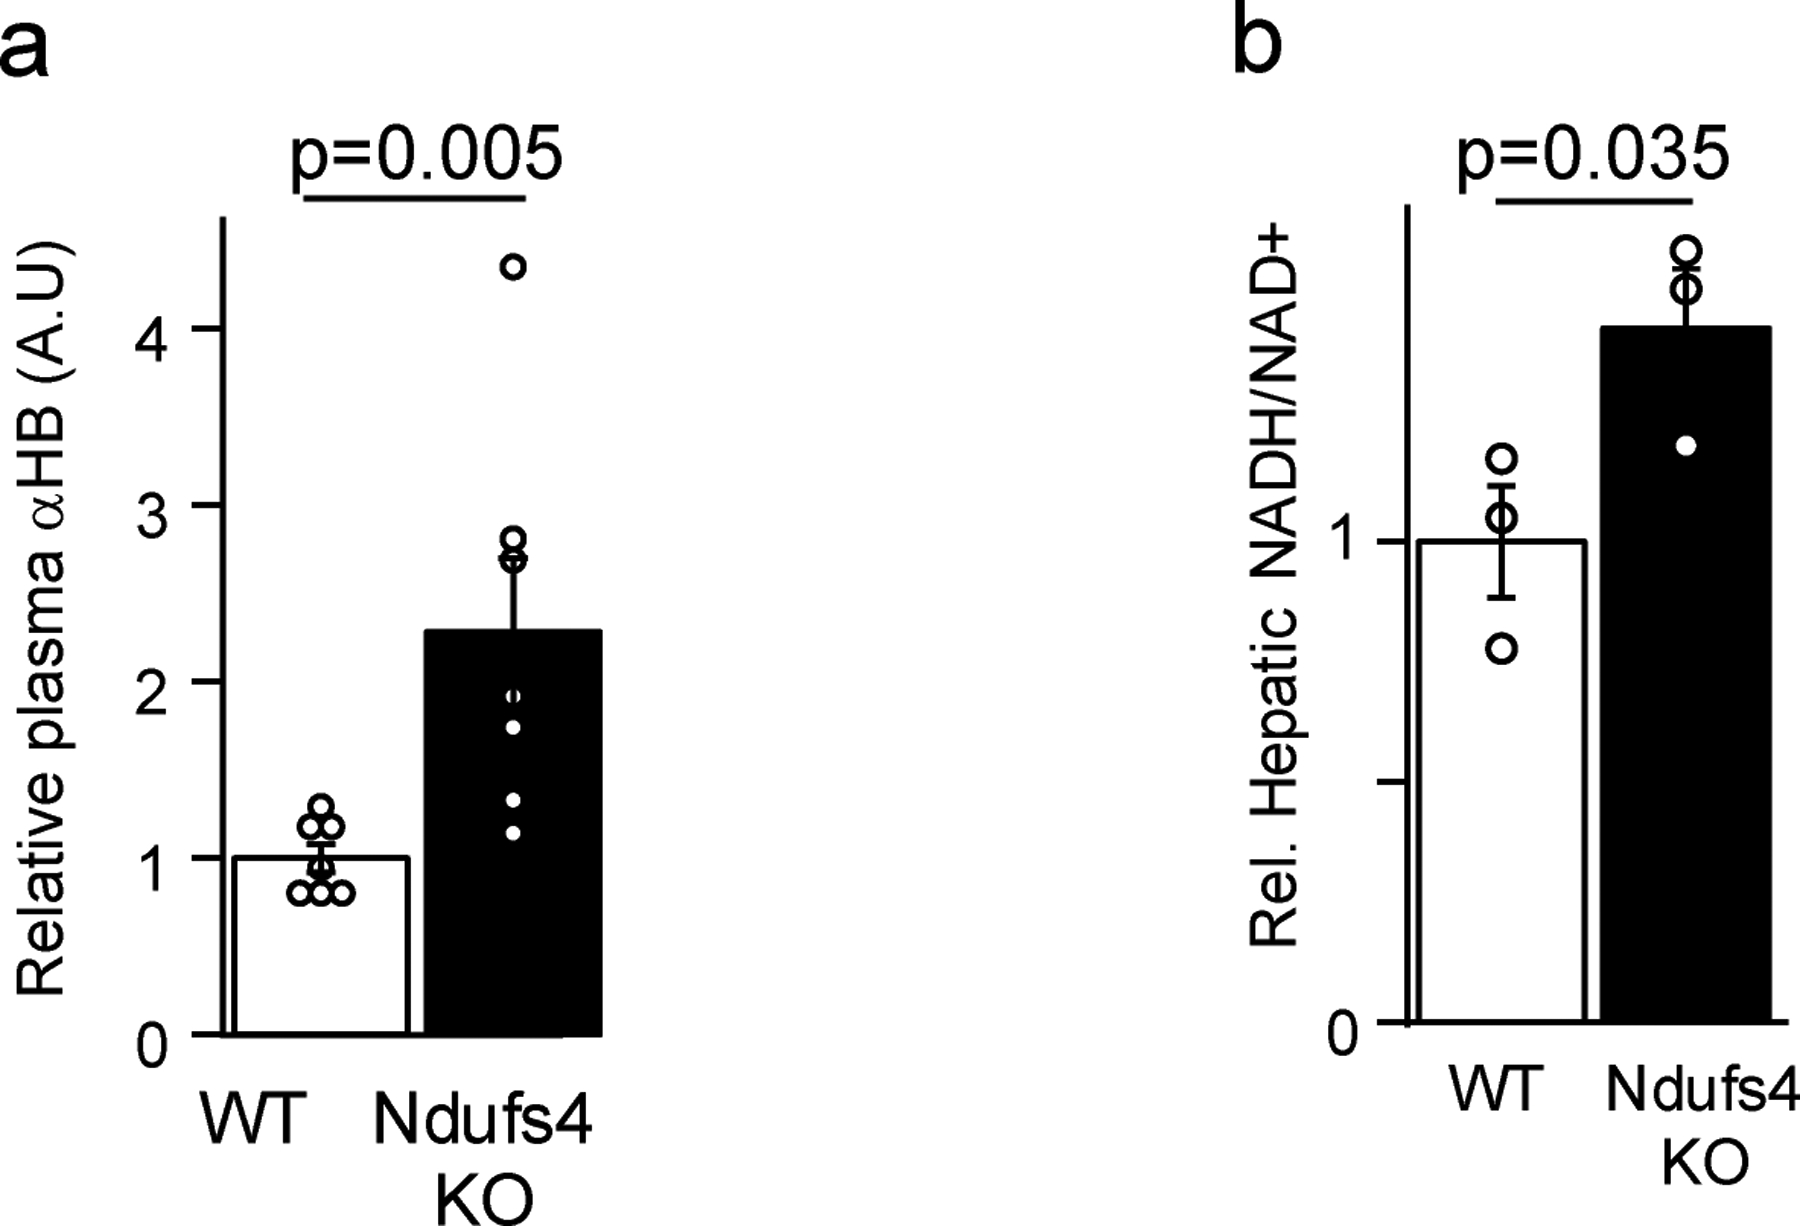
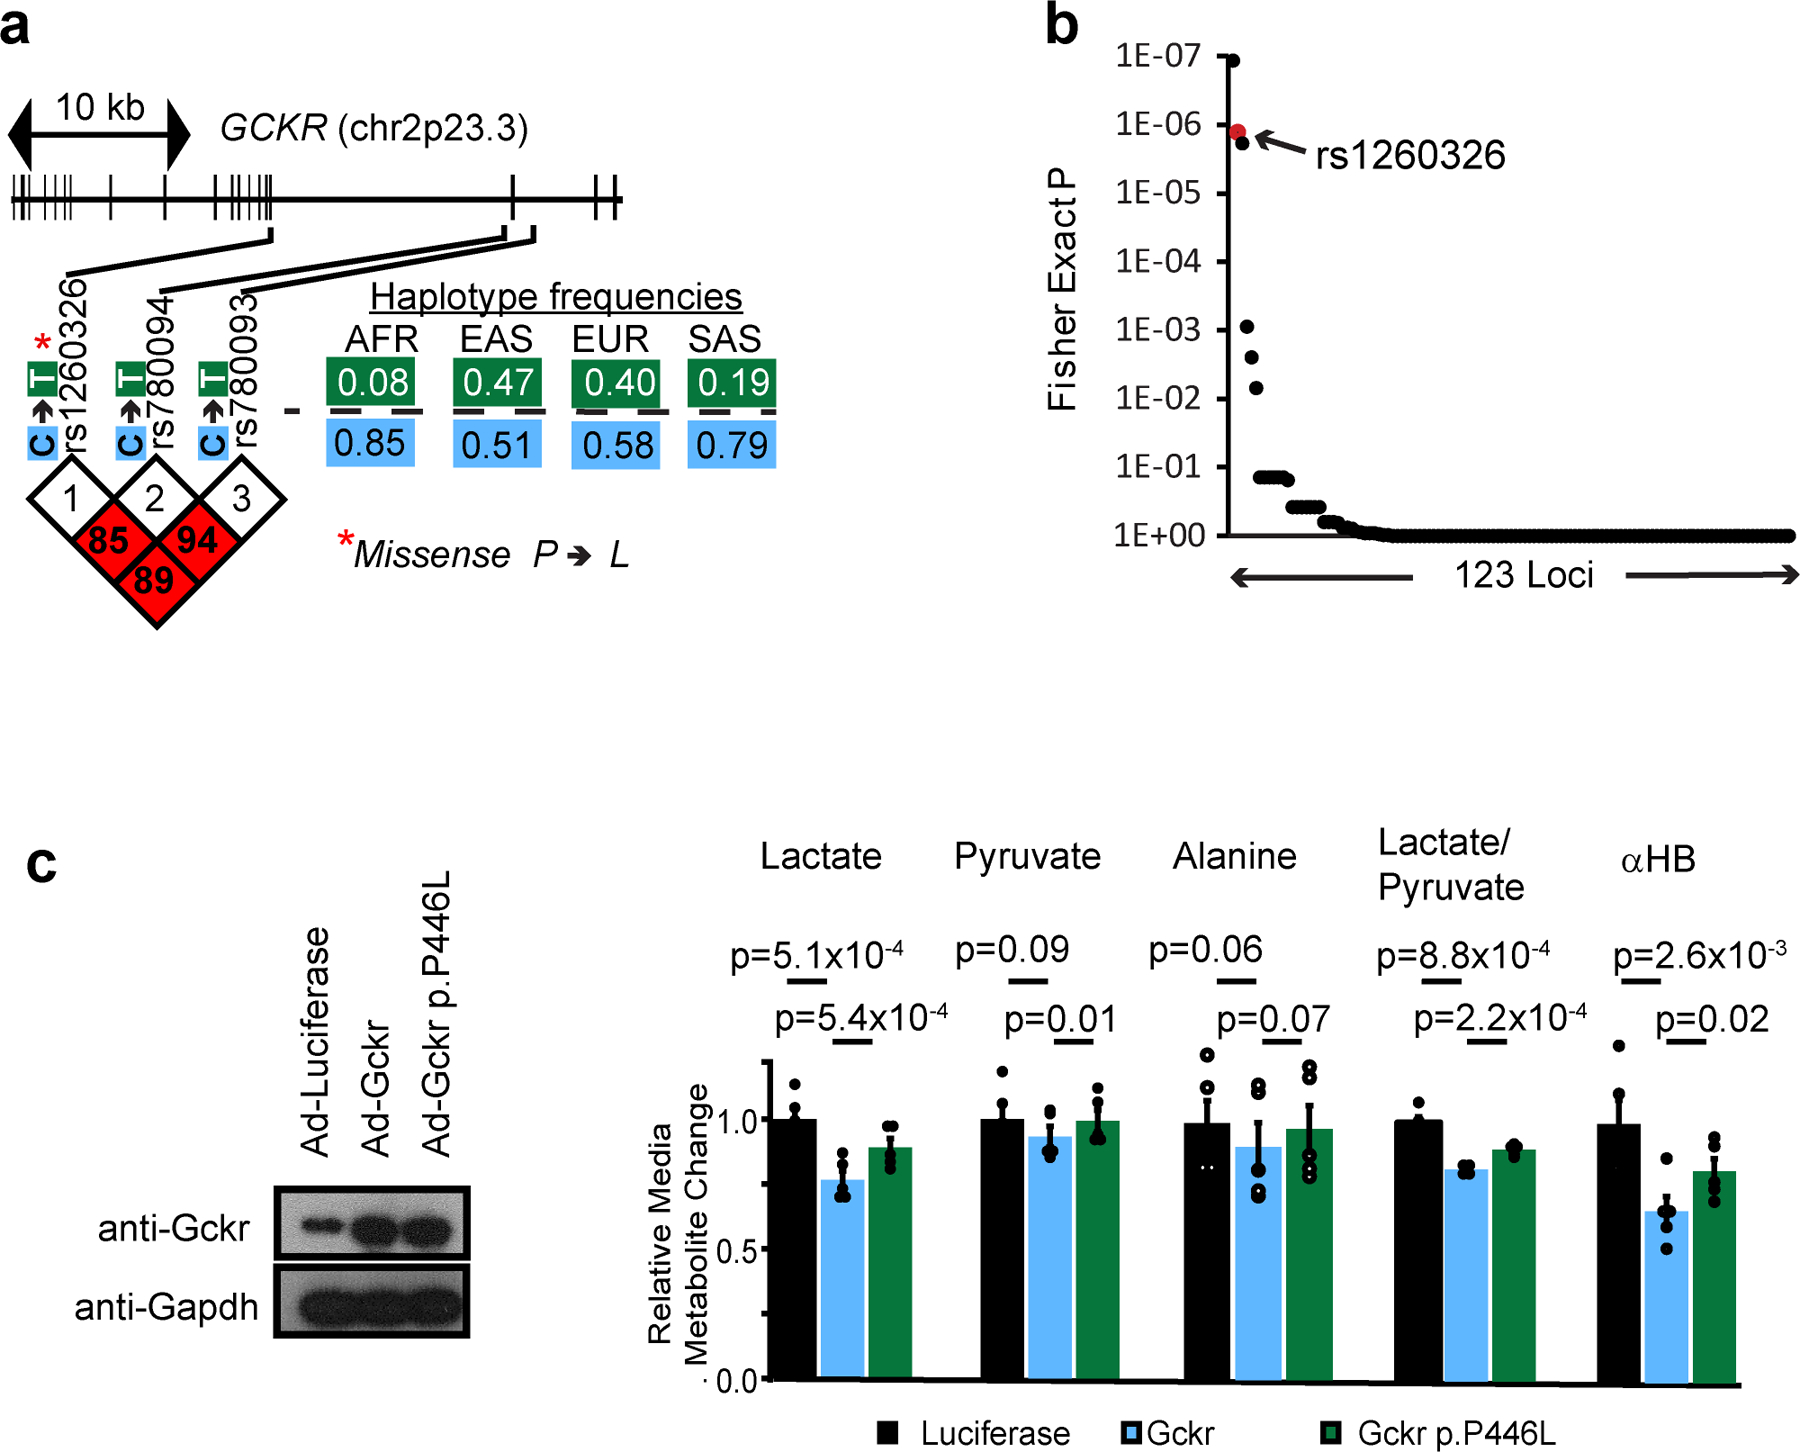
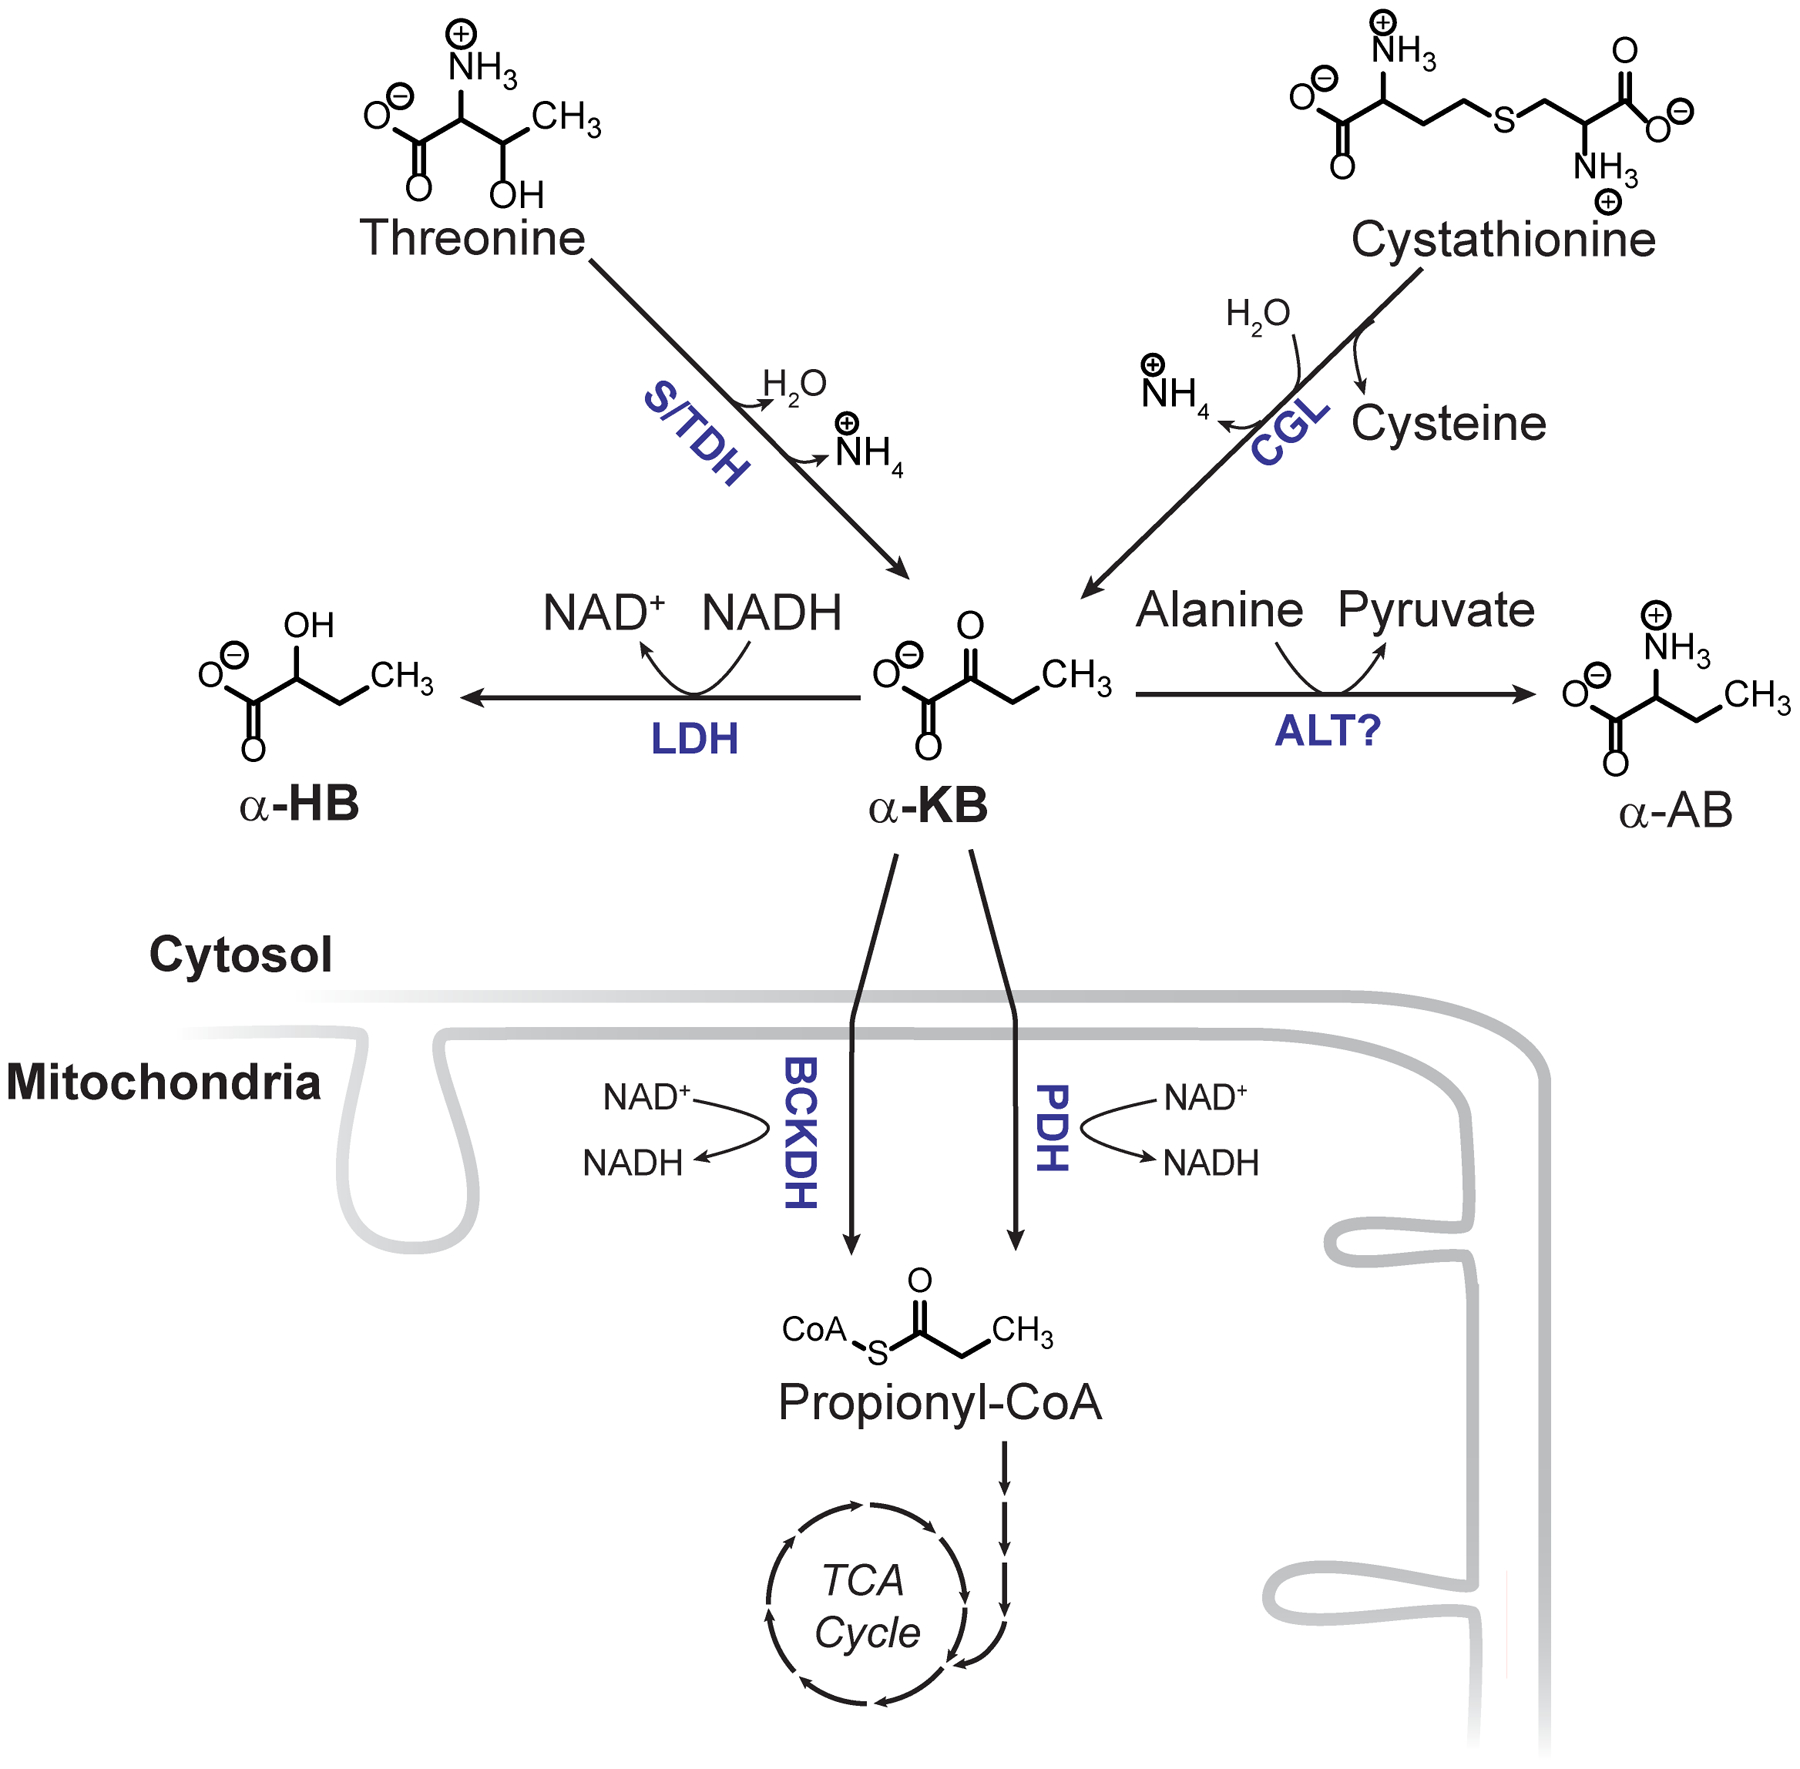
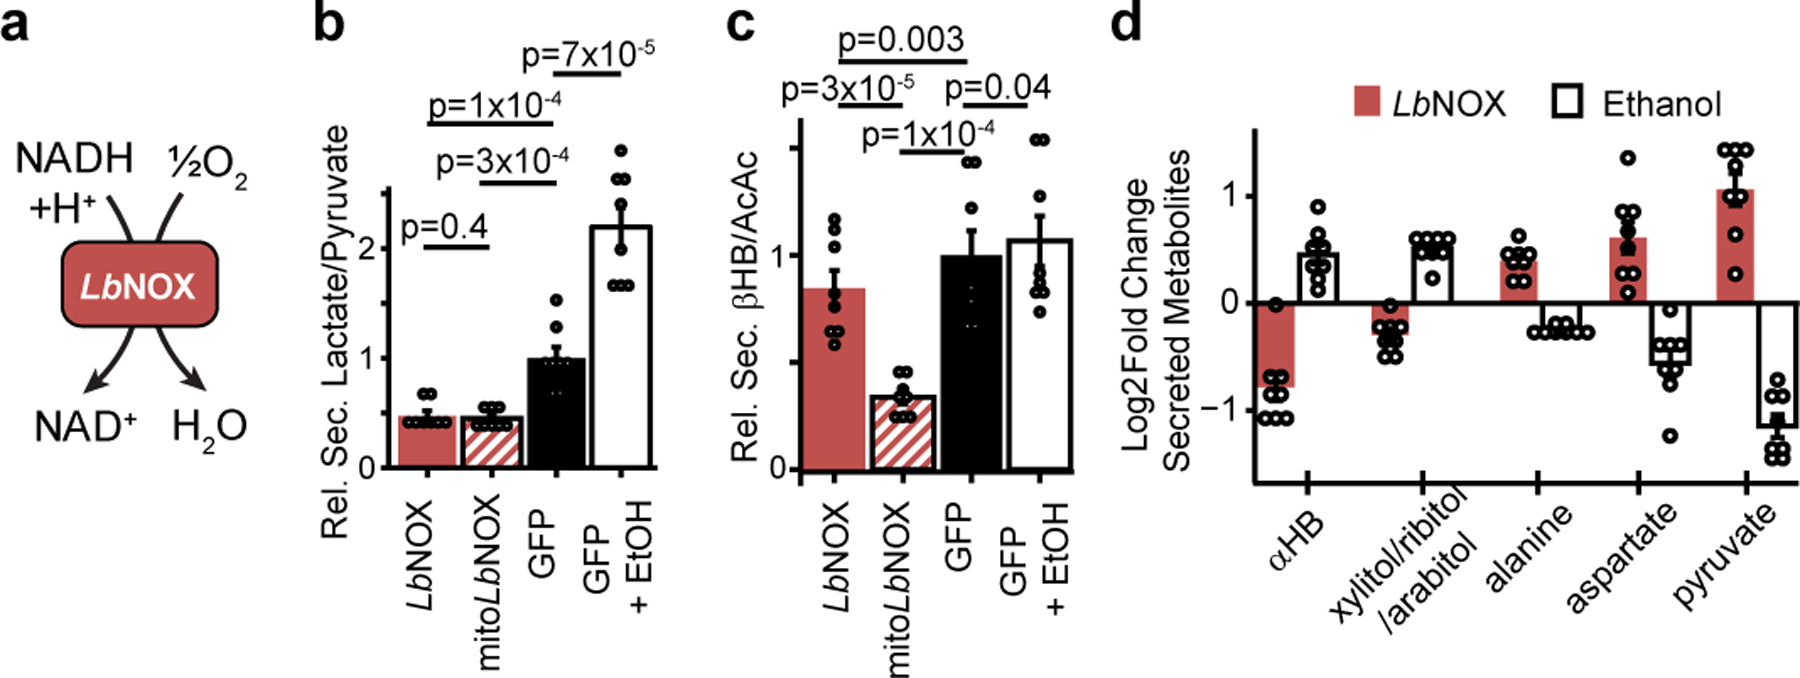
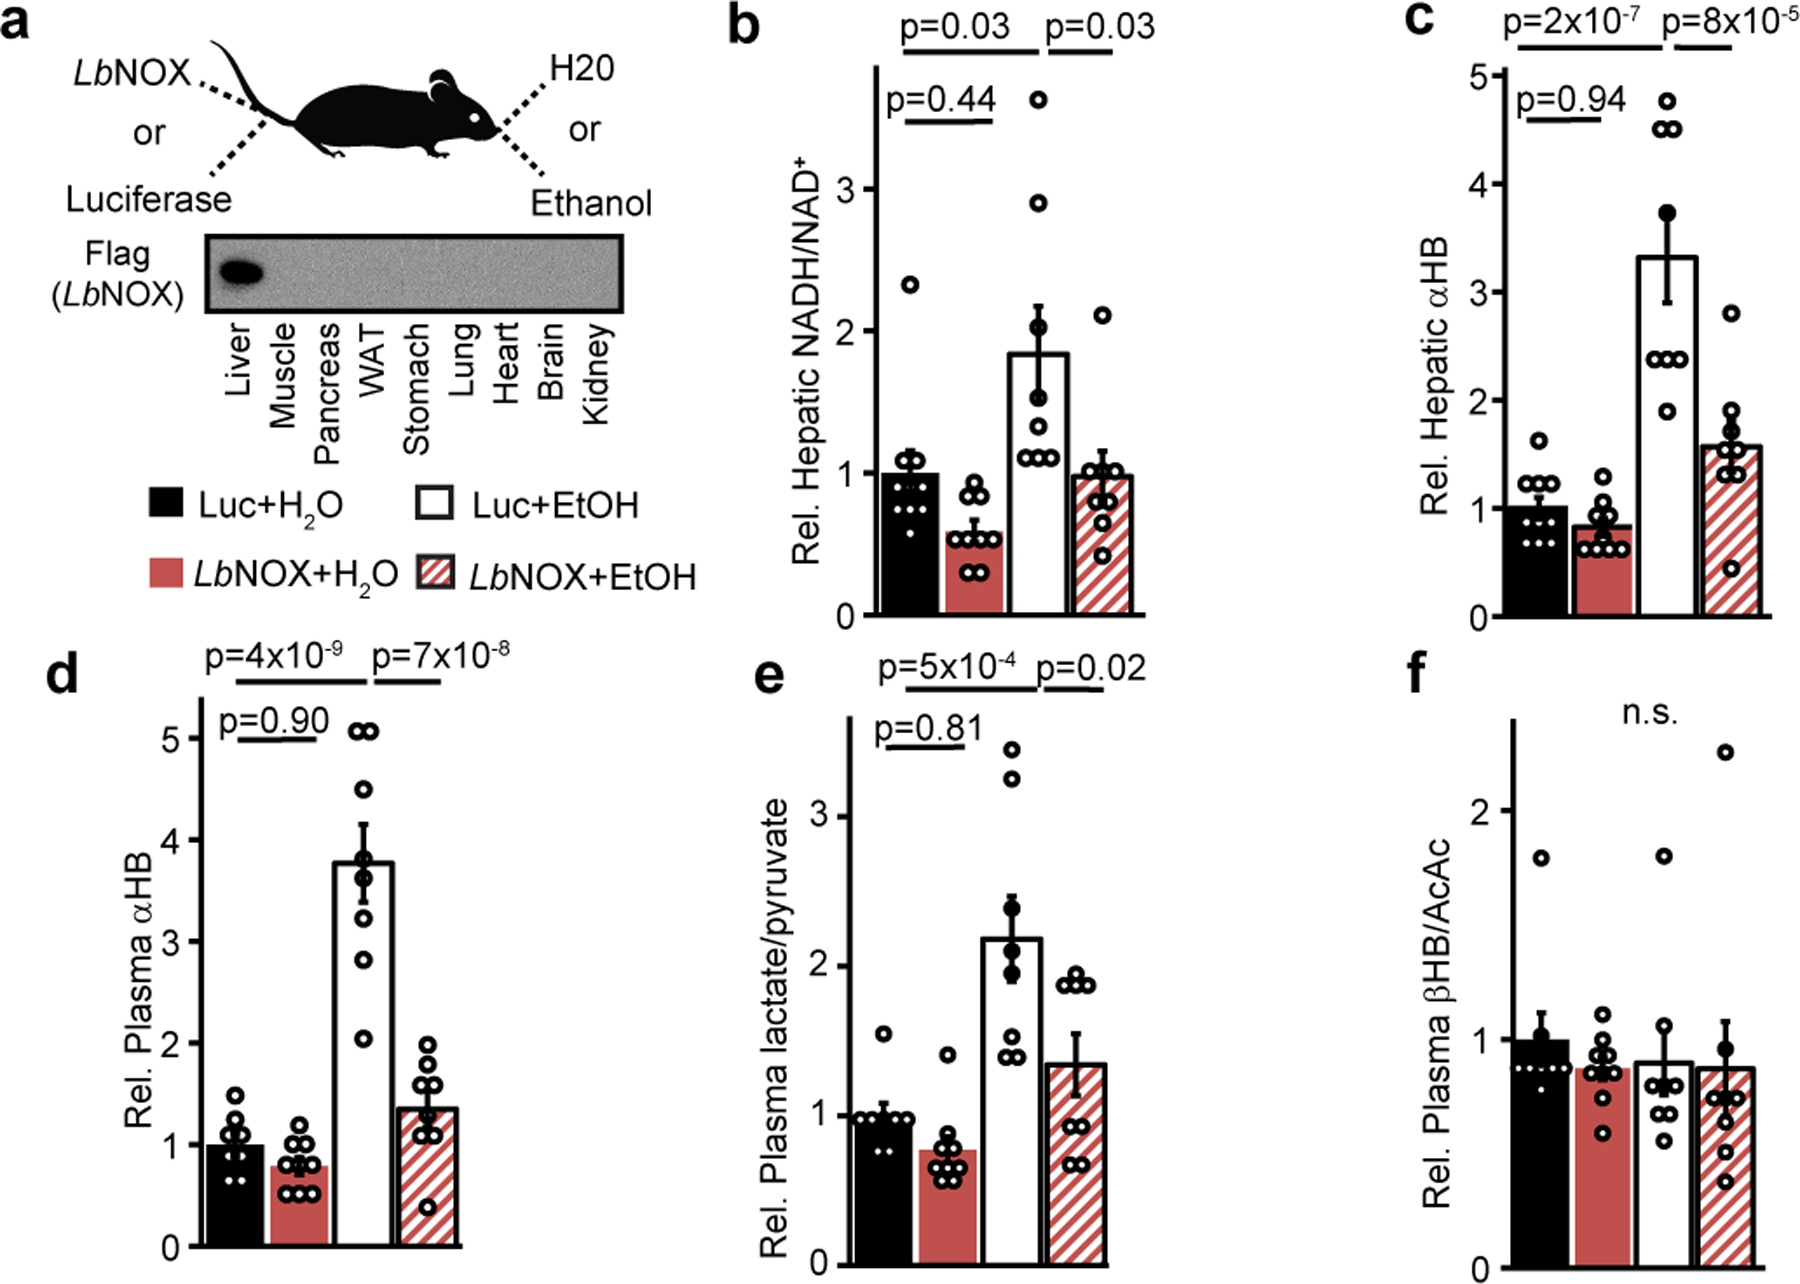
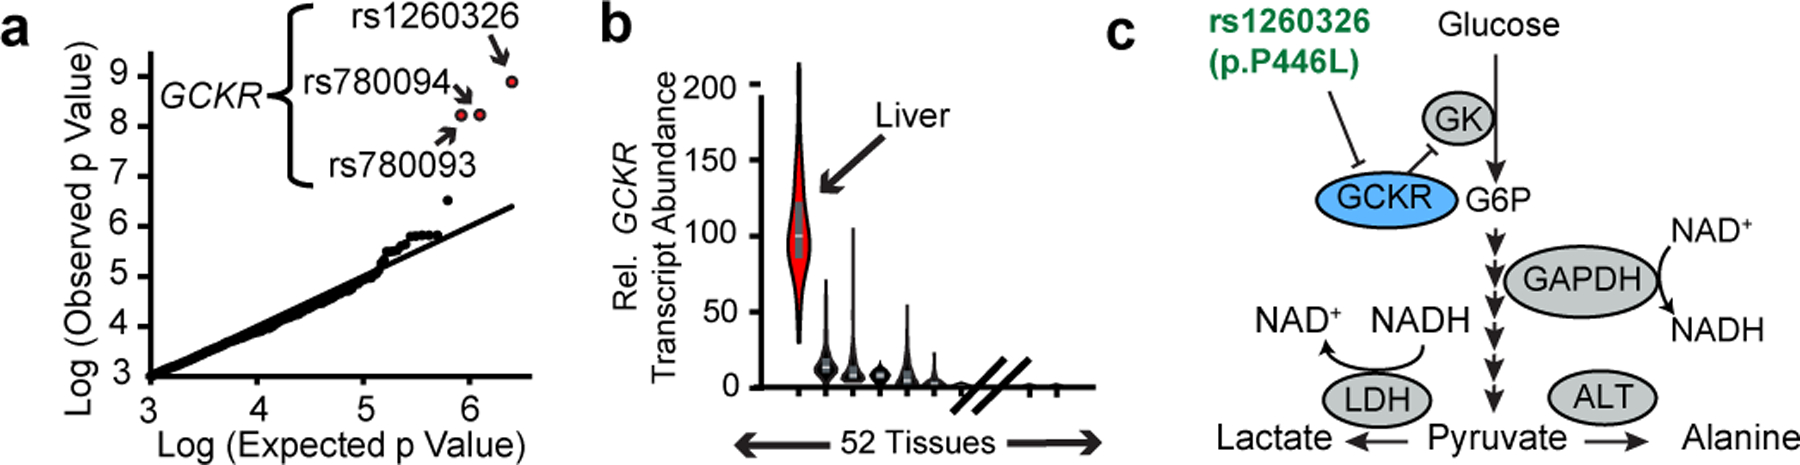
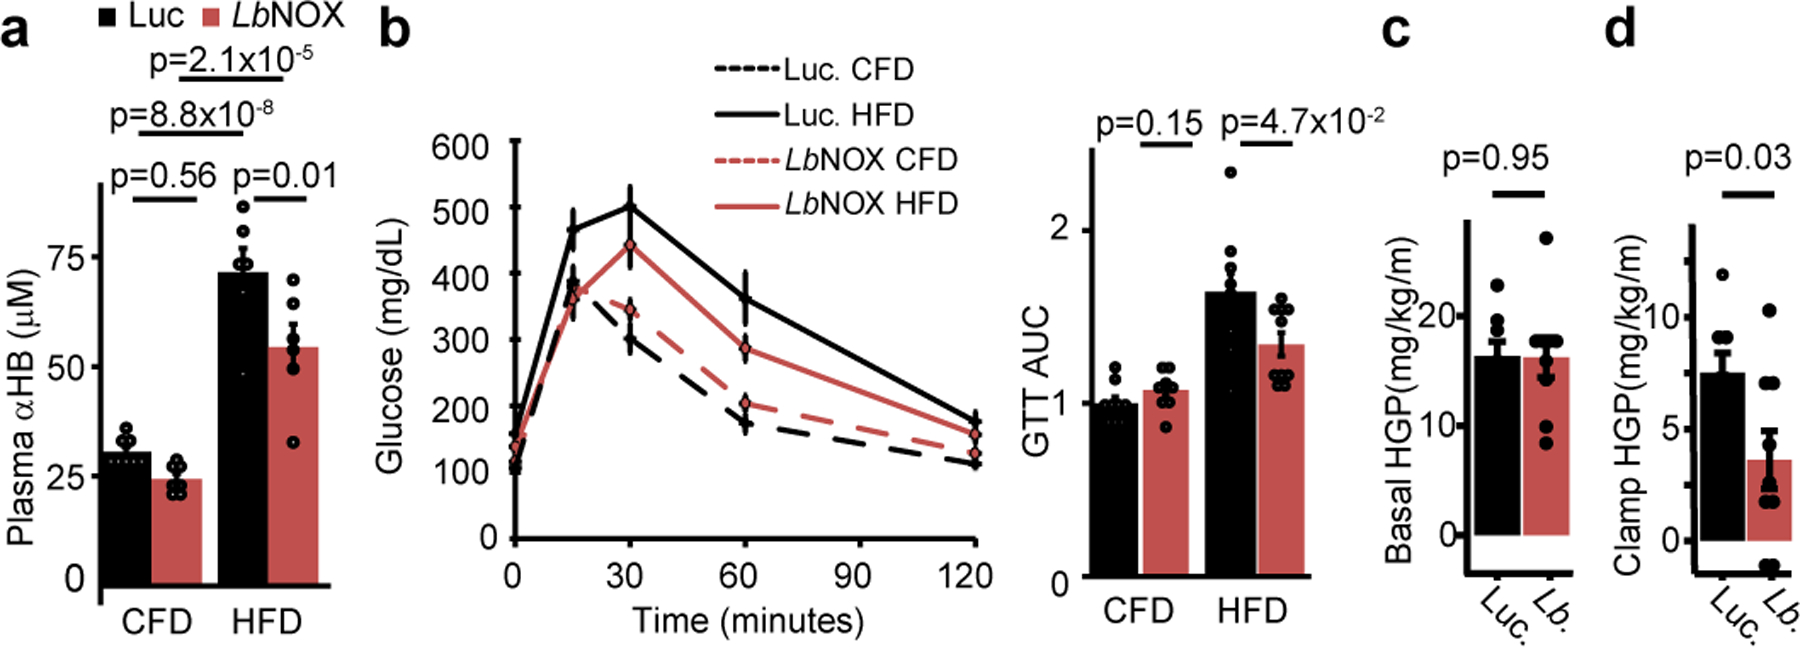
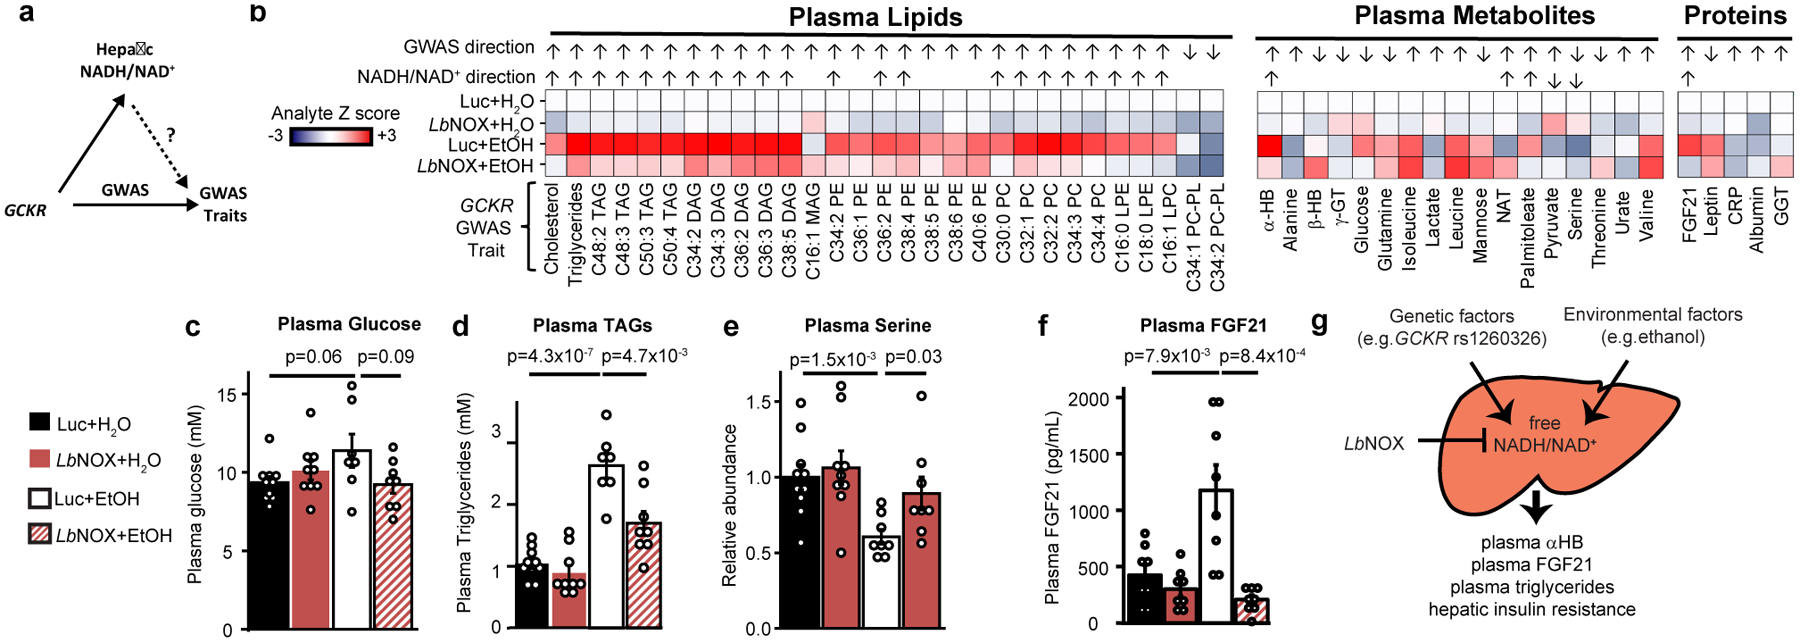
The cellular NADH/NAD+ ratio is fundamental to biochemistry, but the extent to which it reflects versus drives metabolic physiology in vivo is poorly understood. Here we report the in vivo application of Lactobacillus brevis (Lb)NOX1, a bacterial water-forming NADH oxidase, to assess the metabolic consequences of directly lowering the hepatic cytosolic NADH/NAD+ ratio in mice. By combining this genetic tool with metabolomics, we identify circulating α-hydroxybutyrate levels as a robust marker of an elevated hepatic cytosolic NADH/NAD+ ratio, also known as reductive stress. In humans, elevations in circulating α-hydroxybutyrate levels have previously been associated with impaired glucose tolerance2, insulin resistance3 and mitochondrial disease4, and are associated with a common genetic variant in GCKR5, which has previously been associated with many seemingly disparate metabolic traits. Using LbNOX, we demonstrate that NADH reductive stress mediates the effects of GCKR variation on many metabolic traits, including circulating triglyceride levels, glucose tolerance and FGF21 levels. Our work identifies an elevated hepatic NADH/NAD+ ratio as a latent metabolic parameter that is shaped by human genetic variation and contributes causally to key metabolic traits and diseases. Moreover, it underscores the utility of genetic tools such as LbNOX to empower studies of 'causal metabolism'.


Conflict of interest statement

Competing Financial Interests: V.K.M. is an inventor on a patent PCT/US2016/045015 filed by Massachusetts General Hospital on the use of the LbNOX technology as protein prosthesis for mitochondrial diseases or conditions. V.K.M. and R.P.G are inventors on a patent provisionally filed by Massachusetts General Hospital on modulating hepatic reductive stress with chemicals.

Figures

Extended data 1 -
Extended data 1 -. The effects of LbNOX expression in primary hepatocytes
(b) Dose-dependent adenovirus-mediated expression of LbNOX in primary hepatocytes at 24 hours. Representative western from two independent experiments (b) Effect of LbNOX on free cytosolic NADH/NAD+ as measured by peredox with increasing alcohol concentrations. (c) Effect on basal or antimycin+rotenone insensitive respiration with LbNOX or mitoLbNOX. n=3. (d) whole cell NAD+; (e) NADH; (f) NADH/NAD+, and (g) NADH+NAD+. n=6 independent hepatocyte isolations. Nominal p values were determined using paired two-sided Student’sT tests between hepatocyte isolations (c-g), or unpaired two-sided Student’s T test for peredox experiments (b).
Extended data 2 -
Extended data 2 -. Nicotinamide riboside and LbNOX have distinct effects on pyridine dinucleotide pool sizes and redox ratios
Relative total cellular (a) NAD+, (b) NADH, (c) NADH/NAD+, secreted (d) lactate/pyruvate, (e) β−hydroxybutyrate/Acetoacetate (βHB/AcAc), and (f) αHB in primary hepatocytes with or without NR supplementation and LbNOX. (g) Effect of pyruvate, LbNOX expression, or NR on the inhibition of Hela cell proliferation and total NAD+ levels (h) by piericidin 4 days after seeding. Data are mean ± s.e.m from n=7 (a-c) or 10 (d-f) independent hepatocyte isolation, or 3 independent Hela cell experiments (g-h). Nominal p values were determined using paired (between hepatocyte isolations, a-f) or unpaired (Hela cells, g-h) two-sided Student’s T tests.
Extended data 3 -
Extended data 3 -. αHB and hepatic NADH/NAD+ are elevated in the Ndufs4 KO mouse model of mitochondrial disease.
(a) Plasma αHB, (b) hepatic NADH/NAD+. n = 3 mice each group for NADH/NAD+ measurements, 7 mice for αHB measurements. Data are mean ± s.e.m. p values were determined using one-sided Student’s T test.
Extended data 4 -
Extended data 4 -. A common GCKR variant increases hepatic cytosolic NADH reductive stress
(a) Gene structure, variant location, variant LD blocks, and haplotype frequency for risk haplotype of GCKR from the 1000 Genomes Project. AFR, Africa; EAS, East Asian; EUR, European; SAS, South Asian (b) Enrichment of redox sensitive metabolites in reported metabolite associations by loci from Rhee et al 2013. p values were determined from one-tailed Fisher’s exact test as described in Methods. (c) Effects of overexpression of Gckr or Gckr p.P446L in mouse primary hepatocytes. Data are mean ± s.e.m. Nominal p values were determined using paired two-sided Student’s T tests between n=5 independent hepatocyte isolations.
Extended data 5 -
Extended data 5 -. Effects of LbNOX expression on metabolic parameters during hyperinsulinemic-euglycemic clamp
Effects of LbNOX expression in HFD-fed mice using a 2.5 mU/min/kg insulin infusion during hyperinsulinemic-euglycemic clamp on (a) body weight, (b) basal glucose, (c) clamp glucose levels, (d) glucose infusion rate, (e) whole body glucose turnover, (f) whole body glycolysis, (g) whole body glycogen synthesis, (h) lean mass, (i) fat mass, (j) white adipose tissue (WAT) glucose uptake, and (k) skeletal muscle glucose uptake. p values were determined using two-sided Student’s T test. Data are reported as mean±SEM from n=8 (luciferase) or n=9 (LbNOX) mice.
Extended data 6 -
Extended data 6 -. Hepatic diacylglycerols and ceramides in DIO mice with LbNOX expression
Effect of LbNOX expression of hepatic diacylglycerol and ceramide content in DIO mice. Data are reported as mean±SEM from n=9 mice. p values were determined using two-sided Student’s T test.
Extended data 7 -
Extended data 7 -. LbNOX improves hepatic insulin resistance in vivo independent of hepatic insulin signaling
(a) Western blots of liver lysate from DIO mice 15 minutes after an i.p. injection of saline or 2 U/kg insulin with relative pS474 Akt/total Akt (b) and pT308 Akt/total Akt (c), n=3 from representative western from two independent experiments. (d) Transcriptional Foxo1 targets G6pc, Pepck1, and PC in DIO mice with LbNOX or luciferase, n=6. (e) Western blots of liver lysates at the end of hyperinsulinemic-eugylcemic clamps, n=3 representative of n=8 (Luciferase) and 9 (LbNOX) with (f) relative pS474 Akt/total Akt and pT308 Akt/total Akt (g) transcriptional Foxo1 targets G6pc, Pepck1, and Pc. n=8 (Luciferase), 9 (LbNOX). (h) Crossover analysis of relative abundance of gluconeogenic intermediates at end of hyperinsulinemic-euglycemic clamps. In the top panel, LbNOX vs. luciferase mice are compared. In the bottom panel, samples are divided by high or low liver lactate/pyruvate ratios and compared. (i) Relative protein levels of Gapdh and TPI at the end of the insulin clamp.n=8 (Luciferase), 9 (LbNOX). *, **, = p < 0.05, 0.01, using two-sided Student’s T test. Data are reported as mean±SEM.
Extended data 8 -
Extended data 8 -. NAD(P)(H) levels in LbNOX versus Luciferase livers at end of hyperinsulinemic-euglycemic clamps.
n = 4 mice for each group. p values were determined one-sided Student’s T test. Data are reported as mean ± SEM
Extended data 9 -
Extended data 9 -
Metabolic origins and fate of αHB. LDH = lactate dehydrogenase, S/TDH = serine/threonine dehydratase, CGL = cystathionine gamma lyase, ALT = alanine aminotransferase, BCKDH = branched chain alpha keto acid dehydrogenase complex, PDH = pyruvate dehydrogenase.
Figure 1 -
Figure 1 -. LbNOX alters compartment-specific free NADH/NAD+ ratio in hepatocytes
(a) Chemical reaction catalyzed by LbNOX. (b) Effect of LbNOX, mitoLbNOX or ethanol on primary hepatocyte secreted lactate/pyruvate and (c) secreted β-hydroxybutyrate/acetoacetate. (d) Relative changes in abundance of secreted redox concordant metabolites. Data are mean ± s.e.m from n=8 independent hepatocyte isolations. Nominal p values were determined using paired two-sided Student’s T tests between hepatocyte isolationn
Figure 2 -
Figure 2 -. in vivo manipulation of the hepatic cytosolic NADH/NAD+ ratio alters hepatic and circulating αHB
(a) Experiment outline. Effects of combination of hepatic LbNOX or luciferase expression and alcohol on (b) hepatic NADH/NAD+, (c) hepatic αHB (d) plasma αHB, (e) plasma lactate/pyruvate, (f) plasma βHB/AcAc. Data are mean ± s.e.m from n=8–10 mice per group. p values were determined using one-way ANOVA with post-hoc Tukey’s HSD test. n.s. is p=0.90.
Figure 3 -
Figure 3 -. A common GCKR variant is associated with plasma
αHB in humans (a) Q-Q plot of variants associated with plasma αHB levels, from Rhee et al 20135. (b) Relative distribution of GCKR expression in humans from GTEx (Lonsdale et al. 2012). Box plots show median, 25th and 75th percentile expression. (c) Pathway diagram depicting proposed role of GCKR and its polymorphism.
Figure 4 -
Figure 4 -. Direct oxidation of free hepatic cytosolic NADH improves glucose tolerance and hepatic insulin sensitivity in vivo
Effects of hepatic LbNOX expression on (a) plasma αHB and (b) glucose tolerance in chow fed (CFD) or high-fat diet (HFD) mice. Effect of hepatic LbNOX in HFD-fed mice during hyperinsulinemic-euglycemic clamp on (c) basal hepatic glucose production (HGP), (d) clamp hepatic glucose production. p values were determined using unpaired two-sided Student’s T test (b-d), or one-way Anova with post-hoc Tukey’s HSD test (a). Data are mean ± s.e.m from n=6–8 mice for (a), 9–10 for (b), 8–9 total for (c).
Figure 5 -
Figure 5 -. Many GCKR Associated Metabolic Traits Lie Downstream of Hepatic NADH Reductive Stress
(a) GWAS studies have linked many traits to GCKR variation. The current study raises the hypothesis that some of these are mediated by variation in hepatic NADH/NAD+ (b) Shown are 51 such traits that we could measure using the EtOH/LbNOX in vivo system in Figure 3a, with the analyte Z score for each condition relative to Luc+H20, whether the measured analyte fulfilled our criteria fo “NADH/NAD+ sensitivity” (see Material and Methods) and if so its direction, along with the observed direction of effect from the P446L risk haplotype in published studies (Supplementary Table 1). Selected data are shown for (c) plasma glucose, (d) total plasma triglycerides, (e) plasma serine, and (f) plasma FGF21. (g) Proposed model, where circulating αHB is a biomarker of elevated cytosolic free hepatic NADH/NAD+, a latent metabolic parameter that is influenced by genetic and environmental factors and serves as an effector of different metabolic traits. Data are mean ± s.e.m from n=7–10 mice per group. Nominal p values were determined using two-sided Student’s T tests used for “NADH/NAD+” sensitivity calculations. TAG= triacylglycerol; DAG= diacylglycerol; MAG= monoacylglycerol; PE = phosphatidylethanolamine; PC phosphatidylcholine; LPE = lysophosphatidylethanolamine; LPC lysophophatidylcholine; PC-PL phosphatidychloine plasmalogen; γGT γ−glutamylthreonine; GGT gamma-glutamyltransferase; CRP C-reactive protein; NAT N-acetyltrytophan.

References

    1. Titov DV et al. Complementation of mitochondrial electron transport chain by manipulation of the NAD+/NADH ratio. Science 352, 231–235 (2016). - PMC - PubMed
    1. Cobb J et al. α-Hydroxybutyric acid is a selective metabolite biomarker of impaired glucose tolerance. Diabetes Care 39, 988–995 (2016). - PubMed
    1. Gall WE et al. Α-Hydroxybutyrate Is an Early Biomarker of Insulin Resistance and Glucose Intolerance in a Nondiabetic Population. PLoS One 5, e10883 (2010). - PMC - PubMed
    1. Thompson Legault J. et al. A Metabolic Signature of Mitochondrial Dysfunction Revealed through a Monogenic Form of Leigh Syndrome. Cell Rep. 13, 981–989 (2015). - PMC - PubMed
    1. Rhee EP et al. A genome-wide association study of the human metabolome in a community-based cohort. Cell Metab. 18, 130–43 (2013). - PMC - PubMed

Publication types

MeSH terms