

Simulation of organic aerosol formation during the CalNex study: updated mobile emissions and secondary organic aerosol parameterization for intermediate-volatility organic compounds
- PMID: 32461753
- PMCID: PMC7252505
- DOI: 10.5194/acp-20-4313-2020
Simulation of organic aerosol formation during the CalNex study: updated mobile emissions and secondary organic aerosol parameterization for intermediate-volatility organic compounds
Abstract
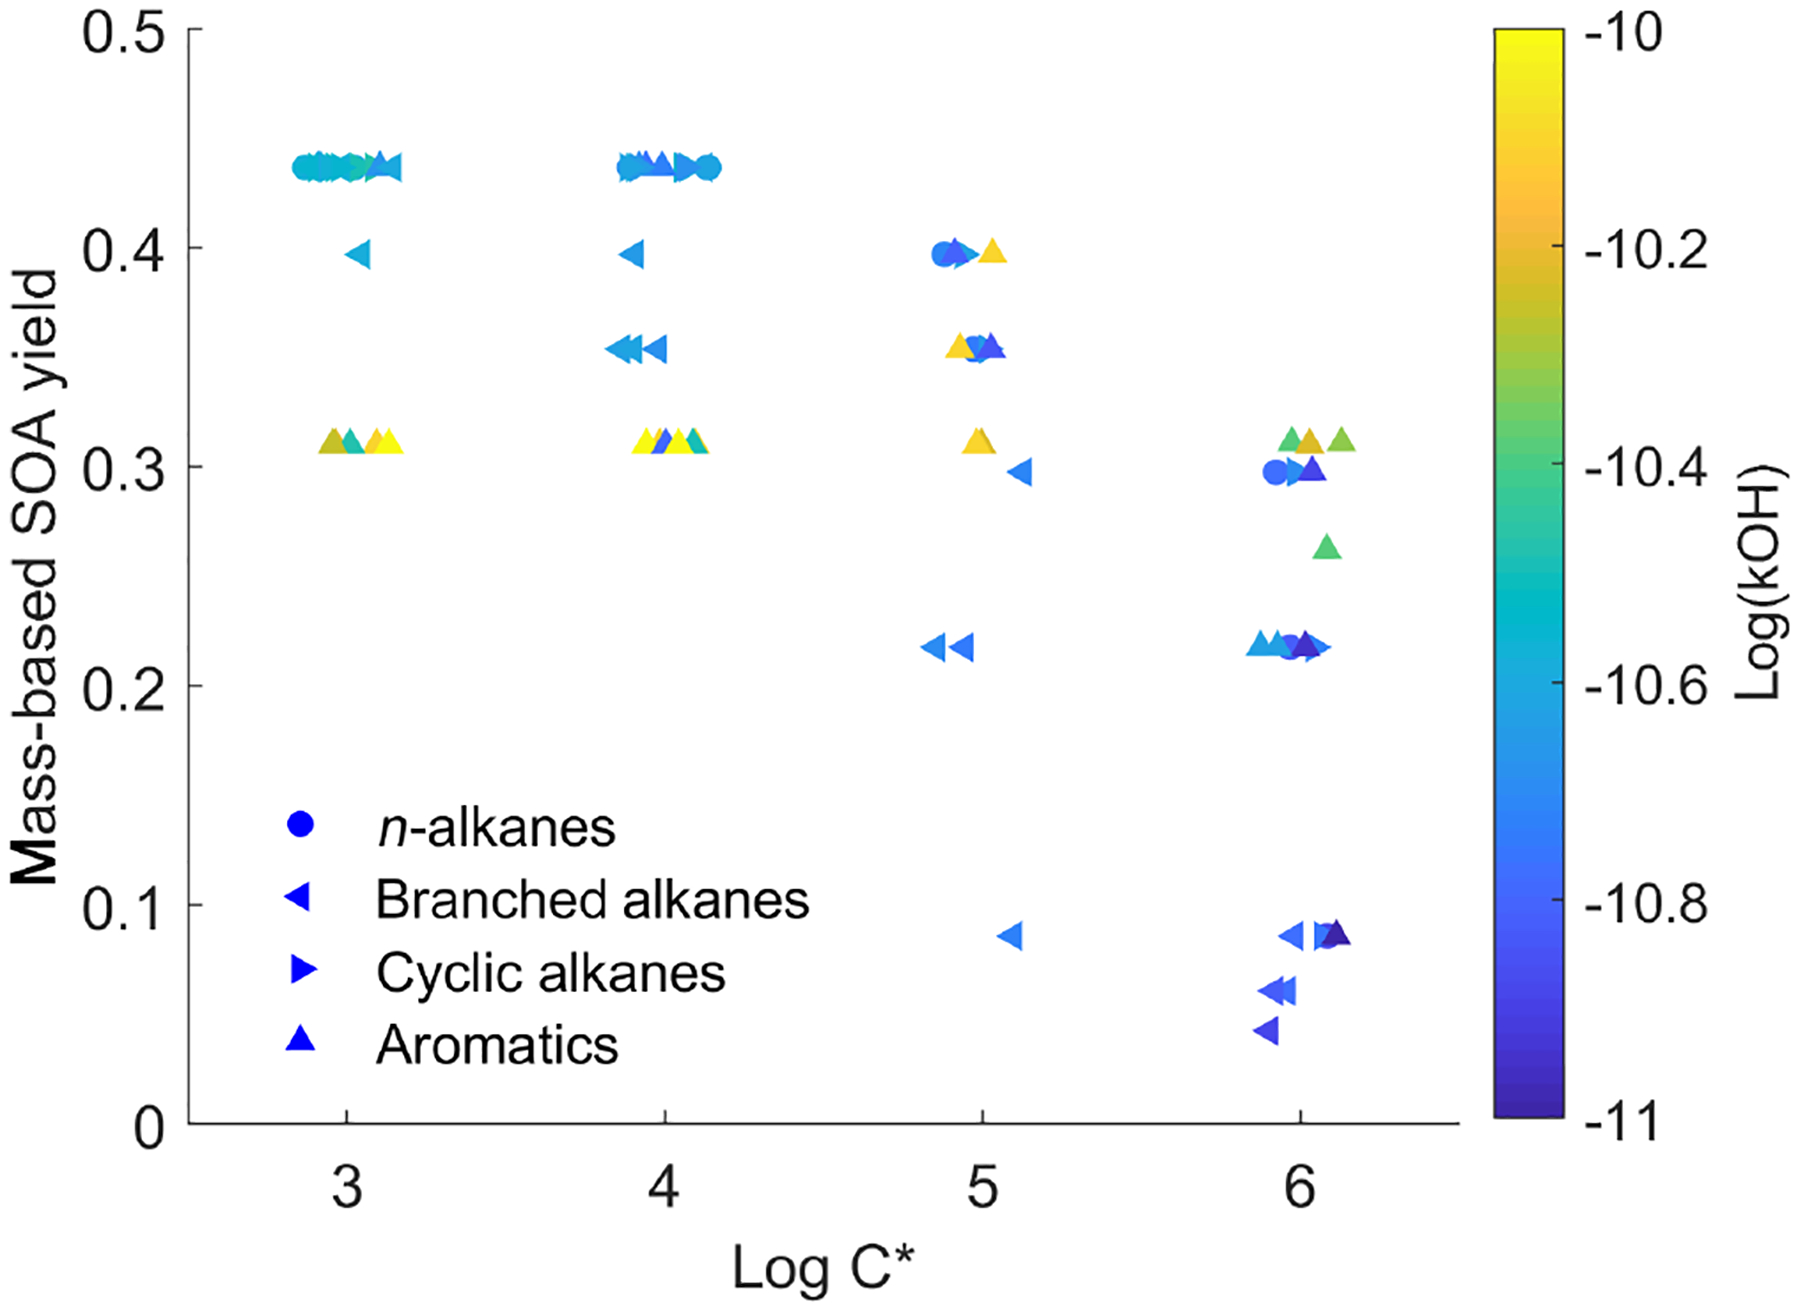
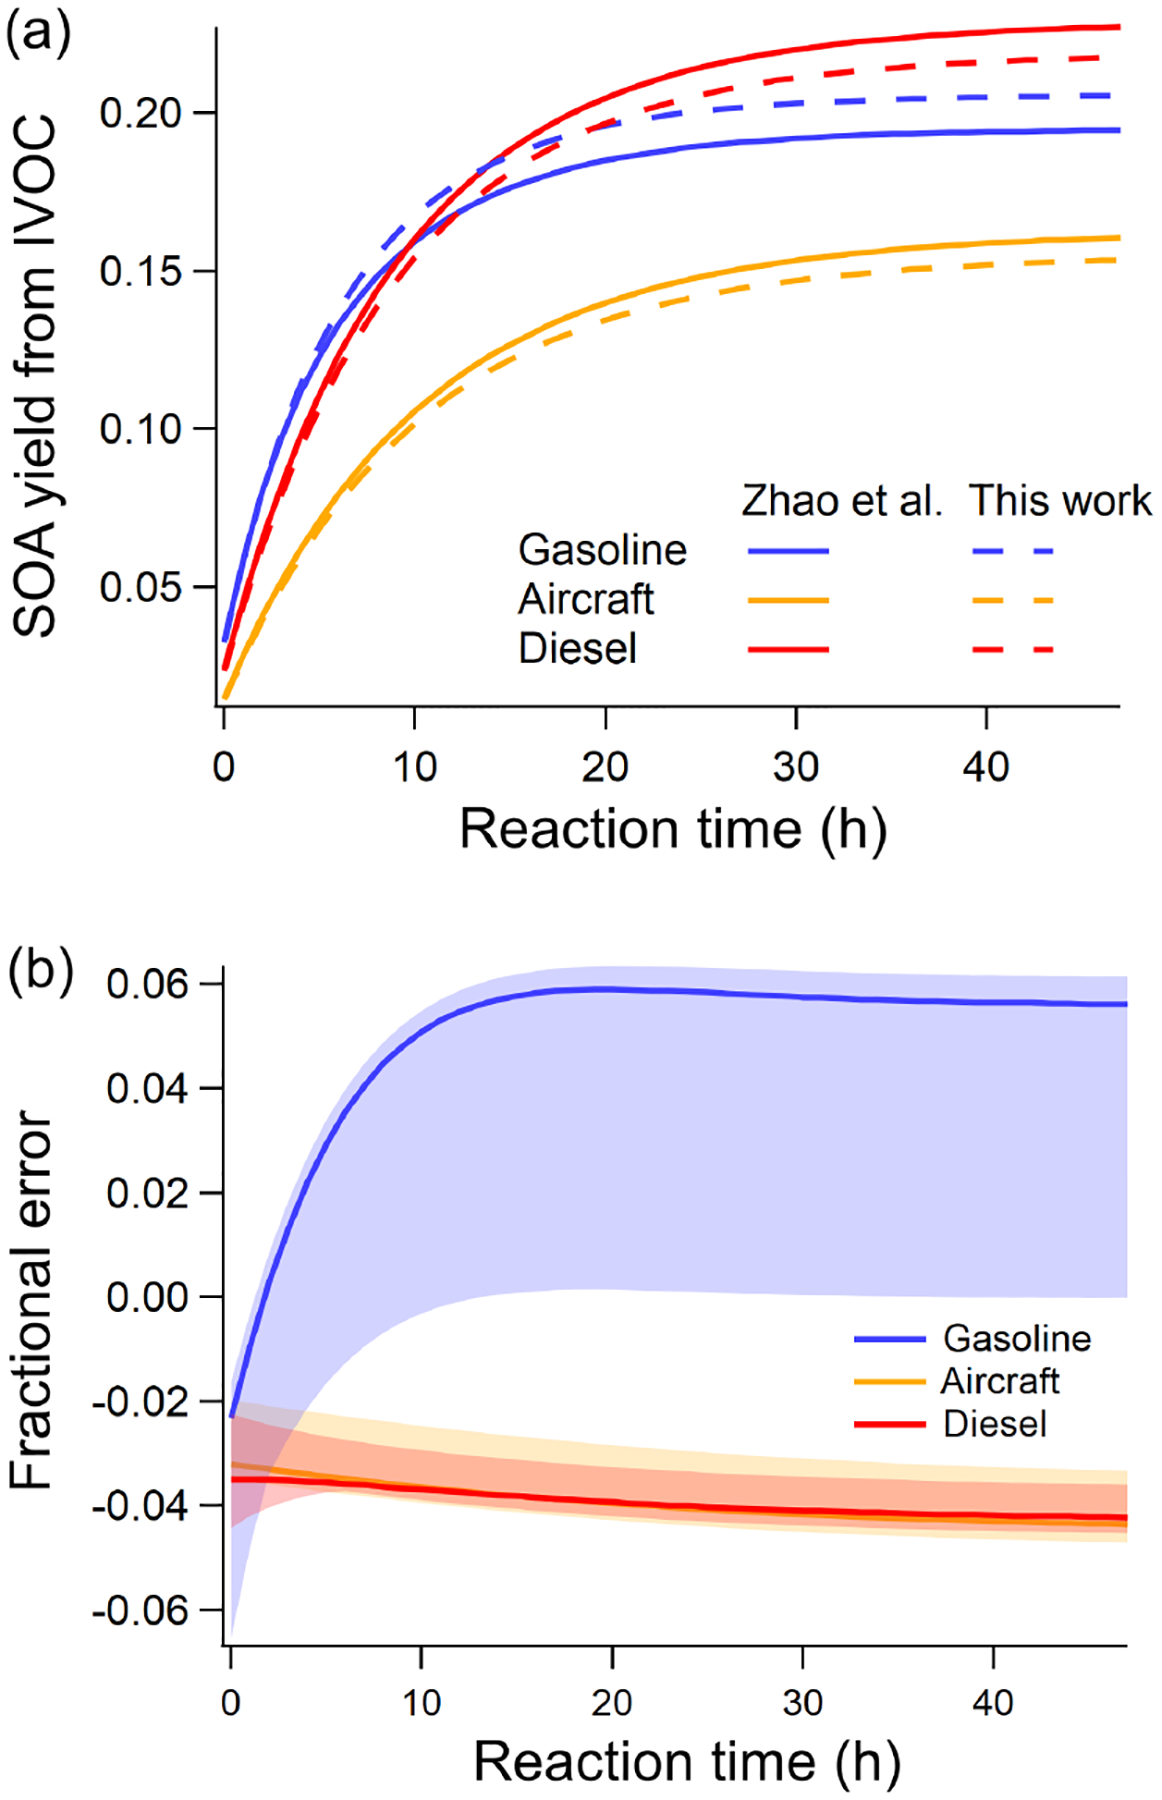
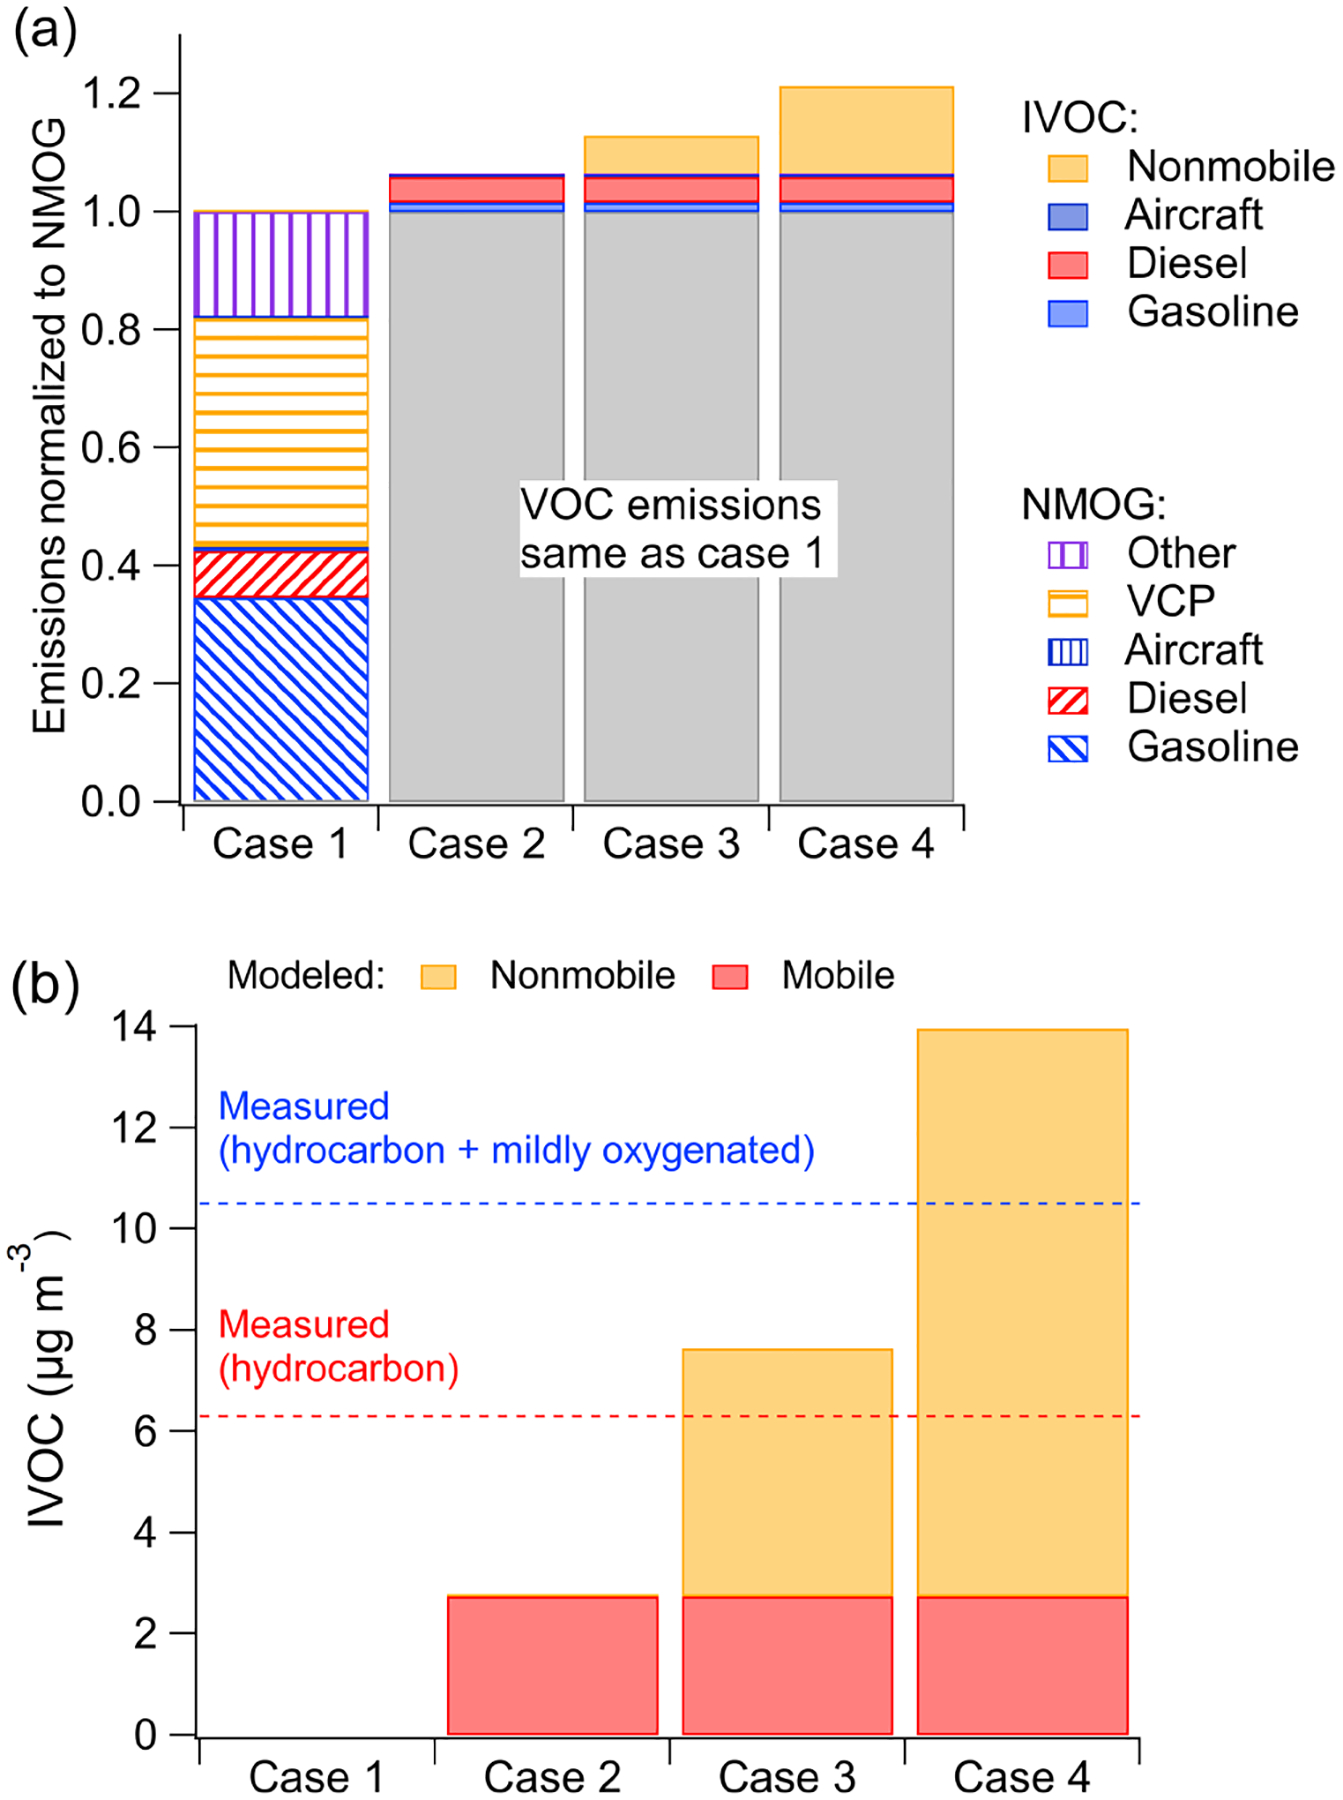
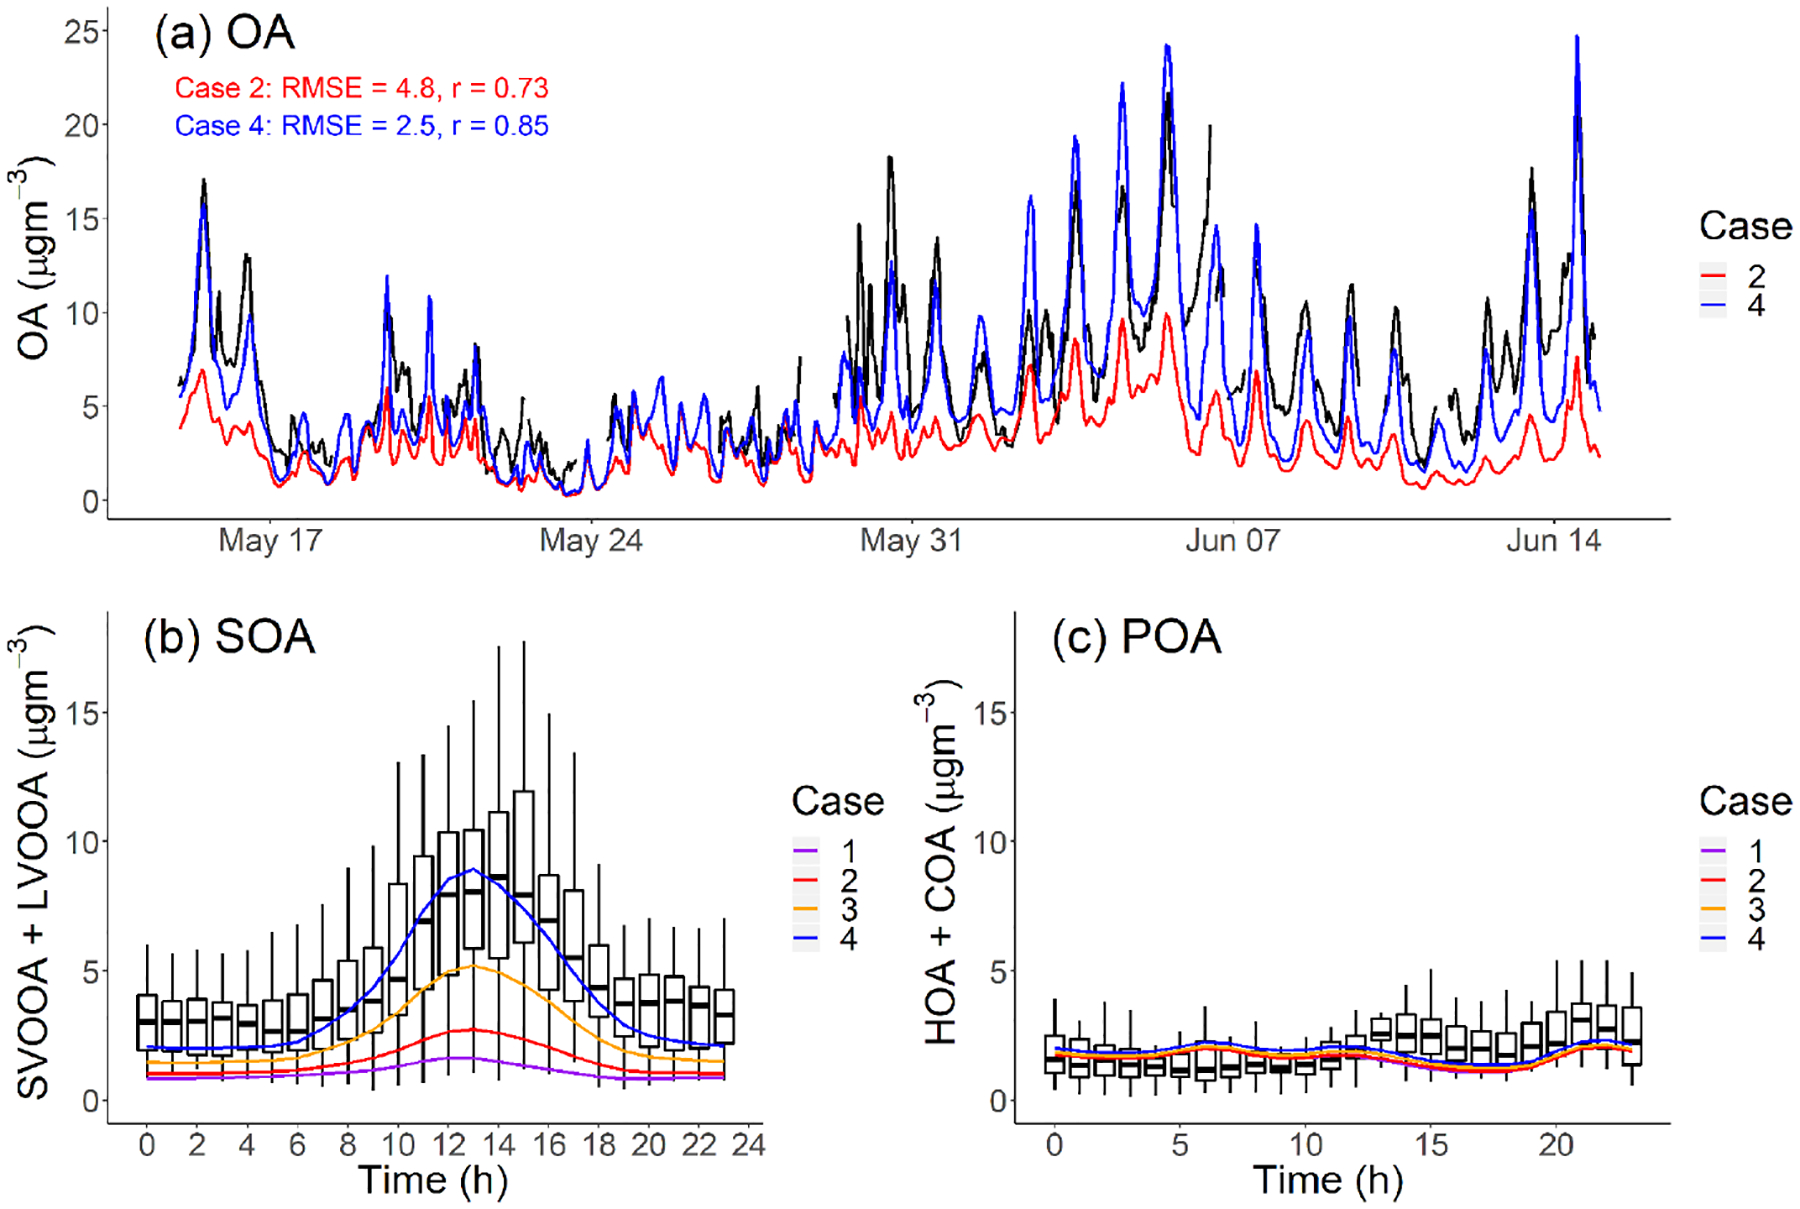
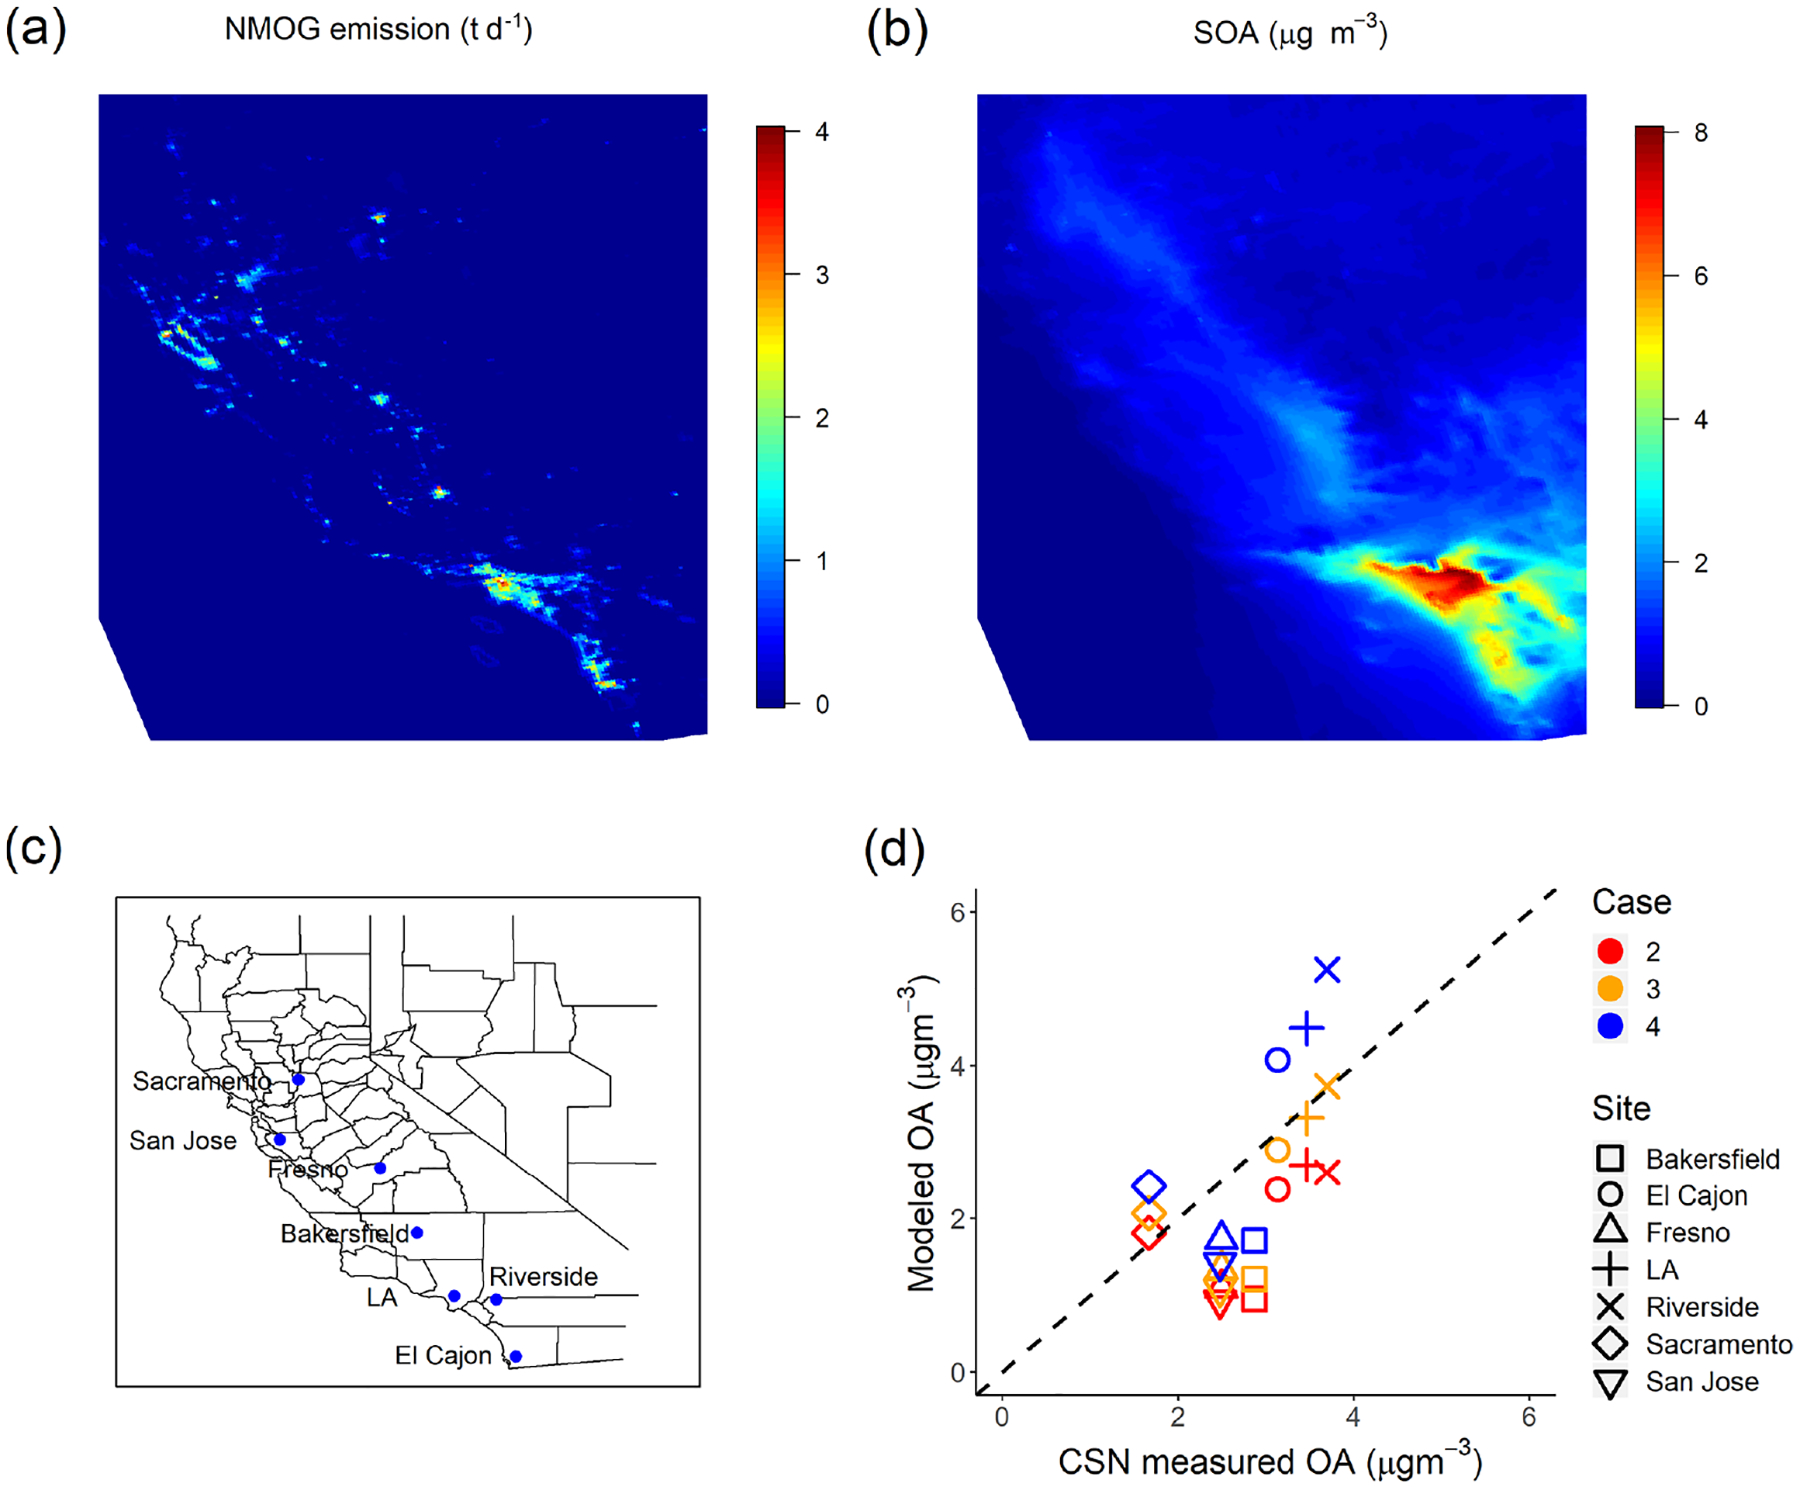
We describe simulations using an updated version of the Community Multiscale Air Quality model version 5.3 (CMAQ v5.3) to investigate the contribution of intermediate-volatility organic compounds (IVOCs) to secondary organic aerosol (SOA) formation in southern California during the CalNex study. We first derive a model-ready parameterization for SOA formation from IVOC emissions from mobile sources. To account for SOA formation from both diesel and gasoline sources, the parameterization has six lumped precursor species that resolve both volatility and molecular structure (aromatic versus aliphatic). We also implement new mobile-source emission profiles that quantify all IVOCs based on direct measurements. The profiles have been released in SPECIATE 5.0. By incorporating both comprehensive mobile-source emission profiles for semivolatile organic compounds (SVOCs) and IVOCs and experimentally constrained SOA yields, this CMAQ configuration best represents the contribution of mobile sources to urban and regional ambient organic aerosol (OA). In the Los Angeles region, gasoline sources emit 4 times more non-methane organic gases (NMOGs) than diesel sources, but diesel emits roughly 3 times more IVOCs on an absolute basis. The revised model predicts all mobile sources (including on- and off-road gasoline, aircraft, and on- and off-road diesel) contribute ~ 1 μgm-3 to the daily peak SOA concentration in Pasadena. This represents a ~ 70% increase in predicted daily peak SOA formation compared to the base version of CMAQ. Therefore, IVOCs in mobile-source emissions contribute almost as much SOA as traditional precursors such as single-ring aromatics. However, accounting for these emissions in CMAQ does not reproduce measurements of either ambient SOA or IVOCs. To investigate the potential contribution of other IVOC sources, we performed two exploratory simulations with varying amounts of IVOC emissions from nonmobile sources. To close the mass balance of primary hydrocarbon IVOCs, IVOCs would need to account for 12% of NMOG emissions from nonmobile sources (or equivalently 30.7 t d-1 in the Los Angeles-Pasadena region), a value that is well within the reported range of IVOC content from volatile chemical products. To close the SOA mass balance and also explain the mildly oxygenated IVOCs in Pasadena, an additional 14.8% of nonmobile-source NMOG emissions would need to be IVOCs (assuming SOA yields from the mobile IVOCs apply to nonmobile IVOCs). However, an IVOC-to-NMOG ratio of 26.8% (or equivalently 68.5 t d-1 in the Los Angeles-Pasadena region) for nonmobile sources is likely unrealistically high. Our results highlight the important contribution of IVOCs to SOA production in the Los Angeles region but underscore that other uncertainties must be addressed (multigenerational aging, aqueous chemistry and vapor wall losses) to close the SOA mass balance. This research also highlights the effectiveness of regulations to reduce mobile-source emissions, which have in turn increased the relative importance of other sources, such as volatile chemical products.
Conflict of interest statement
Competing interests. The authors declare that they have no conflict of interest.
Figures
References
-
- Akherati A, Cappa CD, Kleeman MJ, Docherty KS, Jimenez JL, Griffith SM, Dusanter S, Stevens PS, and Jathar SH: Simulating secondary organic aerosol in a regional air quality model using the statistical oxidation model - Part 3: Assessing the influence of semi-volatile and intermediate-volatility organic compounds and NOx, Atmos. Chem. Phys, 19, 4561–4594, 10.5194/acp-19-4561-2019, 2019. - DOI
-
- Apte JS, Brauer M, Cohen AJ, Ezzati M, and Pope CA: Ambient PM2.5 Reduces Global and Regional Life Expectancy, Environ. Sci. Technol. Lett, 5, 546–551, 10.1021/acs.estlett.8b00360, 2018. - DOI
-
- Baker KR, Carlton AG, Kleindienst TE, Offenberg JH, Beaver MR, Gentner DR, Goldstein AH, Hayes PL, Jimenez JL, Gilman JB, de Gouw JA, Woody MC, Pye HOT, Kelly JT, Lewandowski M, Jaoui M, Stevens PS, Brune WH, Lin Y-H, Rubitschun CL, and Surratt JD: Gas and aerosol carbon in California: comparison of measurements and model predictions in Pasadena and Bakersfield, Atmos. Chem. Phys, 15, 5243–5258, 10.5194/acp-15-5243-2015, 2015. - DOI
-
- Bash JO, Baker KR, and Beaver MR: Evaluation of improved land use and canopy representation in BEIS v3.61 with biogenic VOC measurements in California, Geosci. Model Dev, 9, 2191–2207, 10.5194/gmd-9-2191-2016, 2016. - DOI
-
- Borbon A, Gilman JB, Kuster WC, Grand N, Chevaillier S,Colomb A, Dolgorouky C, Gros V, Lopez M, Sarda-Esteve R, Holloway J, Stutz J, Petetin H, McKeen S, Beekmann M, Warneke C, Parrish DD, and De Gouw JA: Emission ratios of anthropogenic volatile organic compounds in northern mid-latitude megacities: Observations versus emission inventories in Los Angeles and Paris, J. Geophys. Res.-Atmos, 118, 2041–2057, 10.1002/jgrd.50059, 2013. - DOI
Grants and funding
LinkOut - more resources
Full Text Sources