

Application of High Resolution Melt analysis (HRM) for screening haplotype variation in a non-model plant genus: Cyclopia (Honeybush)
- PMID: 32461839
- PMCID: PMC7233275
- DOI: 10.7717/peerj.9187
Application of High Resolution Melt analysis (HRM) for screening haplotype variation in a non-model plant genus: Cyclopia (Honeybush)
Abstract
Aim: This study has three broad aims: to (a) develop genus-specific primers for High Resolution Melt analysis (HRM) of members of Cyclopia Vent., (b) test the haplotype discrimination of HRM compared to Sanger sequencing, and (c) provide an example of using HRM to detect novel haplotype variation in wild C. subternata Vogel. populations.
Location: The Cape Floristic Region (CFR), located along the southern Cape of South Africa.
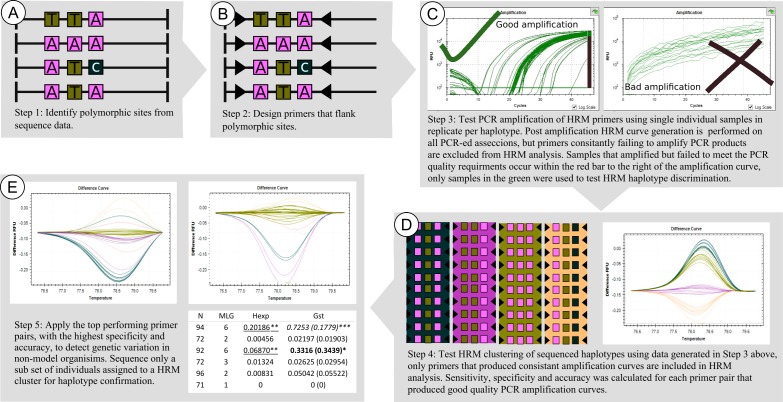
Methods: Polymorphic loci were detected through a screening process of sequencing 12 non-coding chloroplast DNA segments across 14 Cyclopia species. Twelve genus-specific primer combinations were designed around variable cpDNA loci, four of which failed to amplify under PCR; the eight remaining were applied to test the specificity, sensitivity and accuracy of HRM. The three top performing HRM Primer combinations were then applied to detect novel haplotypes in wild C. subternata populations, and phylogeographic patterns of C. subternata were explored.
Results: We present a framework for applying HRM to non-model systems. HRM accuracy varied across the PCR products screened using the genus-specific primers developed, ranging between 56 and 100%. The nucleotide variation failing to produce distinct melt curves is discussed. The top three performing regions, having 100% specificity (i.e. different haplotypes were never grouped into the same cluster, no false negatives), were able to detect novel haplotypes in wild C. subternata populations with high accuracy (96%). Sensitivity below 100% (i.e. a single haplotype being clustered into multiple unique groups during HRM curve analysis, false positives) was resolved through sequence confirmation of each cluster resulting in a final accuracy of 100%. Phylogeographic analyses revealed that wild C. subternata populations tend to exhibit phylogeographic structuring across mountain ranges (accounting for 73.8% of genetic variation base on an AMOVA), and genetic differentiation between populations increases with distance (p < 0.05 for IBD analyses).
Conclusions: After screening for regions with high HRM clustering specificity-akin to the screening process associated with most PCR based markers-the technology was found to be a high throughput tool for detecting genetic variation in non-model plants.
Keywords: Cape Floristic Region (CFR); Cyclopia; Genetics; Haplotype screening; High Resolution Melt analysis (HRM); Honeybush; Non-model organisims; Phylogeography.
©2020 Galuszynski and Potts.
Conflict of interest statement
Alastair J. Potts is an Academic Editor for PeerJ.
Figures


Similar articles
-
Do Centres of Endemism provide a spatial context for predicting and preserving plant phylogeographic patterns in the Cape Floristic Region, South Africa?PeerJ. 2020 Sep 23;8:e10045. doi: 10.7717/peerj.10045. eCollection 2020. PeerJ. 2020. PMID: 33024648 Free PMC article.
-
The transition to agricultural cultivation of neo-crops may fail to account for wild genetic diversity patterns: insights from the Cape Floristic Region.PeerJ. 2021 Jun 9;9:e11462. doi: 10.7717/peerj.11462. eCollection 2021. PeerJ. 2021. PMID: 34178439 Free PMC article.
-
Applied phylogeography of Cyclopia intermedia (Fabaceae) highlights the need for 'duty of care' when cultivating honeybush.PeerJ. 2020 Sep 2;8:e9818. doi: 10.7717/peerj.9818. eCollection 2020. PeerJ. 2020. PMID: 32953270 Free PMC article.
-
Honeybush (Cyclopia sp.) - a rich source of compounds with high antimutagenic properties.Fitoterapia. 2009 Jan;80(1):3-11. doi: 10.1016/j.fitote.2008.11.001. Epub 2008 Nov 11. Fitoterapia. 2009. PMID: 19032980 Review.
-
Chloroplast DNA phylogeography of Clintoniaudensis Trautv. & Mey. (Liliaceae) in East Asia.Mol Phylogenet Evol. 2010 May;55(2):721-32. doi: 10.1016/j.ympev.2010.02.010. Epub 2010 Feb 19. Mol Phylogenet Evol. 2010. PMID: 20172032 Review.
Cited by
-
Do Centres of Endemism provide a spatial context for predicting and preserving plant phylogeographic patterns in the Cape Floristic Region, South Africa?PeerJ. 2020 Sep 23;8:e10045. doi: 10.7717/peerj.10045. eCollection 2020. PeerJ. 2020. PMID: 33024648 Free PMC article.
-
The transition to agricultural cultivation of neo-crops may fail to account for wild genetic diversity patterns: insights from the Cape Floristic Region.PeerJ. 2021 Jun 9;9:e11462. doi: 10.7717/peerj.11462. eCollection 2021. PeerJ. 2021. PMID: 34178439 Free PMC article.
-
Rapid detection of the SARS-CoV-2 omicron variants based on high-resolution melting curve analysis.Sci Rep. 2024 Nov 15;14(1):28227. doi: 10.1038/s41598-024-79254-w. Sci Rep. 2024. PMID: 39548282 Free PMC article.
-
Applied phylogeography of Cyclopia intermedia (Fabaceae) highlights the need for 'duty of care' when cultivating honeybush.PeerJ. 2020 Sep 2;8:e9818. doi: 10.7717/peerj.9818. eCollection 2020. PeerJ. 2020. PMID: 32953270 Free PMC article.
-
Application of MaxEnt Modeling and HRM Analysis to Support the Conservation and Domestication of Gevuina avellana Mol. in Central Chile.Plants (Basel). 2022 Oct 21;11(20):2803. doi: 10.3390/plants11202803. Plants (Basel). 2022. PMID: 36297827 Free PMC article.
References
-
- Beheregaray LB. Twenty years of phylogeography: the state of the field and the challenges for the Southern Hemisphere. Molecular Ecology. 2008;17(17):3754–3774. - PubMed
-
- Cubry P, Gallagher E, O’Connor E, Kelleher CT. Phylogeography and population genetics of black alder (Alnus glutinosa (L.) Gaertn.) in Ireland: putting it in a European context. Tree Genetics & Genomes. 2015;11(5):99. doi: 10.1007/s11295-015-0924-4. - DOI
Associated data
LinkOut - more resources
Full Text Sources
