

Effect of Ag loading position on the photocatalytic performance of TiO2 nanocolumn arrays
- PMID: 32461873
- PMCID: PMC7214874
- DOI: 10.3762/bjnano.11.59
Effect of Ag loading position on the photocatalytic performance of TiO2 nanocolumn arrays
Abstract
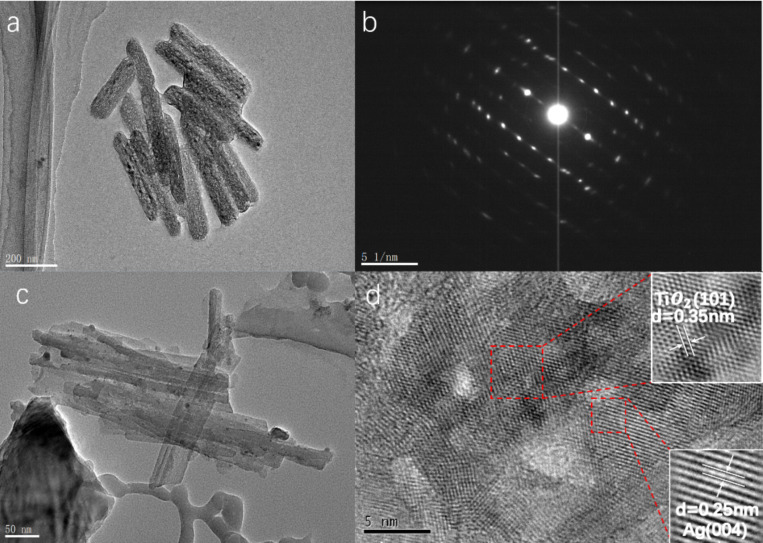
Plasmonic metal/semiconductor composites have attracted great attention for efficient solar energy harvesting in photovoltaic and photocatalytic applications owing to their extremely high visible-light absorption and tuned effective band gap. In this work, Ag-loaded TiO2 nanocolumn (Ag-TNC) arrays were fabricated based on anodic aluminum oxide (AAO) template by combining atomic layer deposition (ALD) and vacuum evaporation. The effects of the Ag loading position and deposition thickness, and the morphology, structure and composition of Ag-deposited TNC arrays on its optical and photocatalytic properties were studied. The Ag-filled TiO2 (AFT) nanocolumn arrays exhibited higher removal efficiency of methylene blue (MB) compared with Ag-coated TiO2 (ACT) nanocolumn arrays and pure TiO2 nanocolumns arrays. Both experimental and theoretical simulation results demonstrated that the enhanced photocatalytic performance of AFT nanocolumn arrays was attributed to the surface plasmon resonance (SPR) of Ag and the absorption of light by TiO2. These results represent a promising step forward to the development of high-performance photocatalysts for energy conversion and storage.
Keywords: anodic aluminum oxide template; nanocolumn arrays; photocatalysis; surface plasmon resonance.
Copyright © 2020, Xu et al.; licensee Beilstein-Institut.
Figures


Similar articles
-
In situ plasmonic Ag nanoparticle anchored TiO2 nanotube arrays as visible-light-driven photocatalysts for enhanced water splitting.Nanoscale. 2016 Mar 7;8(9):5226-34. doi: 10.1039/c5nr08341a. Nanoscale. 2016. PMID: 26878901
-
TiO2 Nanocolumn Arrays for More Efficient and Stable Perovskite Solar Cells.ACS Appl Mater Interfaces. 2020 Feb 5;12(5):5979-5989. doi: 10.1021/acsami.9b21628. Epub 2020 Jan 24. ACS Appl Mater Interfaces. 2020. PMID: 31927904
-
Enhanced photocatalytic performance of Ag/TiO2 nanohybrid sensitized by black phosphorus nanosheets in visible and near-infrared light.J Colloid Interface Sci. 2019 Jan 15;534:1-11. doi: 10.1016/j.jcis.2018.09.013. Epub 2018 Sep 5. J Colloid Interface Sci. 2019. PMID: 30196196
-
Enhanced Photocatalytic Properties and Photoinduced Crystallization of TiO2-Fe2O3 Inverse Opals Fabricated by Atomic Layer Deposition.ACS Appl Mater Interfaces. 2024 Sep 11;16(36):46964-46974. doi: 10.1021/acsami.4c10831. Epub 2024 Sep 3. ACS Appl Mater Interfaces. 2024. PMID: 39225124 Free PMC article. Review.
-
Recent Advances in Black TiO2 Nanomaterials for Solar Energy Conversion.Nanomaterials (Basel). 2023 Jan 24;13(3):468. doi: 10.3390/nano13030468. Nanomaterials (Basel). 2023. PMID: 36770430 Free PMC article. Review.
Cited by
-
Enhanced visible-light photodegradation of fluoroquinolone-based antibiotics and E. coli growth inhibition using Ag-TiO2 nanoparticles.RSC Adv. 2021 Apr 13;11(23):13980-13991. doi: 10.1039/d0ra10403e. eCollection 2021 Apr 13. RSC Adv. 2021. PMID: 35423911 Free PMC article.
References
LinkOut - more resources
Full Text Sources
Miscellaneous