. 2020 May 6:11:729-739.
doi: 10.3762/bjnano.11.60. eCollection 2020.

Quantitative determination of the interaction potential between two surfaces using frequency-modulated atomic force microscopy

Affiliations

Quantitative determination of the interaction potential between two surfaces using frequency-modulated atomic force microscopy

Nicholas Chan et al. Beilstein J Nanotechnol. .

Abstract

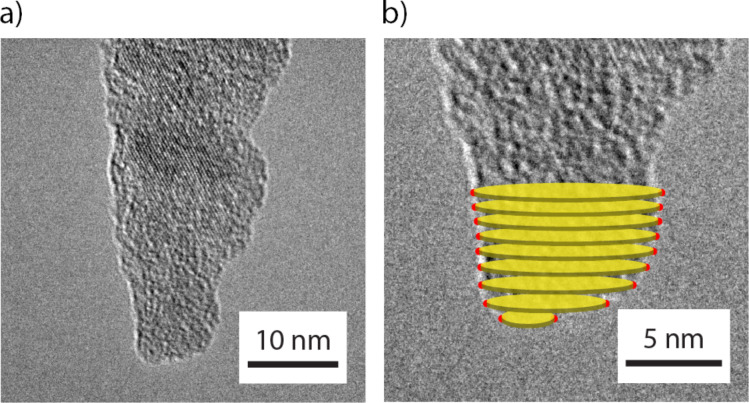
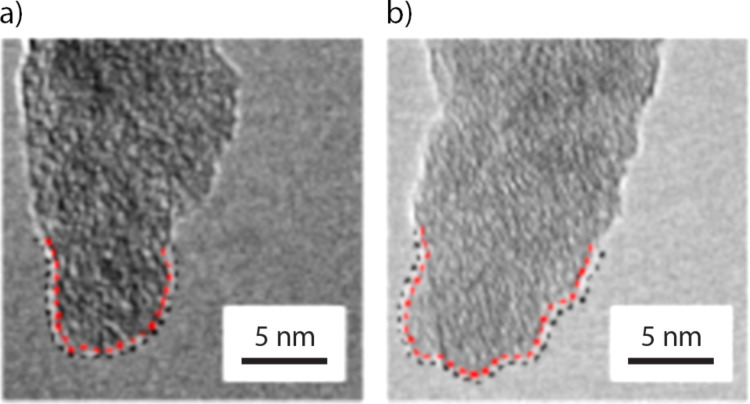
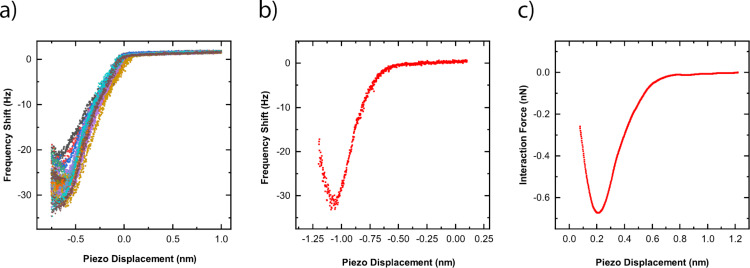
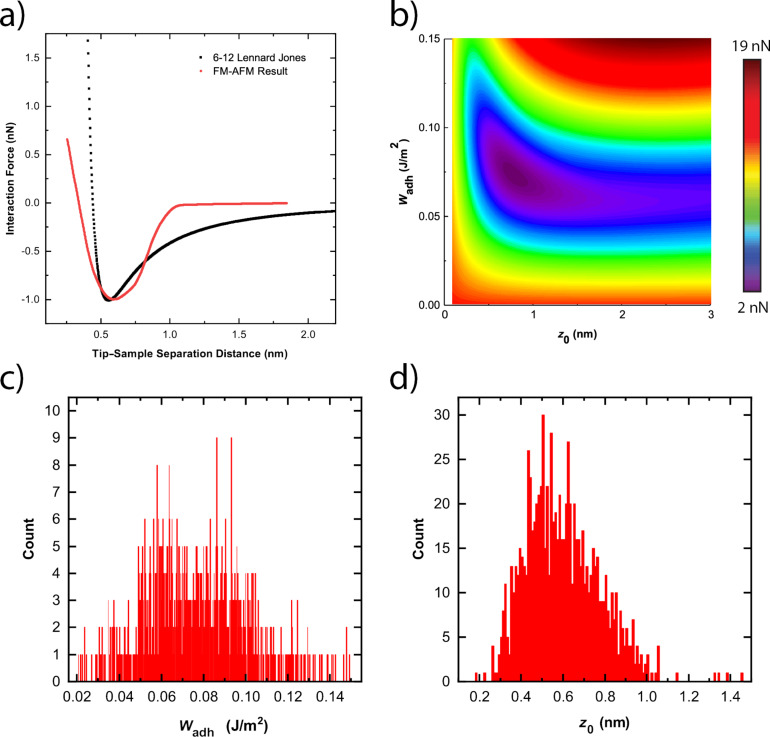
The interaction potential between two surfaces determines the adhesive and repulsive forces between them. It also determines interfacial properties, such as adhesion and friction, and is a key input into mechanics models and atomistic simulations of contacts. We have developed a novel methodology to experimentally determine interaction potential parameters, given a particular potential form, using frequency-modulated atomic force microscopy (AFM). Furthermore, this technique can be extended to the experimental verification of potential forms for any given material pair. Specifically, interaction forces are determined between an AFM tip apex and a nominally flat substrate using dynamic force spectroscopy measurements in an ultrahigh vacuum (UHV) environment. The tip geometry, which is initially unknown and potentially irregularly shaped, is determined using transmission electron microscopy (TEM) imaging. It is then used to generate theoretical interaction force-displacement relations, which are then compared to experimental results. The method is demonstrated here using a silicon AFM probe with its native oxide and a diamond sample. Assuming the 6-12 Lennard-Jones potential form, best-fit values for the work of adhesion (W adh) and range of adhesion (z 0) parameters were determined to be 80 ± 20 mJ/m2 and 0.6 ± 0.2 nm, respectively. Furthermore, the shape of the experimentally extracted force curves was shown to deviate from that calculated using the 6-12 Lennard-Jones potential, having weaker attraction at larger tip-sample separation distances and weaker repulsion at smaller tip-sample separation distances. This methodology represents the first experimental technique in which material interaction potential parameters were verified over a range of tip-sample separation distances for a tip apex of arbitrary geometry.

Keywords: Lennard-Jones; adhesion; atomic force microscopy; diamond; frequency-modulated AFM; interaction potential; surfaces.


Figures

Figure 1
Figure 1
(a) TEM image of the apex of the AFM tip used in FM-AFM measurements. (b) Magnified TEM image of the AFM tip shown in Figure 1a. The thin yellow disks represent the methodology by which the two-dimensional tip apex profile is turned into a three-dimensional tip apex volume.
Figure 2
Figure 2
(a) TEM image of the AFM tip apex before AFM imaging. (b) TEM image of the AFM tip apex after AFM imaging. No appreciable change was observed in tip apex radius when comparing Figure 2a and Figure 2b. Furthermore, an ordered silicon lattice structure is observed in both Figure 2a and Figure 2b. The absence of perturbations in the silicon lattice suggests plastic deformation of the AFM tip did not occur during the AFM experiments. Rotation of the tip apex is apparent between TEM imaging before and after AFM experiments. This is primarily caused by residual glue on the cantilever chip after AFM measurements. In both (a) and (b), a black dotted line shows the traced tip apex while the red dotted line shows the interface between SiOx and Si. No change in the distance between the SiOx and the crystalline Si is observed between tip (a) and (b).
Figure 3
Figure 3
Topographic AFM image of the diamond surface showing the nanometer-scale roughness of the surface. Dashed lines show the grid on which the Δfd curves were acquired.
Figure 4
Figure 4
(a) 20 Δfd curves measured at one grid position on the diamond sample using a silicon AFM probe. (b) An example of a single Δfd curve from the same grid position as in Figure 5a. (c) The corresponding calculated interaction force from Figure 5b, as calculated via the method developed by Sader and Jarvis [45].
Figure 5
Figure 5
(a) Example of an experimentally derived interaction force–distance curve compared to a theoretically derived force–distance curve with best-fit parameters for Wadh and z0. Theoretical LJ F(z) curves were calculated using a tip apex profile generated by TEM images taken before the AFM experiments. In this case, the best-fit parameters for Wadh and z0 are 0.0860 J/m2 and 0.55 nm, respectively. (b) An example of a square-rooted variance map produced using a least squares fitting technique to compare the experimental F(z) curves to LJ F(z) curves. (c, d) Histograms of the best-fit Wadh and z0 values, respectively, over the entire diamond surface.
Figure 6
Figure 6
a) Averaged best-fit Wadh value over a 500 nm × 500 nm scan area of the diamond surface. b) Averaged best-fit z0 value over a 500 nm × 500 nm scan area of the diamond surface. There are four positions in this scan area for which all frequency curves were disregarded as the extracted F(z) curves contained multiple local force minima.

Similar articles

Cited by

  • Reduced Radial Curves of Diatomic Molecules.
    Špirko V. Špirko V. J Chem Theory Comput. 2023 Oct 24;19(20):7324-7332. doi: 10.1021/acs.jctc.3c00622. Epub 2023 Sep 29. J Chem Theory Comput. 2023. PMID: 37774238 Free PMC article.

References

    1. Vettiger P, Despont M, Drechsler U, Durig U, Haberle W, Lutwyche M I, Rothuizen H E, Stutz R, Widmer R, Binnig G K. IBM J Res Dev. 2000;44:323–340. doi: 10.1147/rd.443.0323. - DOI
    1. Van Kessel P F, Hornbeck L J, Meier R E, Douglass M R. Proc IEEE. 1998;86:1687–1704. doi: 10.1109/5.704274. - DOI
    1. Douglass M R. Annual Proceedings - Reliability Physics (Symposium) IEEE; 1998. Lifetime estimates and unique failure mechanisms of the Digital Micromirror Device (DMD) pp. 9–16.
    1. Sugimoto Y, Pou P, Abe M, Jelinek P, Pérez R, Morita S, Custance Ó. Nature. 2007;446:64–67. doi: 10.1038/nature05530. - DOI - PubMed
    1. Lantz M A, Hug H J, Hoffmann R, van Schendel P J A, Kappenberger P, Martin S, Baratoff A, Güntherodt H J. Science. 2001;291:2580–2583. doi: 10.1126/science.1057824. - DOI - PubMed

LinkOut - more resources