

Association of Baltic Sea and Mediterranean diets with frailty phenotype in older women, Kuopio OSTPRE-FPS study
- PMID: 32462318
- PMCID: PMC7900336
- DOI: 10.1007/s00394-020-02290-5
Association of Baltic Sea and Mediterranean diets with frailty phenotype in older women, Kuopio OSTPRE-FPS study
Abstract
Purpose: To evaluate the association between Baltic Sea diet (BSD) and Mediterranean diet (MED) with frailty.
Methods: This was a secondary analysis on the osteoporosis risk factor and prevention-fracture prevention study on 440 women aged 65-72 years. Frailty was ascertained with the presence of 3-5 and prefrailty 1-2 of the following criteria: weight loss ≥ 5%, low life satisfaction score, walking speed ≤ 0.51 m/s, handgrip strength divided by body mass index ≤ 0.67 kg/m2 and physical activity ≤ 2 h/week. Women answered to questionnaires on lifestyle factors and 3-day food record. BSD score was ascertained using intake of nine and MED score of eight foods or nutrients components from food record. Multinomial logistic regression models adjusted for age, energy intake, smoking, living status, marital status and intervention group evaluated associations between MED and BSD with frailty phenotype status.
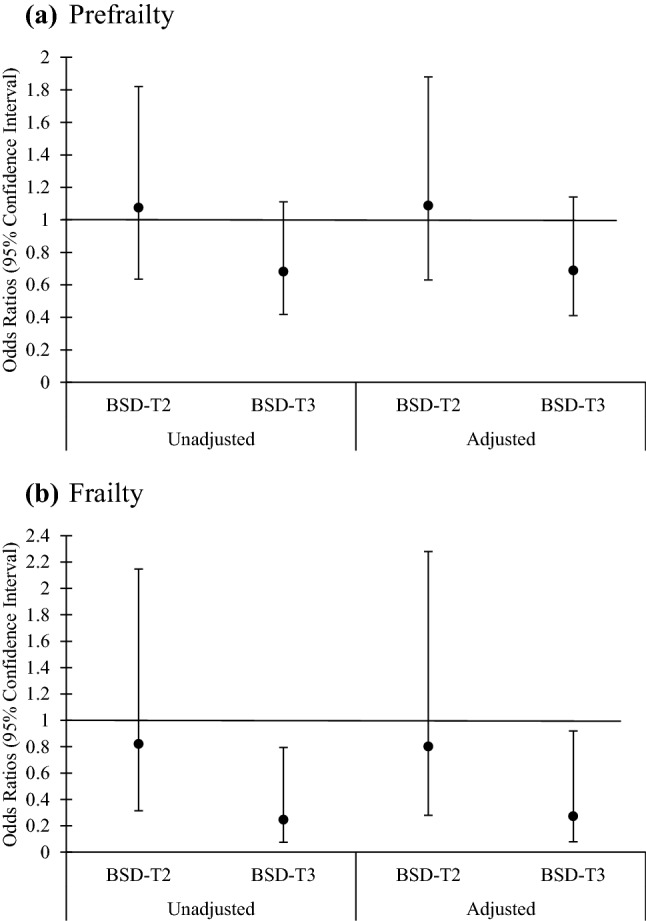
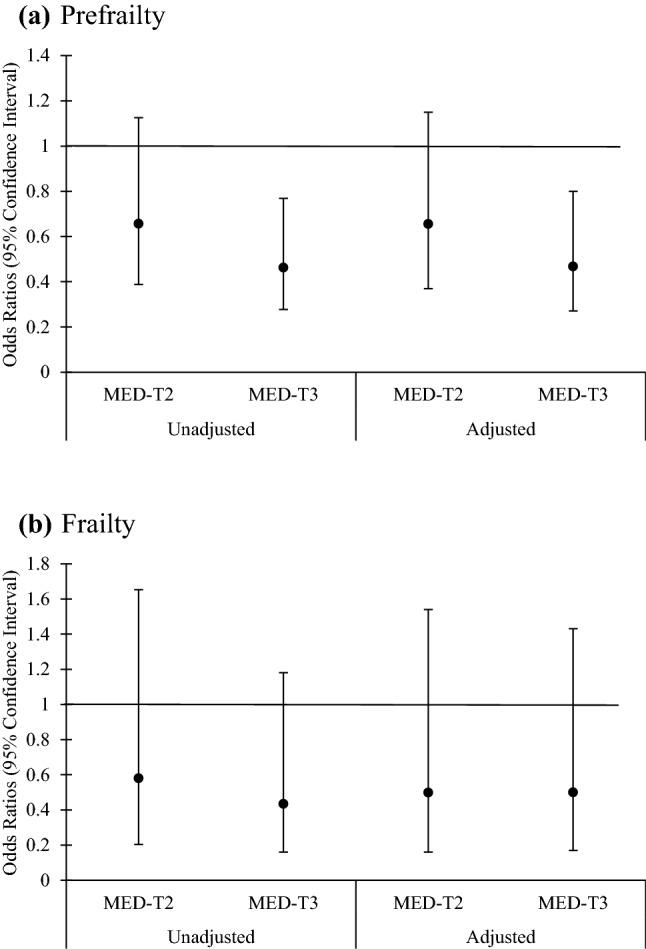
Results: At 3-year follow-up, 206 women (46.8%) were prefrail and 36 (8.2%) were frail. After adjusting for confounders, a tendency was found between BSD per standard deviation (SD)-unit increase and lower likelihood of frailty (β = 0.62, 95% CI = 0.38-1.01, P = 0.057). Further, MED per SD-unit increase was associated with lower likelihood of prefrailty (β = 0.74, 95% CI = 0.6-0.9, P = 0.009). Consumption of vegetables was lower in frail (31.5 ± 36.0 g/day) and prefrail women (37.1 ± 42.0 g/day) than in non-frail women (48.6 ± 40.7 g/day) (P for trend = 0.041).
Conclusions: Positive behavioral characteristics such as following MED and BSD may be associated with lower likelihood of prefrailty and frailty in older women. However, further longitudinal analyses are warranted.
Keywords: Baltic Sea diet; Frailty; Mediterranean diet; Older women.
Conflict of interest statement
The authors declare that they have no conflict of interest.
Figures
References
-
- Lo Y, Hsieh Y, Hsu L, et al. Dietary pattern associated with frailty: results from nutrition and health survey in Taiwan. J Am Geriatr Soc. 2017;65:2009–2015. - PubMed
-
- Rashidi Pour Fard N, Amirabdollahian F, Haghighatdoost F. Dietary patterns and frailty: a systematic review and meta-analysis. Nutr Rev. 2019;77:498–513. - PubMed
-
- O'Connell ML, Coppinger T, McCarthy AL. The role of nutrition and physical activity in frailty: A review. Clin Nutr ESPEN. 2019;35:1–11. - PubMed
MeSH terms
LinkOut - more resources
Full Text Sources
Miscellaneous
