

PINE: An Automation Tool to Extract and Visualize Protein-Centric Functional Networks
- PMID: 32463229
- PMCID: PMC10362945
- DOI: 10.1021/jasms.0c00032
PINE: An Automation Tool to Extract and Visualize Protein-Centric Functional Networks
Abstract
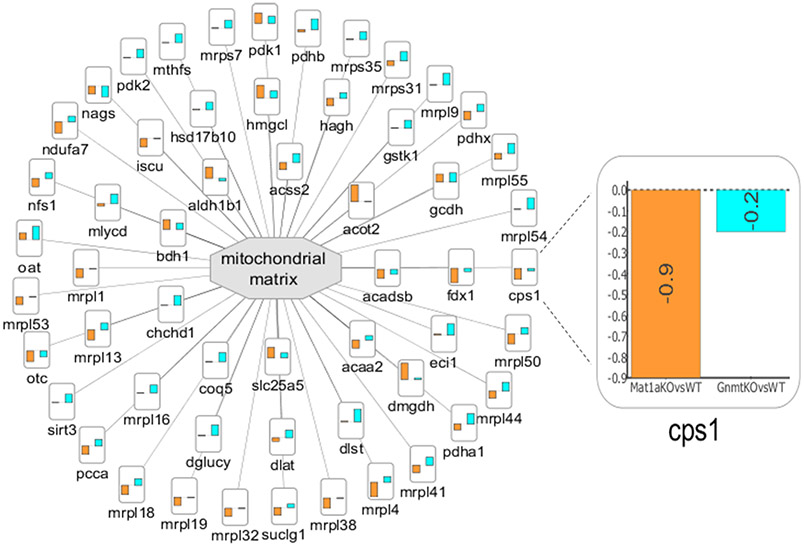
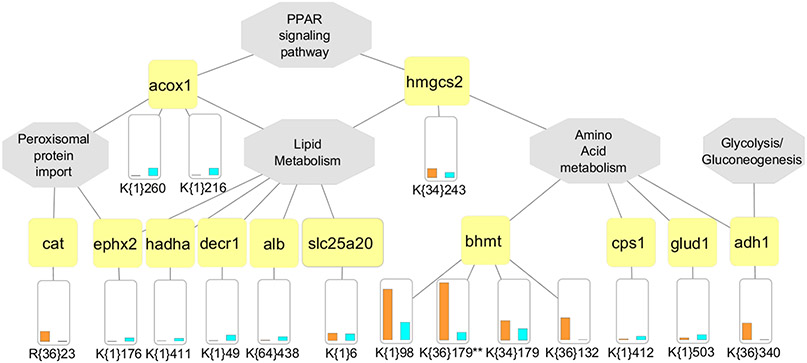
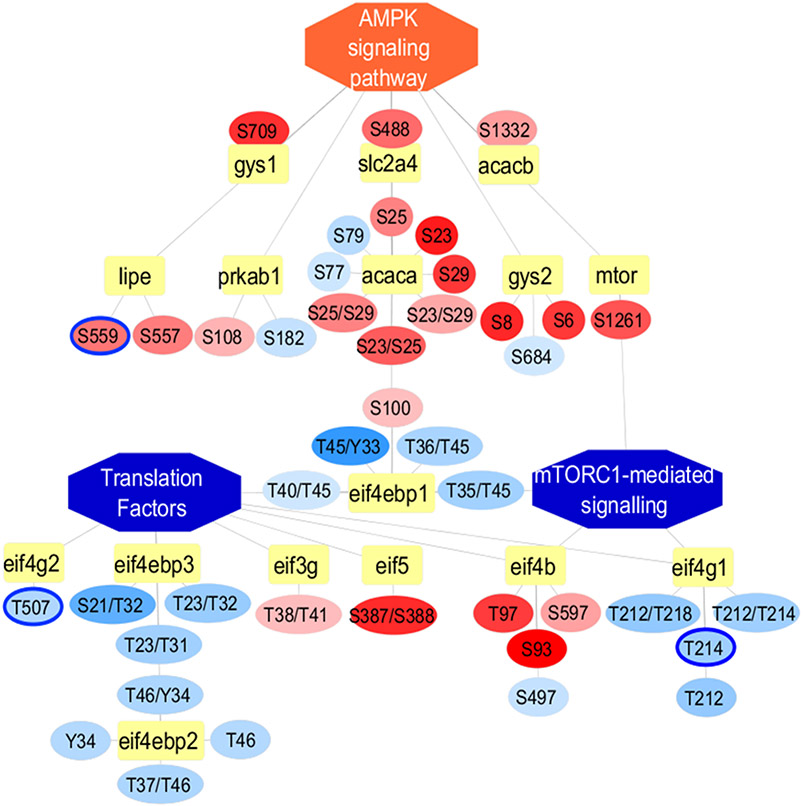
Recent surges in mass spectrometry-based proteomics studies demand a concurrent rise in speedy and optimized data processing tools and pipelines. Although several stand-alone bioinformatics tools exist that provide protein-protein interaction (PPI) data, we developed Protein Interaction Network Extractor (PINE) as a fully automated, user-friendly, graphical user interface application for visualization and exploration of global proteome and post-translational modification (PTM) based networks. PINE also supports overlaying differential expression, statistical significance thresholds, and PTM sites on functionally enriched visualization networks to gain insights into proteome-wide regulatory mechanisms and PTM-mediated networks. To illustrate the relevance of the tool, we explore the total proteome and its PTM-associated relationships in two different nonalcoholic steatohepatitis (NASH) mouse models to demonstrate different context-specific case studies. The strength of this tool relies in its ability to (1) perform accurate protein identifier mapping to resolve ambiguity, (2) retrieve interaction data from multiple publicly available PPI databases, and (3) assimilate these complex networks into functionally enriched pathways, ontology categories, and terms. Ultimately, PINE can be used as an extremely powerful tool for novel hypothesis generation to understand underlying disease mechanisms.
Keywords: automated bioinformatics tool; data visualization; enriched networks; post-translational modifications; proteomics.
Figures
Similar articles
-
PhosphOrtholog: a web-based tool for cross-species mapping of orthologous protein post-translational modifications.BMC Genomics. 2015 Aug 19;16(1):617. doi: 10.1186/s12864-015-1820-x. BMC Genomics. 2015. PMID: 26283093 Free PMC article.
-
Functional analysis tools for post-translational modification: a post-translational modification database for analysis of proteins and metabolic pathways.Plant J. 2019 Sep;99(5):1003-1013. doi: 10.1111/tpj.14372. Epub 2019 May 31. Plant J. 2019. PMID: 31034103
-
Cross-Species PTM Mapping from Phosphoproteomic Data.Methods Mol Biol. 2017;1558:459-469. doi: 10.1007/978-1-4939-6783-4_22. Methods Mol Biol. 2017. PMID: 28150252
-
Studying post-translational modifications with protein interaction networks.Curr Opin Struct Biol. 2014 Feb;24:34-44. doi: 10.1016/j.sbi.2013.11.009. Epub 2013 Dec 21. Curr Opin Struct Biol. 2014. PMID: 24721451 Review.
-
Proteomic databases and tools to decipher post-translational modifications.J Proteomics. 2011 Dec 10;75(1):127-44. doi: 10.1016/j.jprot.2011.09.014. Epub 2011 Sep 29. J Proteomics. 2011. PMID: 21983556 Review.
Cited by
-
Identification of Disease-Relevant, Sex-Based Proteomic Differences in iPSC-Derived Vascular Smooth Muscle Cells.Int J Mol Sci. 2024 Dec 29;26(1):187. doi: 10.3390/ijms26010187. Int J Mol Sci. 2024. PMID: 39796045 Free PMC article.
-
MicroRNA and Protein Cargos of Human Limbal Epithelial Cell-Derived Exosomes and Their Regulatory Roles in Limbal Stromal Cells of Diabetic and Non-Diabetic Corneas.Cells. 2023 Oct 25;12(21):2524. doi: 10.3390/cells12212524. Cells. 2023. PMID: 37947602 Free PMC article.
-
Protein arginine deiminase 2 (PAD2) modulates the polarization of THP-1 macrophages to the anti-inflammatory M2 phenotype.J Inflamm (Lond). 2022 Nov 18;19(1):20. doi: 10.1186/s12950-022-00317-8. J Inflamm (Lond). 2022. PMID: 36401289 Free PMC article.
-
Alterations in plasma proteome during acute COVID-19 and recovery.Mol Med. 2024 Aug 25;30(1):131. doi: 10.1186/s10020-024-00898-5. Mol Med. 2024. PMID: 39183264 Free PMC article.
-
Hyperphosphorylation of hepatic proteome characterizes nonalcoholic fatty liver disease in S-adenosylmethionine deficiency.iScience. 2023 Jan 14;26(2):105987. doi: 10.1016/j.isci.2023.105987. eCollection 2023 Feb 17. iScience. 2023. PMID: 36756374 Free PMC article.
References
-
- Doerr A DIA mass spectrometry. Nat. Methods 2015, 12, 35–35.
