. 2020 May 28:9:e49178.
doi: 10.7554/eLife.49178.

Distinct mitochondrial defects trigger the integrated stress response depending on the metabolic state of the cell

Affiliations

Distinct mitochondrial defects trigger the integrated stress response depending on the metabolic state of the cell

Eran Mick et al. Elife. .

Abstract

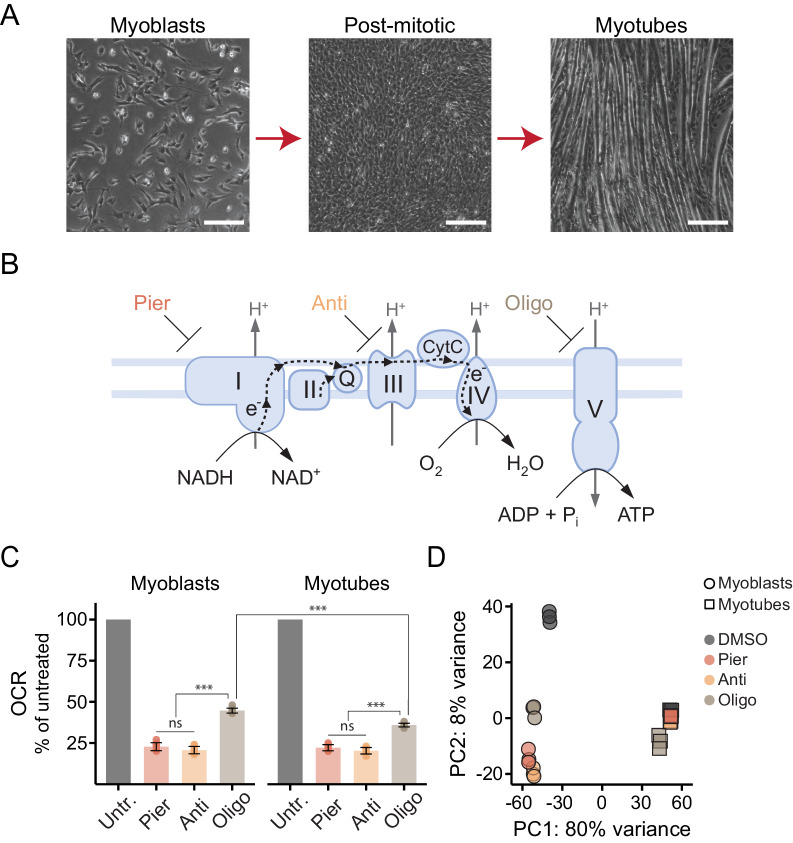
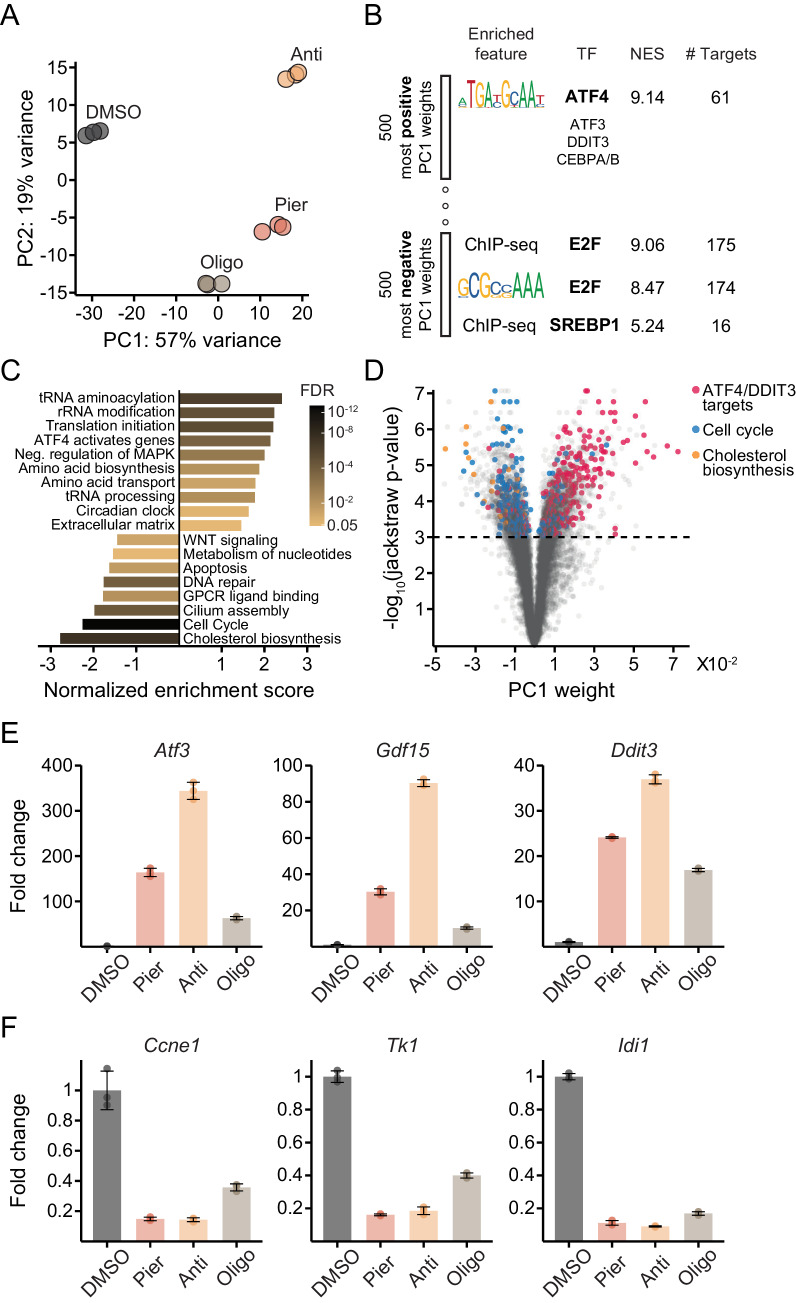
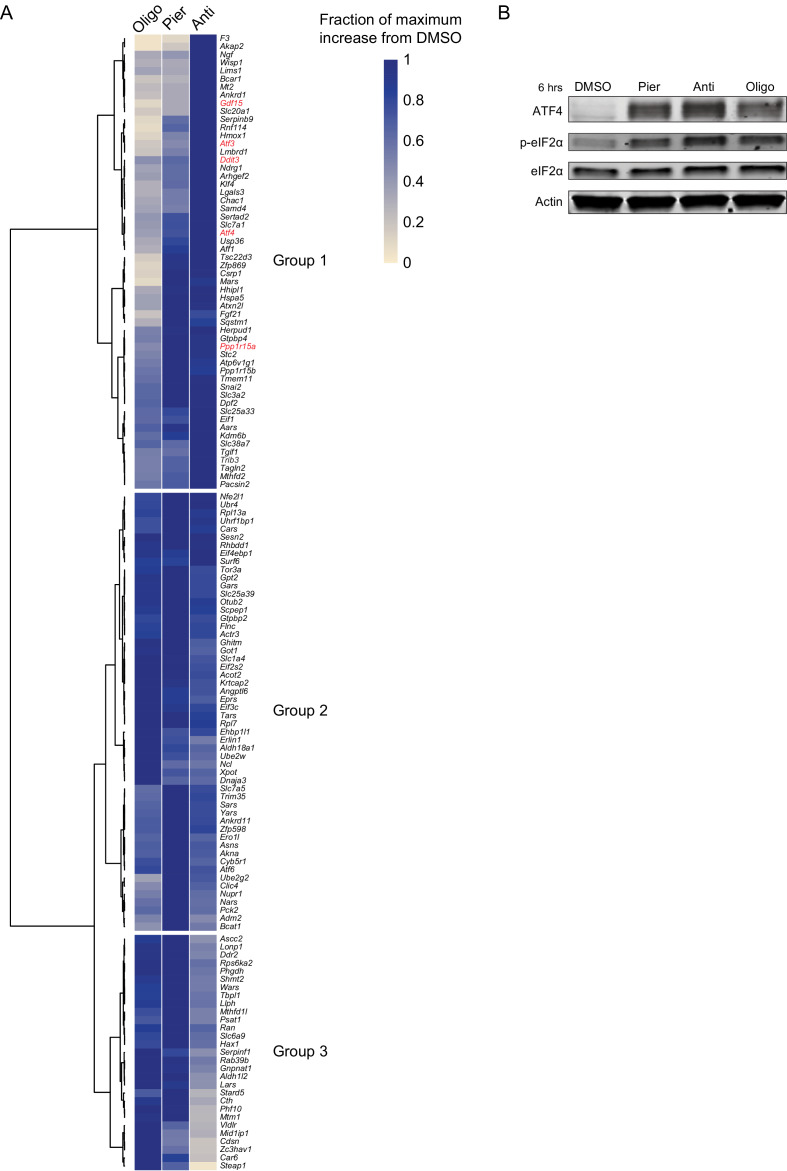
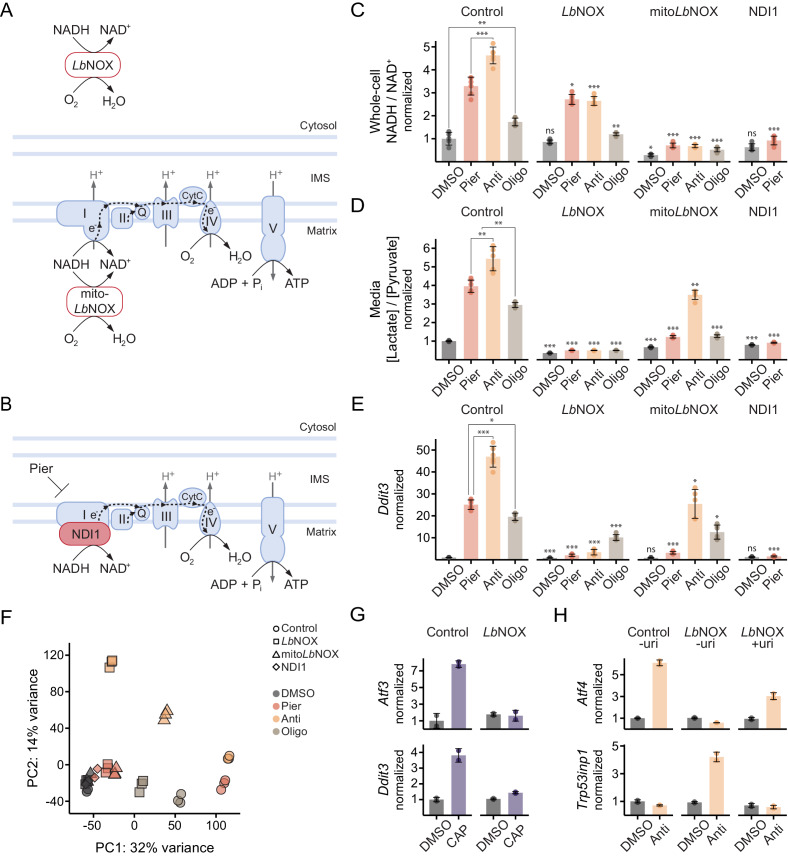
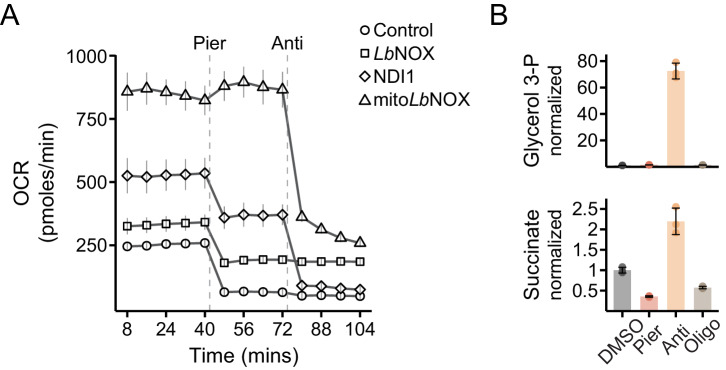
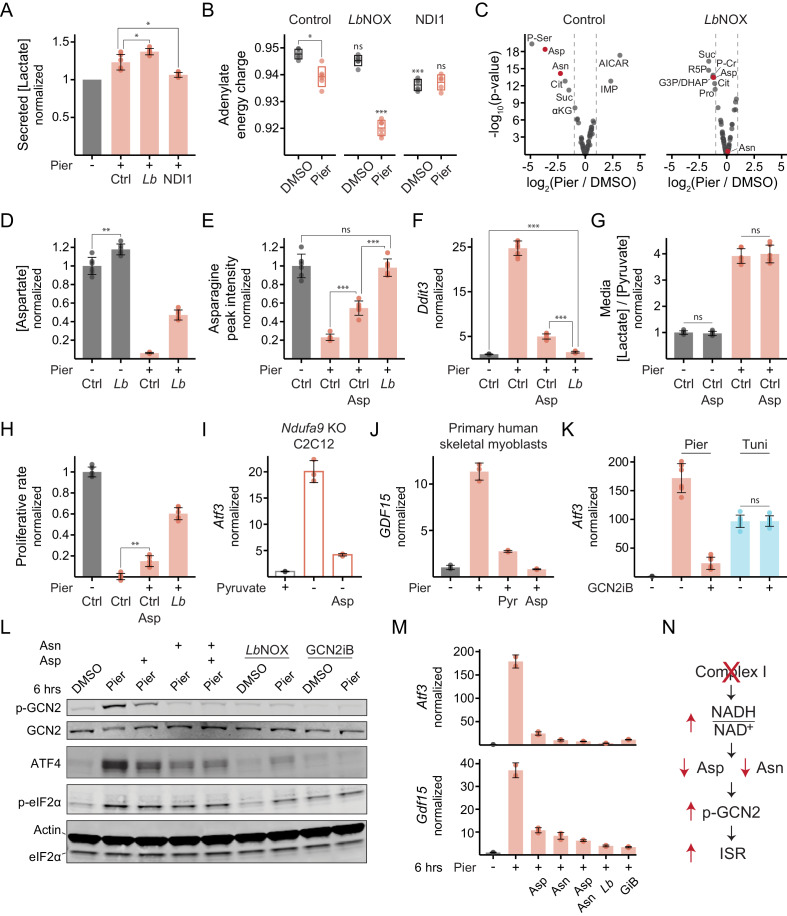
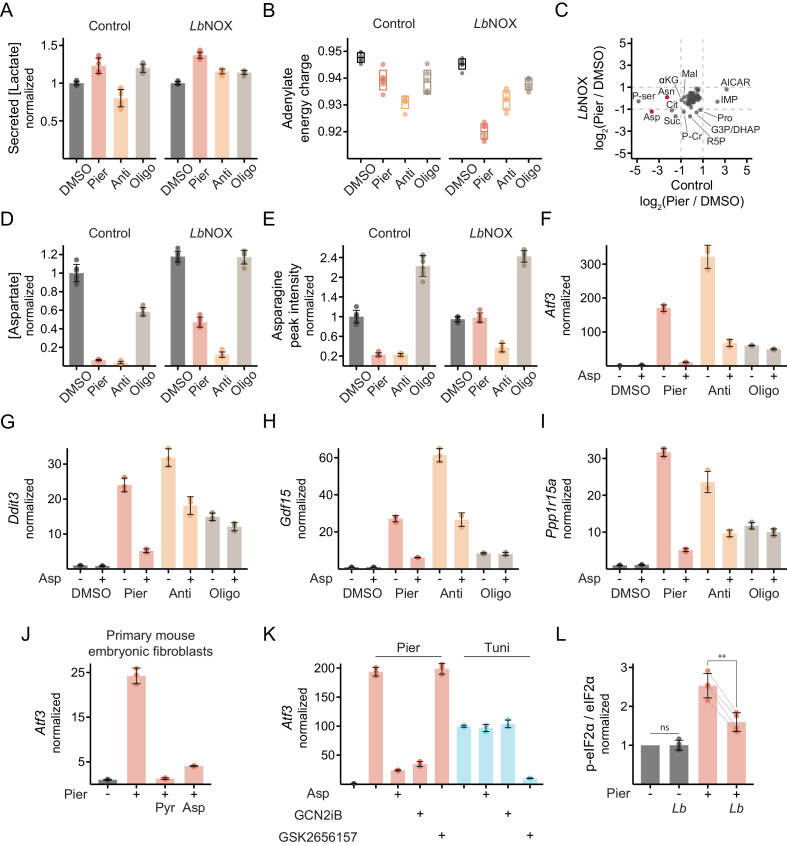
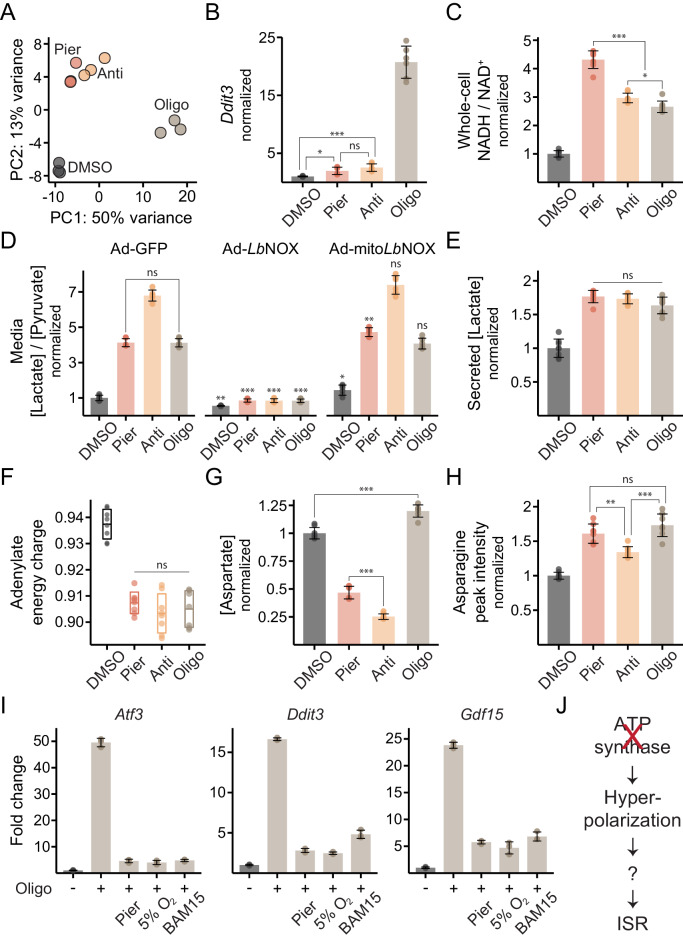
Mitochondrial dysfunction is associated with activation of the integrated stress response (ISR) but the underlying triggers remain unclear. We systematically combined acute mitochondrial inhibitors with genetic tools for compartment-specific NADH oxidation to trace mechanisms linking different forms of mitochondrial dysfunction to the ISR in proliferating mouse myoblasts and in differentiated myotubes. In myoblasts, we find that impaired NADH oxidation upon electron transport chain (ETC) inhibition depletes asparagine, activating the ISR via the eIF2α kinase GCN2. In myotubes, however, impaired NADH oxidation following ETC inhibition neither depletes asparagine nor activates the ISR, reflecting an altered metabolic state. ATP synthase inhibition in myotubes triggers the ISR via a distinct mechanism related to mitochondrial inner-membrane hyperpolarization. Our work dispels the notion of a universal path linking mitochondrial dysfunction to the ISR, instead revealing multiple paths that depend both on the nature of the mitochondrial defect and on the metabolic state of the cell.

Keywords: ATF4; GCN2; genetics; genomics; human; human biology; integrated stress response; medicine; metabolism; mitochondria; mouse; p53.


Conflict of interest statement

EM listed as an inventor on a patent filed by Massachusetts General Hospital on the therapeutic uses of GCN2 inhibitors. DT, RS, AJ No competing interests declared, OS a paid consultant for Proteinaceous Inc. VM listed as an inventor on a patent filed by Massachusetts General Hospital on the therapeutic uses of GCN2 inhibitors, and a paid advisor to Janssen Pharmaceuticals and 5am Ventures.

Figures

Figure 1.
Figure 1.. Interrogating the genomic response to mitochondrial dysfunction in proliferating and differentiated muscle cells.
(A) Phase contrast images of proliferating C2C12 myoblasts (left), post-mitotic cells cultured in low-serum media for 24 hr following confluence (middle), and differentiated myotubes (right). Scale bar denotes 200 μm. (B) Schematic of the ETC/OXPHOS system and the site of action of small-molecule inhibitors. Pier, piericidin; Anti, antimycin; Oligo, oligomycin. (C) Oxygen consumption rate (OCR) of myoblasts and myotubes acutely treated with mitochondrial inhibitors, normalized in each well to OCR prior to treatment (Untr., untreated). Mean ± SD, N = 7–9 from two experiments. The Games-Howell test was used for all pairwise comparisons. ns, p>0.05; ***, p<0.001. (D) Principal component analysis (PCA) of gene expression levels derived from RNA-seq in myoblasts and myotubes treated with inhibitors for 10 hr. N = 3.
Figure 2.
Figure 2.. Mechanistically distinct mitochondrial inhibitors trigger the ISR and depress proliferative gene expression in myoblasts.
(A) PCA of gene expression levels derived from RNA-seq in myoblasts treated with inhibitors for 10 hr. N = 3 (same samples as in Figure 1D). Pier, piericidin; Anti, antimycin; Oligo, oligomycin. Detailed results are provided in Supplementary file 1. (B) Enriched features in the promoters of the 500 genes with the most positive PC1 weights and the 500 genes with the most negative weights, based on iRegulon analysis of transcription factor binding motifs and ChIP-seq peaks. TF, transcription factor; NES, normalized enrichment score; # Targets, number of gene targets. Detailed results are provided in Supplementary file 2. (C) Gene set enrichment analysis of REACTOME pathways using PC1 weights as the gene ranks. Detailed results are provided in Figure 2—source data 1. (D) Volcano plot relating each gene’s PC1 weight (x-axis) and jackstraw P-value for significance of association with PC1 (y-axis). (E) Fold-change from DMSO derived from RNA-seq for representative ATF4/DDIT3 target genes strongly upregulated along PC1 (Atf3, activating transcription factor 3; Gdf15, growth/differentiation factor 15; Ddit3, DNA damage-inducible transcript 3). Mean ± SD. (F) Fold-change from DMSO derived from RNA-seq for representative cell cycle pathway genes (Ccne1, G1/S-specific cyclin-E1; Tk1, thymidine kinase, cytosolic) and a cholesterol pathway gene (Idi1, isopentenyl-diphosphate delta isomerase 1) strongly downregulated along PC1. Mean ± SD.
Figure 2—figure supplement 1.
Figure 2—figure supplement 1.. Additional data on transcriptional and protein markers of the ISR following mitochondrial inhibitor treatments in myoblasts.
(A) Heatmap of mean expression fold-changes derived from RNA-seq for upregulated ATF4/DDIT3 target genes most associated with PC1 (jackstraw p-value<0.0001). Atf4 was also included. Data was min-max normalized such that in each row, the treatment that elicited the maximum upregulation from the DMSO baseline was assigned the value one and the remaining treatments were assigned the fraction of the maximum upregulation they elicited. Rows (genes) were then hierarchically clustered based on Pearson correlation using Ward agglomeration. The first three branching points in the dendrogram define Groups 1–3, as referenced in the main text. Genes in red are used throughout this manuscript as markers of the ISR. See also Supplementary file 1. (B) Western blot of ATF4 and (p-)eIF2α in myoblasts treated for 6 hr as indicated. Pier, piericidin; Anti, antimycin; Oligo, oligomycin.
Figure 3.
Figure 3.. Oxidizing cytosolic NADH/NAD+ is sufficient to ablate ISR activation by complex I inhibition in myoblasts.
(A) Schematic of localization and activity of LbNOX and mitoLbNOX. IMS, intermembrane space. (B) Schematic of localization and activity of NDI1. (C) NADH/NAD+ in extracts of cells expressing luciferase (control), LbNOX, mitoLbNOX or NDI1 and treated with inhibitors for 1 hr. Data is normalized to DMSO in control cells. Mean ± SD, N = 5–6 from two experiments. Welch’s t-test (two-tailed) was used to compare each pair of treatments within control cells, as well as each treatment in the other cells with its equivalent in control cells (significance notations with no connecting lines), followed by Holm’s correction for multiple testing. (D) Media [lactate]/[pyruvate] following 2 hr treatments in control, LbNOX, mitoLbNOX or NDI1 cells. Data is normalized to DMSO in control cells. Mean ± SD, N = 5–6 from three experiments. Statistical analysis as in C. (E) qPCR of Ddit3 following 10 hr treatments in control, LbNOX, mitoLbNOX or NDI1 cells. Data is presented as fold-change from DMSO in control cells. Mean ± SD, N = 5–6 from two experiments. Statistical analysis as in C on the ΔΔCt values. (F) PCA of gene expression levels derived from RNA-seq in control, LbNOX, mitoLbNOX or NDI1 cells following 10 hr treatments, as indicated. Detailed results are provided in Supplementary files 1 and 2. (G) Fold-change from DMSO derived from RNA-seq for Atf3 and Ddit3 in control and LbNOX cells treated for 48 hr with chloramphenicol (CAP) in the presence of uridine. Mean ± SD, N = 2. (H) qPCR of Atf4 and Trp53inp1 in control and LbNOX cells following 10 hr antimycin treatment, with or without uridine (uri). Data is presented as fold-change from DMSO in control cells without uridine. Mean ± SD, N = 2. ns, p>0.05; *, p<0.05; **, p<0.01; ***, p<0.001.
Figure 3—figure supplement 1.
Figure 3—figure supplement 1.. Additional data on bioenergetics and metabolism in myoblast cell lines.
(A) Oxygen consumption rate (OCR) of control, LbNOX, mitoLbNOX or NDI1 cells sequentially treated with piericidin and antimycin. Mean ± SD, N = 4–5. (B) Peak intensities of glycerol 3-phosphate and succinate in extracts of control cells treated with inhibitors for 1 hr. Data is normalized to DMSO. Mean ± SD, N = 3.
Figure 4.
Figure 4.. Complex I inhibition in myoblasts triggers the ISR through the kinase GCN2 due to an aspartate and asparagine deficiency.
(A) Secreted [lactate] following 2 hr piericidin treatment in control (Ctrl), LbNOX (Lb) or NDI1 cells. Data is normalized to DMSO (-) separately for each cell line. Mean ± SD, N = 6 from three experiments (same samples as in Figure 3D). Welch’s t-test (two-tailed) was used to compare control with LbNOX and NDI1 cells, followed by Holm’s correction for multiple testing. (B) Adenylate energy charge following 1 hr piericidin treatment in control, LbNOX or NDI1 cells. Mean ± SD, N = 5–6 from two experiments. The Games-Howell test was used to make all pairwise comparisons. Notations with no connecting lines relate to the equivalent treatment in control cells. (C) Fold-change (x-axis) and statistical significance (y-axis) of metabolite differential abundance following 1 hr piericidin treatment in extracts of control or LbNOX cells. N = 3. P-Ser, phosphoserine; Asp, aspartate; Asn, asparagine; Cit, citrate; Suc, succinate; αKG, α-ketoglutarate; IMP, inosine monophosphate; AICAR, 5-aminoimidazole-4-carboxamide ribonucleotide; R5P, ribose 5-phosphate; G3P/DHAP, glyceraldehyde 3-phosphate and/or dihydroxyacetone phosphate; P-Cr, phosphocreatine; Pro, proline. Detailed results are provided in Figure 4—source data 1. (D) Intracellular [aspartate] following 1 hr piericidin treatment in control or LbNOX cells. Data is normalized to DMSO in control cells. Mean ± SD, N = 6 from two experiments (includes samples shown in C). The Games-Howell test was used for all pairwise comparisons. (E) Peak intensity of intracellular asparagine following 1 hr piericidin treatment in control cells, with or without aspartate, and in LbNOX cells. Data is normalized to DMSO in control cells. Mean ± SD, N = 6 from two experiments. The Games-Howell test was used for all pairwise comparisons. (F) qPCR of Ddit3 following 10 hr piericidin treatment in control cells, with or without aspartate, and in LbNOX cells. Data is presented as fold-change from DMSO in control cells. Mean ± SD, N = 8 from three experiments. The Games-Howell test was used to make all pairwise comparisons of ΔΔCt values. (G) Media [lactate]/[pyruvate] following 2 hr piericidin treatment, with or without aspartate, in control cells. Data is normalized to DMSO without aspartate. Mean ± SD, N = 6 from three experiments. Welch’s t-test (two-tailed) was used to compare each treatment with and without aspartate, followed by Holm’s correction. (H) Proliferative rate (doublings in 24 hr) of control cells, with or without aspartate, and of LbNOX cells following piericidin treatment. Data is normalized to DMSO in control cells. Mean ± SD, N = 5–6 from three experiments. The Games-Howell test was used for all pairwise comparisons. (I) qPCR of Atf3 following 10 hr pyruvate withdrawal, with or without aspartate, in Ndufa9-KO C2C12 myoblasts. Data is presented as fold-change from the condition with pyruvate (+). Mean ± SD, N = 3. (J) qPCR of GDF15 following 10 hr piericidin treatment, with or without pyruvate or aspartate, in primary human skeletal myoblasts. Data is presented as fold-change from DMSO. Mean ± SD, N = 3. (K) qPCR of Atf3 following 10 hr piericidin or tunicamycin (Tuni) treatment, with or without GCN2iB, in control cells. Data is presented as fold-change from DMSO. Mean ± SD, N = 6-7. Welch’s t-test (two-tailed) was used to compare each treatment with and without GCN2iB, followed by Holm’s correction. (L) Western blot of (p-)GCN2, ATF4 and (p-)eIF2α following 6 hr piericidin treatment in the indicated conditions in LbNOX cells. LbNOX expression was induced only where indicated. (M) qPCR of Atf3 and Gdf15 in the same cells and conditions shown in L. Data is presented as fold-change from DMSO. Mean ± SD, N = 2–3. GiB, GCN2iB. (N) Model for ISR activation by complex I inhibition in myoblasts. ns, p>0.05; *, p<0.05; **, p<0.01; ***, p<0.001.
Figure 4—figure supplement 1.
Figure 4—figure supplement 1.. Additional data on metabolic consequences that trigger the ISR in myoblasts.
(A) Secreted [lactate] following 2 hr inhibitor treatments in control or LbNOX cells. Data is normalized to DMSO separately in each cell line. Mean ± SD, N = 6 from three experiments (expanded version of Figure 4A). (B) Adenylate energy charge following 1 hr treatments in control or LbNOX cells. Mean ± SD, N = 5–6 from two experiments (expanded version of Figure 4B). (C) Scatter plot of intracellular metabolite fold-changes between piericidin and DMSO in control cells (x-axis) or LbNOX cells (y-axis). N = 3 replicates (same data as in Figure 4C). (D) Intracellular [aspartate] following 1 hr treatments in control or LbNOX cells. Mean ± SD, N = 6 from two experiments (expanded version of Figure 4D). (E) Peak intensity of intracellular asparagine following 1 hr treatments in control or LbNOX cells. Mean ± SD, N = 6 from two experiments (expanded version of Figure 4E). (F)-(I) qPCR of ISR-related transcripts following 10 hr treatments, with or without aspartate, in control cells. Data is presented as fold-change from DMSO without aspartate. Mean ± SD, N = 3. Ppp1r15a, protein phosphatase 1 regulatory subunit 15A. (J) qPCR of Atf3 following 10 hr piericidin treatment, with or without pyruvate or aspartate, in primary mouse embryonic fibroblasts. Data is presented as fold-change from DMSO (-). Mean ± SD, N = 3. (K) qPCR of Atf3 following 10 hr piericidin or tunicamycin treatment, with or without aspartate, GCN2iB or the PERK inhibitor GSK2656157, in control cells. Data is presented as fold-change from DMSO. Mean ± SD, N = 3. (L) Ratio of p-eIF2α to total eIF2α, measured by western blot, following 6 hr piericidin treatment in LbNOX cells. LbNOX expression was induced only where indicated. Data is normalized separately in each blot to the DMSO-treated sample not expressing LbNOX. Mean ± SD, N = 4 from four experiments. A one-sample t-test was used to examine whether the mean of DMSO-treated samples expressing LbNOX differed from 1, and Welch’s t-test (two-tailed, paired by blot) was used to compare the piericidin-treated samples with and without LbNOX expression. Holm’s correction was then applied. ns, p>0.05; **, p<0.01.
Figure 5.
Figure 5.. ATP synthase inhibition triggers the ISR in myotubes in a manner related to inner-membrane hyperpolarization.
(A) PCA of gene expression levels derived from RNA-seq in myotubes treated with inhibitors for 10 hr. N = 3 (same samples as in Figure 1D). Detailed results are provided in Supplementary file 1. (B) qPCR of Ddit3 following 10 hr treatments in myotubes. Data is presented as fold-change from DMSO. Mean ± SD, N = 6 from two experiments. The Games-Howell test was used for all pairwise comparisons of ΔΔCt values. (C) NADH/NAD+ in myotube extracts following 1 hr treatments. Data is normalized to DMSO. Mean ± SD, N = 8 from two experiments. The Games-Howell test was used for all pairwise comparisons. (D) Media [lactate]/[pyruvate] following 2 hr treatments in myotubes expressing GFP, LbNOX or mitoLbNOX using adenoviral transduction. Data is normalized to DMSO in GFP. Mean ± SD, N = 6 from three experiments. Welch’s t-test (two-tailed) was used to compare each pair of treatments within GFP cells, as well as each treatment in the other cells with its equivalent in GFP cells (significance notations with no connecting lines), followed by Holm’s correction for multiple testing. (E) Secreted [lactate] following 2 hr treatments in myotubes. Data is normalized to DMSO. Mean ± SD, N = 6 from three experiments (same samples as in D). (F) Adenylate energy charge following 1 hr treatments in myotubes. Mean ± SD, N = 7–8 from two experiments. The Games-Howell test was used for all pairwise comparisons. (G) Intracellular [aspartate] following 1 hr treatments in myotubes. Data is normalized to DMSO. Mean ± SD, N = 7–8 from two experiments. The Games-Howell test was used for all pairwise comparisons. (H) Peak intensity of intracellular asparagine following 1 hr treatments in myotubes. Data is normalized to DMSO. Mean ± SD, N = 8 from two experiments. The Games-Howell test was used for all pairwise comparisons. (I) Fold-change from DMSO derived from RNA-seq for Atf3, Ddit3 and Gdf15 in myotubes treated for 10 hr with oligomycin alone, or in combination with piericidin, BAM15 or 5% O2. Mean ± SD, N = 3. See also Supplementary file 1. (J) Model for ISR activation by ATP synthase inhibition in myotubes. ns, p>0.05; *, p<0.05; **, p<0.01; ***, p<0.001.
Figure 5—figure supplement 1.
Figure 5—figure supplement 1.. Additional data on ISR activation in myotubes.
(A) qPCR of Ddit3 following 10 hr inhibitor treatments in C2C12 myoblasts, post-mitotic cells and myotubes. Data is normalized to DMSO separately in each panel. Mean ± SD, N = 3 (myoblast samples are a subset of those previously shown in Figure 3E and myotube samples are a subset of those previously shown in Figure 5B). (B) qPCR of Ddit3 in myotubes treated for 48 hr with chloramphenicol (CAP). Data is presented as fold-change from DMSO. Mean ± SD, N = 5–6. (C) qPCR of Ddit3 in myotubes treated for 10 hr with DMSO or oligomycin in the presence of the indicated concentration of BAM15. Data is normalized to DMSO (-) with no BAM15. Mean ± SD, N = 2. (D) qPCR of Ddit3 in myotubes expressing GFP or LbNOX (Lb) and treated with oligomycin for 10 hr. Data is normalized to DMSO (-) in GFP. Mean ± SD, N = 3. Welch’s t-test (two-tailed) was used to compare oligomycin-treated samples expressing GFP and LbNOX. ns, p>0.05. See also Supplementary file 1. (E) qPCR of GDF15 in primary human myotubes treated for 10 hr with oligomycin alone, in combination with piericidin or in combination with BAM15. Data is presented as fold-change from DMSO. Mean ± SD, N = 3–6.

References

    1. Alcázar-Fabra M, Navas P, Brea-Calvo G. Coenzyme Q biosynthesis and its role in the respiratory chain structure. Biochimica Et Biophysica Acta (BBA) - Bioenergetics. 2016;1857:1073–1078. doi: 10.1016/j.bbabio.2016.03.010. - DOI - PubMed
    1. Alfadda A, DosSantos RA, Stepanyan Z, Marrif H, Silva JE. Mice with deletion of the mitochondrial glycerol-3-phosphate dehydrogenase gene exhibit a thrifty phenotype: effect of gender. American Journal of Physiology-Regulatory, Integrative and Comparative Physiology. 2004;287:R147–R156. doi: 10.1152/ajpregu.00103.2004. - DOI - PubMed
    1. Andrulis IL, Chiang CS, Arfin SM, Miner TA, Hatfield GW. Biochemical characterization of a mutant asparaginyl-tRNA synthetase from chinese hamster ovary cells. The Journal of Biological Chemistry. 1978;253:58–62. - PubMed
    1. Area-Gomez E, Guardia-Laguarta C, Schon EA, Przedborski S. Mitochondria, OxPhos, and neurodegeneration: cells are not just running out of gas. Journal of Clinical Investigation. 2019;129:34–45. doi: 10.1172/JCI120848. - DOI - PMC - PubMed
    1. Asher G, Lotem J, Cohen B, Sachs L, Shaul Y. Regulation of p53 stability and p53-dependent apoptosis by NADH quinone oxidoreductase 1. PNAS. 2001;98:1188–1193. doi: 10.1073/pnas.98.3.1188. - DOI - PMC - PubMed

Publication types

Associated data