. 2020 May 28:9:e56840.
doi: 10.7554/eLife.56840.

True S-cones are concentrated in the ventral mouse retina and wired for color detection in the upper visual field

Affiliations

True S-cones are concentrated in the ventral mouse retina and wired for color detection in the upper visual field

Francisco M Nadal-Nicolás et al. Elife. .

Abstract

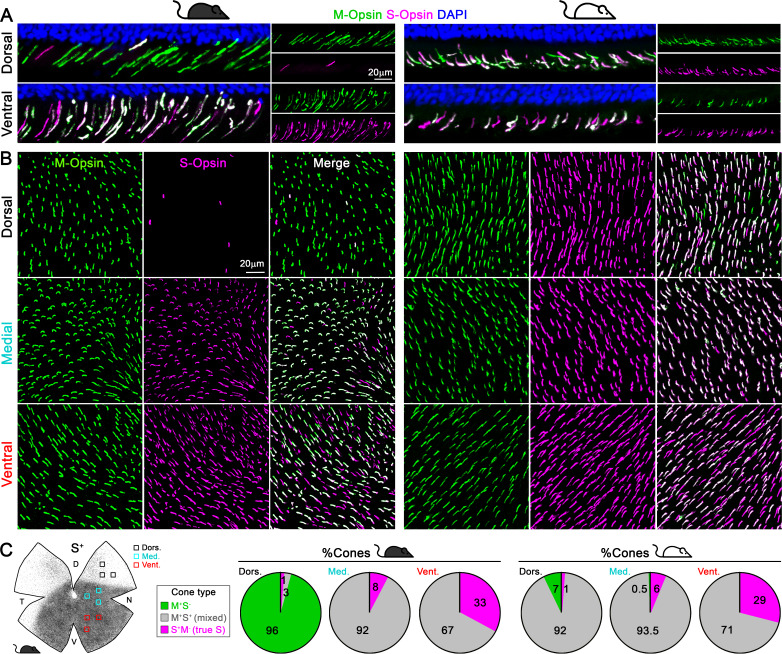
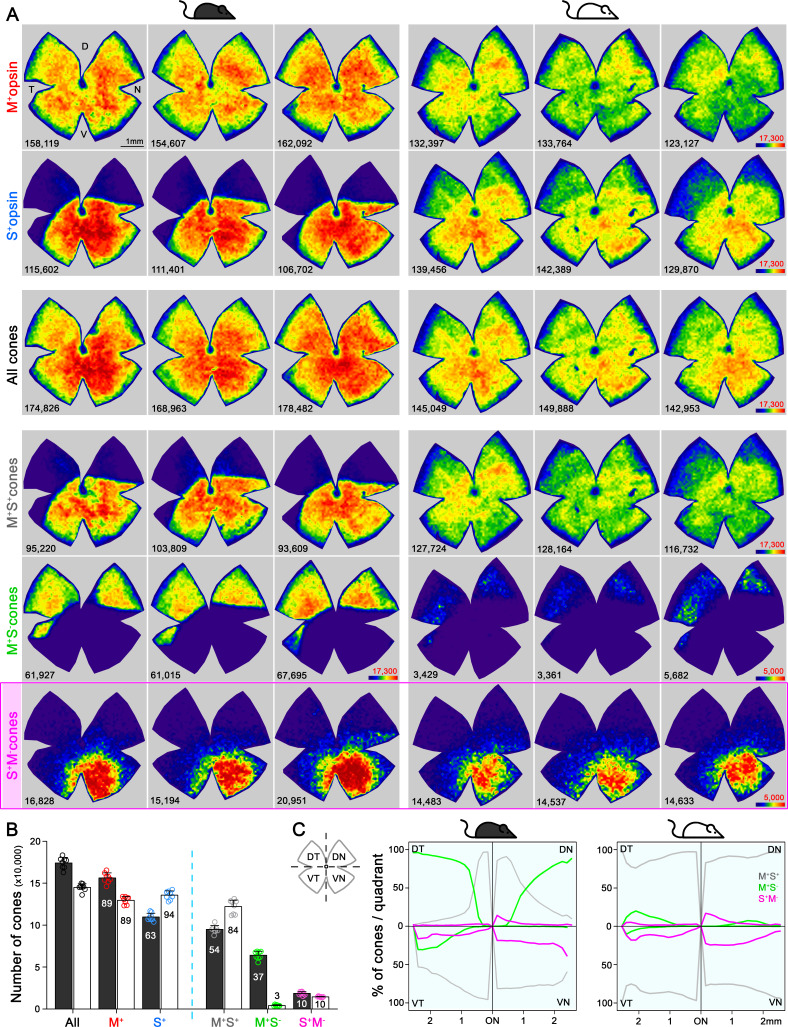
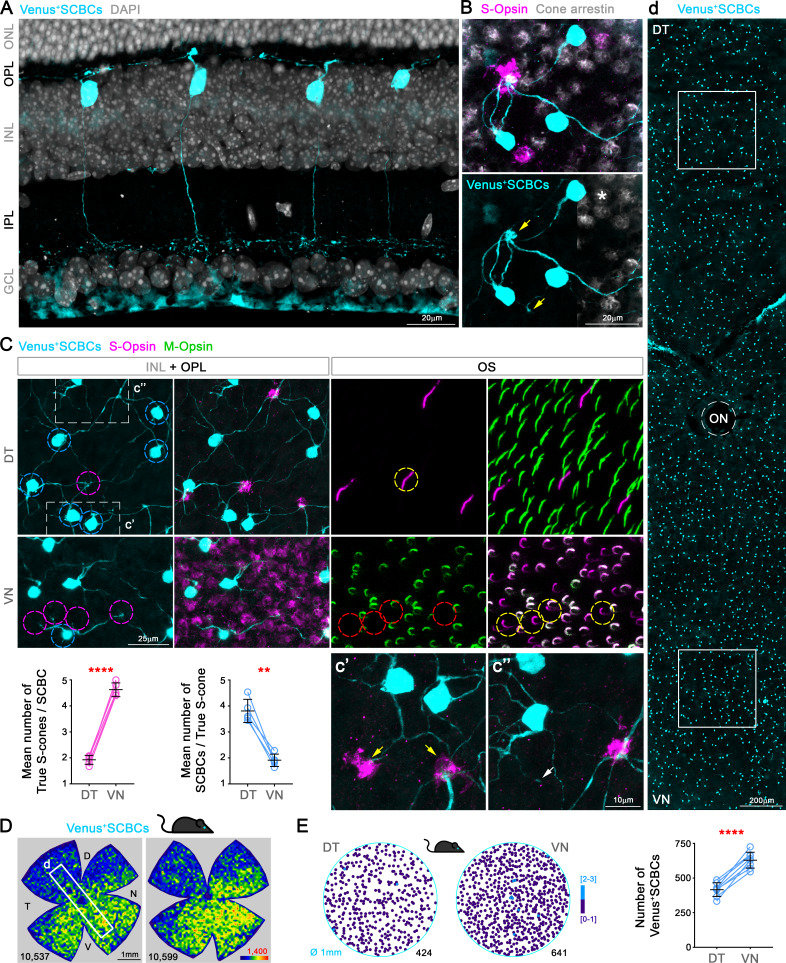
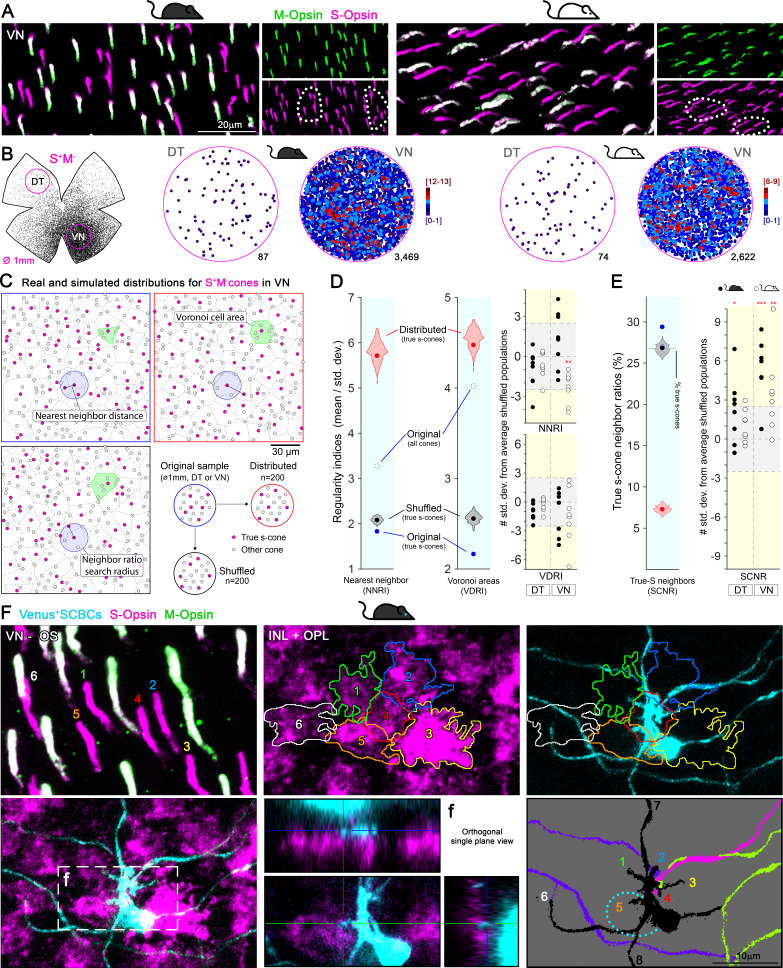
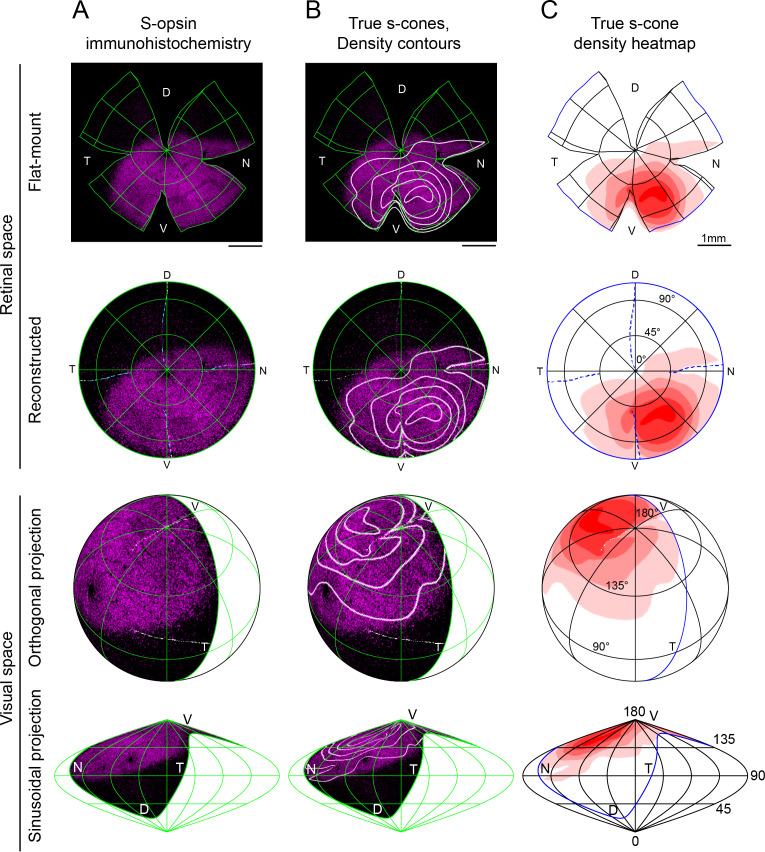
Color, an important visual cue for survival, is encoded by comparing signals from photoreceptors with different spectral sensitivities. The mouse retina expresses a short wavelength-sensitive and a middle/long wavelength-sensitive opsin (S- and M-opsin), forming opposing, overlapping gradients along the dorsal-ventral axis. Here, we analyzed the distribution of all cone types across the entire retina for two commonly used mouse strains. We found, unexpectedly, that 'true S-cones' (S-opsin only) are highly concentrated (up to 30% of cones) in ventral retina. Moreover, S-cone bipolar cells (SCBCs) are also skewed towards ventral retina, with wiring patterns matching the distribution of true S-cones. In addition, true S-cones in the ventral retina form clusters, which may augment synaptic input to SCBCs. Such a unique true S-cone and SCBC connecting pattern forms a basis for mouse color vision, likely reflecting evolutionary adaptation to enhance color coding for the upper visual field suitable for mice's habitat and behavior.

Keywords: blue bipolar cells; color vision; cone cluster; cone distribution; evolutionary biology; genuine s-cone; mammalian photoreceptor; mouse; neuroscience.

Plain language summary

Many primates, including humans, can see color better than most other mammals. This difference is due to the variety of light-detecting proteins – called opsins – that are produced in the eye by cells known as cones. While humans have three, mice only have two different opsins, known as S and M, which detect blue/UV and green light, respectively. Mouse cones produce either S-opsins, M-opsins or both. Fewer than 10 percent of cone cells in mice produce just the S-opsin, and these cells are essential for color vision. Mice are commonly used in scientific research, and so their vision has been well studied. However, previous research has produced conflicting results. Some studies report that cone cells that contain only S-opsin are evenly spread out across the retina. Other evidence suggests that color vision in mice exists only for the upper field of their vision, in other words, that mice can only distinguish colors that appeared above them. Nadal-Nicolás et al. set out to understand how to reconcile these contrasting findings. Molecular tools were used to detect S- and M-opsin in the retina of mice and revealed large differences between the lower part, known as the ventral retina, and the upper part, known as the dorsal retina. The ventral retina detects light coming from above the animal, and about a third of cone cells in this region produced exclusively S-opsin, compared to only 1 percent of cones in the dorsal retina. These S-opsin cone cells in the ventral retina group into clusters, where they connect with a special type of nerve cells that transmit this signal. To better understand these findings, Nadal-Nicolás et al. also studied albino mice. Although albino mice have a different distribution of S-opsin protein in the retina, the cone cells producing only S-opsin are similarly clustered in the ventral retina. This suggests that the concentration of S-opsin cone cells in the ventral retina is an important feature in mouse sight. This new finding corrects the misconception that S-opsin-only cone cells are evenly spread throughout the retina and supports the previous evidence that mouse color vision is greatest in the upper part of their field of vision. Nadal-Nicolás et al. suggest this arrangement could help the mice to detect predators that may attack them from above during the daytime. Together, these new findings could help to improve the design of future studies involving vision in mice and potentially other similar species.


Conflict of interest statement

FN, VK, JB, BP, AK, GZ, LD, WL No competing interests declared

Figures

Figure 1.
Figure 1.. Cone outer segments across retinal areas.
Immunodetection of M and S wavelength-sensitive opsins in retinal sections (A) and flat-mount retinas (B) in two mouse strains (pigmented and albino mice, left and right columns respectively). (C) Retinal scheme of S-opsin expression used for image sampling to quantify and classify cones in three different retinal regions. Pie graphs showing the percentage of cones manually classified as M+S- (green), S+M- (true S, magenta) and M+S+ (mixed, gray) based on the opsin expression in different retinal areas from four retinas per strain. Black mouse: pigmented mouse strain (C57BL6), white mouse: albino mouse strain (CD1).
Figure 2.
Figure 2.. Topography and total number of different opsins (M+, S+) and cone-type populations in the whole mouse retina.
(A) Density maps depicting the distributions of different opsins expressing cones (M+ and S+) and different cone populations classified anatomically as: All, M+S+ (mixed), M+S-, S+M- (true S) cones in pigmented and albino mice (left and right side respectively). Each column shows different cone populations from the same retina and, at the bottom of each map is shown the number of quantified cones. Color scales are shown in the right panel of each row (from 0 [purple] to 17,300 [dark red] for all cone types except to 5000 cones/mm2 [dark red] for the true S-cones and M+S--cone in the albino strain). Retinal orientation depicted by D: dorsal, N: nasal, T: temporal, V: ventral. (B) Histogram showing the mean ± standard deviation of different cone subtypes for eight retinas per strain (Supplementary file 1B). The percentages of each cone subtype are indicated inside of each bar, where 100% indicates the total of the ‘all cones’ group. (C) Opsin expression profile across the different retinal quadrants (retinal scheme, DT: dorsotemporal, DN: dorsonasal, VT: ventrotemporal, VN: ventronasal). Line graphs show the spatial profile of relative opsins expression (mixed [gray], M+S- [green], true S-cones [magenta]), where the sum of these three cone populations at a given distance from the optic nerve (ON) head equals 100%. Black mouse: pigmented mouse strain, white mouse: albino mouse strain.
Figure 2—figure supplement 1.
Figure 2—figure supplement 1.. Validation of automatic routine for cone outer segment quantification.
(A) Retinal photomontages for M- and S-opsin signal in the same pigmented retina (correspond to second column in Figure 2A). The square depicts an area of interest selected (transition zone of S-opsin expression) to perform the automatic routine validation by comparing manual and automatic quantifications. The images processed by the automatic routine using ImageJ show the selection of positive objects from the corresponding original image. (B) X, Y graph showing the linear correlation (Pearson coefficient, (R2) between manual and automatic quantifications. 21,898 M+ and 13,705 S+cones were manually annotated while 21,689 M+ and 13,661 S+cones were automatically identified in 3 random images obtained from 5 retinal photomontages. (C) All, mixed, M+S-- and true S-cone populations are extracted from the original M- and S-cone images. All-cones were quantified after overlapping M- and S-signals. mixed (M+S+) cones were obtained by subtracting the background of the S-opsin image in the M-opsin one. M+S- cones for pigmented mice are obtained after subtracting the S-opsin signal to the M-opsin photomontage. Finally, M+S- cones for albino and true S-cones (S+M-), in both strains, are manually marked on the retinal photomontage (Adobe Photoshop CC). The B and W images show the processed image after quantifying automatically. At the bottom of each image is shown the number of quantified cones. Black mouse: pigmented mouse strain.
Figure 3.
Figure 3.. S-cone Bipolar cells (SCBCs) in Cpne9-Venus mouse retina.
(A) Retinal cross section showing the characteristic morphology of SCBCs (Behrens et al., 2016; Breuninger et al., 2011). (B) Detailed view of the selective connectivity between Venus+SCBCs and true S-cone terminals (yellow arrows). Note that SCBCs avoid contacts with cone terminals lacking S-opsin expression (M+S--cone pedicles, identified using cone arrestin), as well as a mixed cone pedicle, marked with an asterisk. In fact, on the contrary, the SCBCs prefer to develop multiple contacts to the same true S-cone pedicle. (C) Images from flat-mount retinas focused on the inner nuclear and outer plexiform layers (INL+OPL) or in the photoreceptor outer segment (OS) layer of the corresponding area. Magnifications showing divergent and convergent connectivity patterns from true S-cone pedicles in dorsal and ventral retinal domains, respectively. In the DT retina, six Venus+ SCBCs (cyan circles) contact a single true S-cone pedicle (magenta circle in DT); while one Venus+ SCBC contacts at least four true S-cone pedicles in the VN retina (magenta circles in VN), which belong to cones possessing S+M-OSs (yellow circles). Connectivity between true S-cones and SCBCs in DT and VN retina was assessed as the average number of true S-cone pedicles contacting a single SCBC per retina (magenta plot) or the average number of SCBCs contacting a single true S-cone pedicle per retina (cyan plot) (p<0.0001, p<0.01, respectively; n = 5). (c’) Detailed view of a secondary SCBC bifurcation contacting independently two true S-cone pedicles. (c”) Detailed view of a ‘blind’ SCBC process. (D) Density maps depicting the distributions of SCBCs in Cpne9-Venus mice. (d) Venus+ SCBCs along the DT-VN axis from a flat-mount retina (corresponding to the white frame in D) showing the gradual increase of SCBCs towards the VN retina where true S-cone density peaks (last row in Figure 2A). (E) Demonstration of Venus+ SCBC densities color-coded by the k-nearest neighbor algorithm according to the number of other Venus+ SCBCs found within an 18 μm radius in two circular areas of interest (DT and VN). Although, Venus+ SCBCs exhibit a sparse density without forming clusters (circular maps), they were significantly denser in VN retina (p<0.0001; n = 8).
Figure 4.
Figure 4.. Clustering of true S-cones in the ventronasal (VN) retina.
(A) Retinal magnifications from flat-mount retinas demonstrating grouping of true S-cones in the VN area, where true S-cone density peaks. White dashed lines depict independent groups of true S-cones that are not commingled with mixed cones (M+S+, white outer segments in the merged image). (B) Retinal scheme of true S-cones used for selecting two circular areas of interest along the dorsotemporal-ventronasal (DT-VN) axis. Circular maps demonstrate true S-cone clustering in these regions. True S-cone locations are color-coded by the k-nearest neighbor algorithm according to the number of other true S-cones found within an 18 μm radius. (C–E) Analytical comparisons of DT and VN populations of true S-cones to their simulated alternatives. (C) Example real and simulated true S-cone populations and their quantification. Images depict true S-cone locations (magenta dots) and boundaries of their Voronoi cells (dashed lines) from original and example simulated (‘distributed’, ‘shuffled’) cone populations. Gray dots indicate the locations of other cone types. Observed cone locations were used for all simulated populations; only their cone identities were changed. The annotated features are examples of those measurements used in the calculations presented in D-E. (D) Comparison of sample regularity indices for one albino VN retinal sample to violin plots of those values observed for n = 200 simulated cone populations. Note that average regularity indices for true S-cones were lower than that of shuffled populations, whereas those values lay between shuffled and distributed populations when all cones were considered. Plots on the right show values for all actual retinal samples normalized using the mean and standard deviations of their simulated ‘shuffled’ counterparts. The y-axis range corresponding to ±2.5 standard deviations from the mean (i.e., that containing ~99% of shuffled samples) is highlighted in gray. (E) Comparison of the real average SCNR for the example in C-D to those values for its simulated counterparts. Note that the average SCNR for all cones in this sample was equal to that predicted by random chance (i.e., the ratio of true S-cones to all cones), which in turn was equal to the average for true S-cones for shuffled samples. In contrast, the real true S-cone SCNR was higher. Plot on the right shows true S-cone SCNR values for all samples, normalized as described for D. (F) Convergent connectivity from a true S-cone cluster to a single SCBC in the VN retina. Images of a true S-cone cluster, in a flat-mount retina, focused on the photoreceptor outer segment layer and the inner nuclear-outer plexiform layers (INL+OPL). The upper left panel show the numerical and colored identification of each true S-outer segment in the cluster (note that the number positions indicate the locations where outer segments contact the photoreceptor inner segment). Each true S-cone pedicle belonging to this cluster is outlined and color coded (middle upper panel) and are overlaid upon the SCBC dendritic profile (right upper panel). To identify synaptic contacts between the SCBC and the cone pedicles (maximum intensity projection -excluding the SCBC soma- shown in lower left panel), we acquired orthogonal single plane views zooming into putative dendritic tips. An example for the contact with cone #5 is shown in lower middle panel, corresponding to the box area in lower left panel (f). The lower right panel shows dendritic endings of this SBCB (black) contacting the marked cones (#1–6). It also contacts two additional cones outside of the field of view (#7,8). Dashed line depicts the soma of the SCBC. Dendrites from other SCBCs are color coded for differentiation.
Figure 4—figure supplement 1.
Figure 4—figure supplement 1.. Reconstruction and mapping of true S-cone densities into visual space.
Representative left eye from a 3-month-old pigmented mouse (C57). (A) S-opsin antibody labeling; (B) true s-cone density contour lines separated by quintiles overlaid onto s-opsin labeling; (C) quintile heatmap contours of true s-cone density. The top two rows demonstrate the flat-mount retina with marks for edges and relaxing cuts, followed by its reconstruction into uncut retinal space with lines of latitude and longitude that have been projected onto the flat-mount. The bottom two rows show the reconstructed retina inverted into visual space using orthogonal and sinusoidal projections. For these views, eye orientation angles for elevation and azimuth of 22° and 64°, respectively, have been used as in Sterratt et al., 2013. For orthogonal projections, the globe has been rotated forward by 50° to emphasize the relationship of true S-cone densities to the upper pole of the visual field. S-opsin labeling is restricted to the upper visual field, but true S-cones are concentrated toward its lateral edges.

References

    1. Ahnelt PK, Fernández E, Martinez O, Bolea JA, Kübber-Heiss A. Irregular S-cone mosaics in felid retinas spatial interaction with axonless horizontal cells, revealed by cross correlation. Journal of the Optical Society of America A. 2000;17:580–588. doi: 10.1364/JOSAA.17.000580. - DOI - PubMed
    1. Ahnelt PK, Schubert C, Kübber-Heiss A, Schiviz A, Anger E. Independent variation of retinal S and M cone photoreceptor topographies: a survey of four families of mammals. Visual Neuroscience. 2006;23:429–435. doi: 10.1017/S095252380623342X. - DOI - PubMed
    1. Ahnelt PK, Kolb H. The mammalian photoreceptor mosaic-adaptive design. Progress in Retinal and Eye Research. 2000;19:711–777. doi: 10.1016/S1350-9462(00)00012-4. - DOI - PubMed
    1. Altimus CM, Güler AD, Villa KL, McNeill DS, Legates TA, Hattar S. Rods-cones and melanopsin detect light and dark to modulate sleep independent of image formation. PNAS. 2008;105:19998–20003. doi: 10.1073/pnas.0808312105. - DOI - PMC - PubMed
    1. Applebury ML, Antoch MP, Baxter LC, Chun LL, Falk JD, Farhangfar F, Kage K, Krzystolik MG, Lyass LA, Robbins JT. The murine cone photoreceptor: a single cone type expresses both S and M opsins with retinal spatial patterning. Neuron. 2000;27:513–523. doi: 10.1016/s0896-6273(00)00062-3. - DOI - PubMed

Publication types