

doi: 10.1111/anae.15151.
Epub 2020 Jun 19.
Managing the R0 of COVID-19: mathematics fights back
Affiliations
- PMID: 32463522
- PMCID: PMC7283796
- DOI: 10.1111/anae.15151
Item in Clipboard
Managing the R0 of COVID-19: mathematics fights back
Anaesthesia.
2020 Dec.
No abstract available
Figures
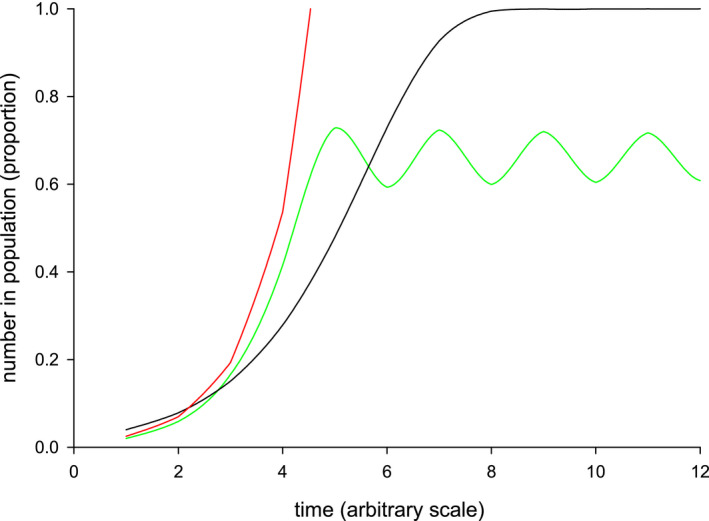
Three models of population (viral) growth: exponential (Eqn 1; red), logistic (Eqn 2, black) and logistic map (Eqn 3, green). Different values have been used to separate the lines. Note that whereas in exponential, R0 value is constant, it varies for the other two models depending on the time‐point it is measured

Example of an SIR model plot for a hypothetical infectious disease. The green curve is the susceptible population; the red curve is the infected, and the black curve is the recovered. Note the inverse relationship between the susceptible and recovered, with the infected being the balance

Estimate of the proportion of population needed to be immune to achieve herd immunity, as a function of R0. Note that for R0 < 2, the relationship is very steep with < 50% of population needing immunity,
Comment in
-
Measuring R0.Anaesthesia. 2021 Mar;76 Suppl 3:26. doi: 10.1111/anae.15351. Epub 2020 Dec 23. Anaesthesia. 2021. PMID: 33253474 No abstract available.
References
-
- Box GEP. Science and statistics. Journal of the American Statistical Association 1976; 71: 791–9.
-
- May RM, Anderson B. Infectious Diseases of Humans: Dynamics and Control. Oxford: Oxford University Press, 1992.
-
- Cramer JS. The early origins of the logit model. Studies in History and Philosophy of Science 2004; 35: 613–26.
-
- May RM. Simple mathematical models with very complicated dynamics. Nature 1976; 261: 459–67. - PubMed
MeSH terms
LinkOut - more resources
Full Text Sources
