Impaired immune cell cytotoxicity in severe COVID-19 is IL-6 dependent
- PMID: 32463803
- PMCID: PMC7456250
- DOI: 10.1172/JCI138554
Impaired immune cell cytotoxicity in severe COVID-19 is IL-6 dependent
Abstract
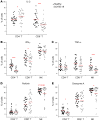
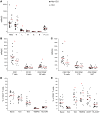
BACKGROUNDCoronavirus disease 19 (COVID-19) is an emerging infectious disease caused by SARS-CoV-2. Antiviral immune response is crucial to achieve pathogen clearance; however, in some patients an excessive and aberrant host immune response can lead to an acute respiratory distress syndrome. The comprehension of the mechanisms that regulate pathogen elimination, immunity, and pathology is essential to better characterize disease progression and widen the spectrum of therapeutic options.METHODSWe performed a flow cytometric characterization of immune cell subsets from 30 patients with COVID-19 and correlated these data with clinical outcomes.RESULTSPatients with COVID-19 showed decreased numbers of circulating T, B, and NK cells and exhibited a skewing of CD8+ T cells toward a terminally differentiated/senescent phenotype. In agreement, CD4+ T and CD8+ T, but also NK cells, displayed reduced antiviral cytokine production capability. Moreover, a reduced cytotoxic potential was identified in patients with COVID-19, particularly in those who required intensive care. The latter group of patients also showed increased serum IL-6 levels that inversely correlated to the frequency of granzyme A-expressing NK cells. Off-label treatment with tocilizumab restored the cytotoxic potential of NK cells.CONCLUSIONThe association between IL-6 serum levels and the impairment of cytotoxic activity suggests the possibility that targeting this cytokine may restore antiviral mechanisms.FUNDINGThis study was supported by funds from the Department of Experimental and Clinical Medicine of University of Florence (the ex-60% fund and the "Excellence Departments 2018-2022 Project") derived from Ministero dell'Istruzione, dell'Università e della Ricerca (Italy).
Keywords: Cellular immune response; Cytokines; Immunology; Infectious disease; NK cells.
Conflict of interest statement
Figures


Similar articles
-
COVID-19 pneumonia: CD8+ T and NK cells are decreased in number but compensatory increased in cytotoxic potential.Clin Immunol. 2020 Sep;218:108516. doi: 10.1016/j.clim.2020.108516. Epub 2020 Jun 20. Clin Immunol. 2020. PMID: 32574709 Free PMC article.
-
Clinical Characteristics and Immune Injury Mechanisms in 71 Patients with COVID-19.mSphere. 2020 Jul 15;5(4):e00362-20. doi: 10.1128/mSphere.00362-20. mSphere. 2020. PMID: 32669467 Free PMC article.
-
The laboratory tests and host immunity of COVID-19 patients with different severity of illness.JCI Insight. 2020 May 21;5(10):e137799. doi: 10.1172/jci.insight.137799. JCI Insight. 2020. PMID: 32324595 Free PMC article.
-
Lymphopenia in COVID-19: Therapeutic opportunities.Cell Biol Int. 2020 Sep;44(9):1792-1797. doi: 10.1002/cbin.11403. Epub 2020 Jun 3. Cell Biol Int. 2020. PMID: 32458561 Free PMC article. Review.
-
The Management of Cytokine Storm in COVID-19.Acta Med Indones. 2020 Jul;52(3):306-313. Acta Med Indones. 2020. PMID: 33020343 Review.
Cited by
-
COVID-19 and Obesity: Dangerous Liaisons.J Clin Med. 2020 Aug 4;9(8):2511. doi: 10.3390/jcm9082511. J Clin Med. 2020. PMID: 32759719 Free PMC article. Review.
-
Different T cell related immunological profiles in COVID-19 patients compared to healthy controls.Int Immunopharmacol. 2021 Aug;97:107828. doi: 10.1016/j.intimp.2021.107828. Epub 2021 May 28. Int Immunopharmacol. 2021. PMID: 34091116 Free PMC article.
-
Distinct soluble immune checkpoint profiles characterize COVID-19 severity, mortality and SARS-CoV-2 variant infections.Front Immunol. 2024 Sep 23;15:1464480. doi: 10.3389/fimmu.2024.1464480. eCollection 2024. Front Immunol. 2024. PMID: 39376569 Free PMC article.
-
Quantitative and qualitative alterations of circulating myeloid cells and plasmacytoid DC in SARS-CoV-2 infection.Immunology. 2020 Dec;161(4):345-353. doi: 10.1111/imm.13254. Epub 2020 Oct 6. Immunology. 2020. PMID: 32870529 Free PMC article.
-
Delivery Routes for COVID-19 Vaccines.Vaccines (Basel). 2021 May 19;9(5):524. doi: 10.3390/vaccines9050524. Vaccines (Basel). 2021. PMID: 34069359 Free PMC article. Review.
References
-
- WHO. WHO director-general’s opening remarks at the media briefing on COVID-19 - 11 March 2020. https://www.who.int/dg/speeches/detail/who-director-general-s-opening-re... Updated March 11, 2020. Accessed June 15, 2020.
-
- WHO. Coronavirus disease 2019 (COVID-19) situation report – 162. https://www.who.int/docs/default-source/coronaviruse/20200630-covid-19-s... Updated June 30, 2020. Accessed June 30, 2020.
Publication types
MeSH terms
Substances
LinkOut - more resources
Full Text Sources
Research Materials
Miscellaneous

