. 2020 May 28;18(5):e3000676.
doi: 10.1371/journal.pbio.3000676. eCollection 2020 May.

The haemodynamics of the human placenta in utero

Affiliations

The haemodynamics of the human placenta in utero

Neele S Dellschaft et al. PLoS Biol. .

Abstract

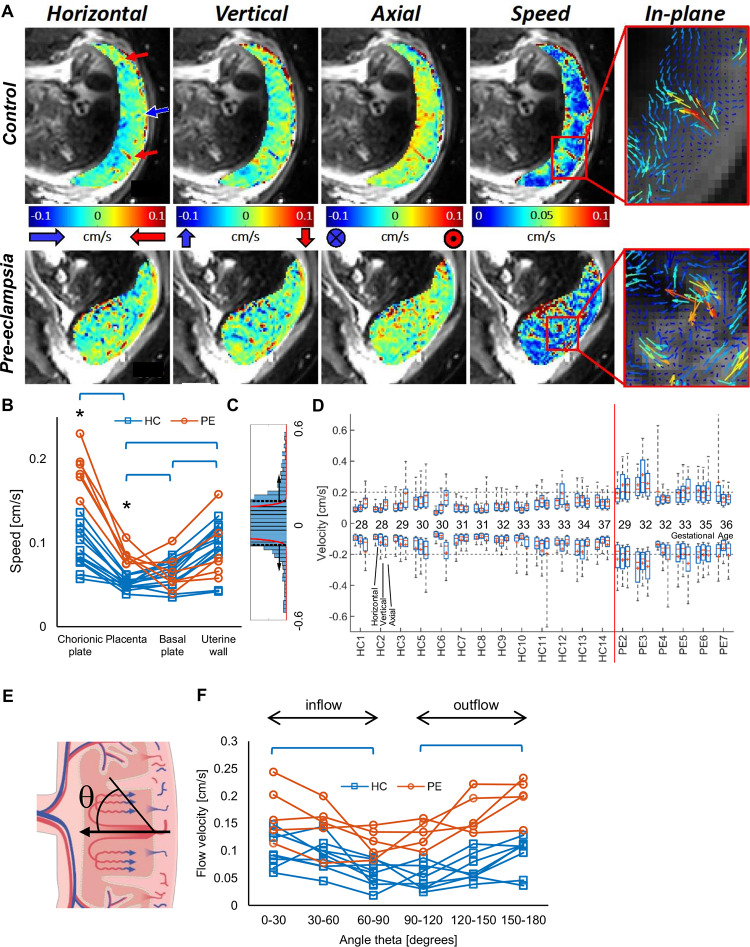
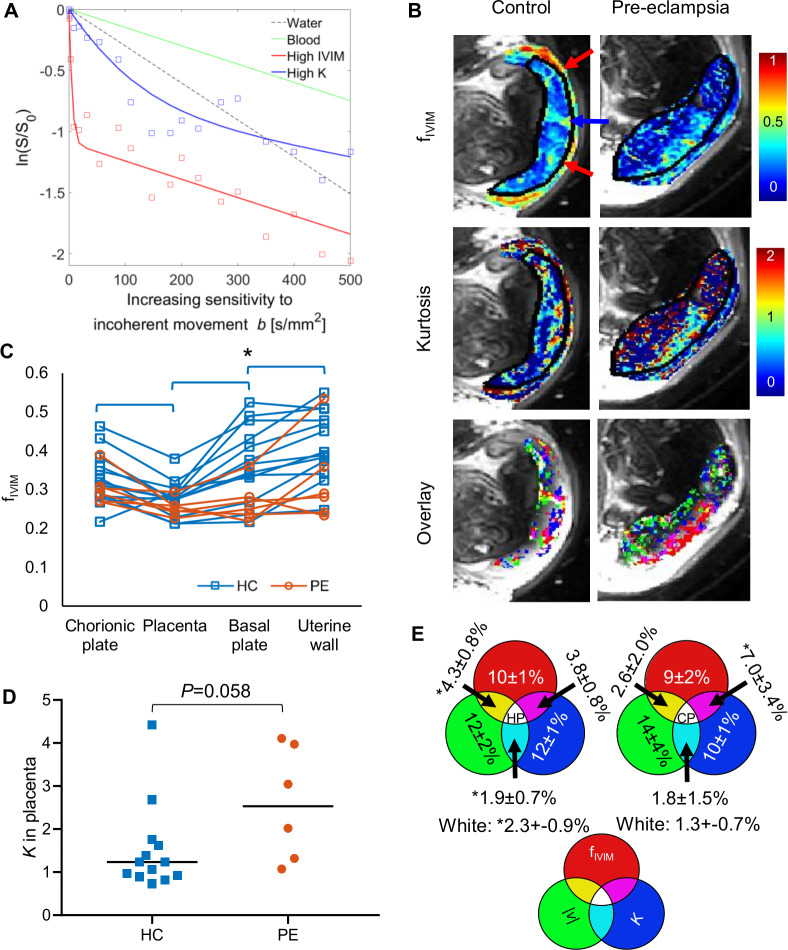
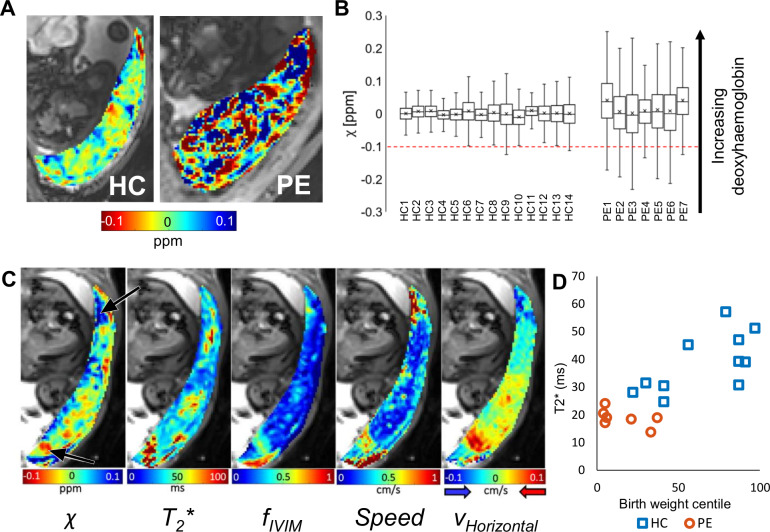
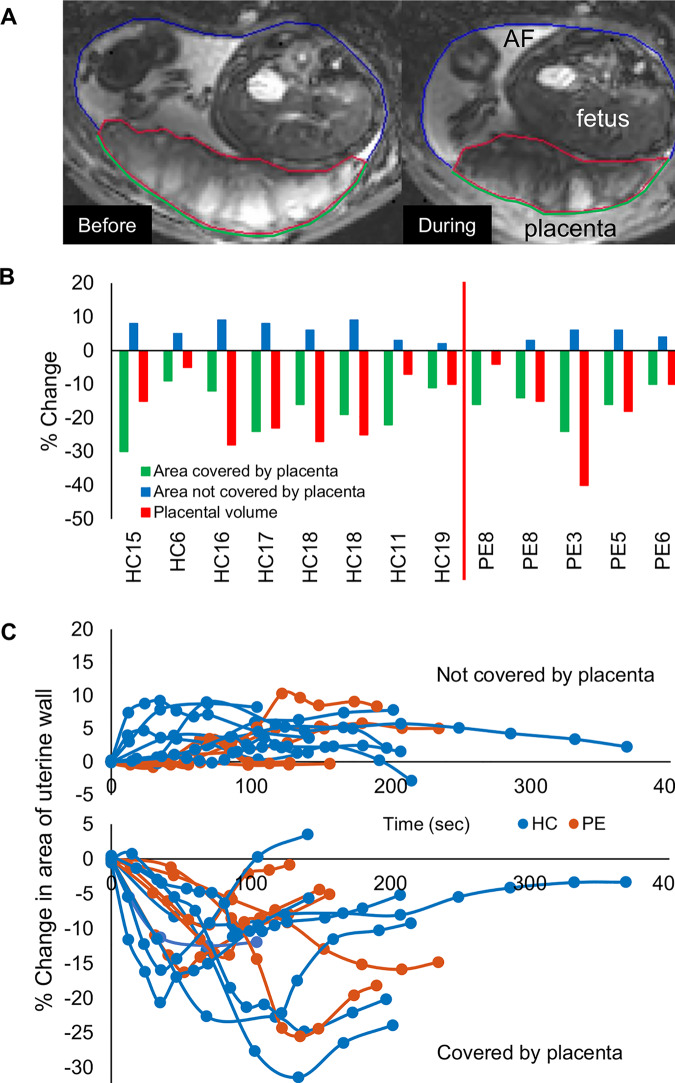
We have used magnetic resonance imaging (MRI) to provide important new insights into the function of the human placenta in utero. We have measured slow net flow and high net oxygenation in the placenta in vivo, which are consistent with efficient delivery of oxygen from mother to fetus. Our experimental evidence substantiates previous hypotheses on the effects of spiral artery remodelling in utero and also indicates rapid venous drainage from the placenta, which is important because this outflow has been largely neglected in the past. Furthermore, beyond Braxton Hicks contractions, which involve the entire uterus, we have identified a new physiological phenomenon, the 'utero-placental pump', by which the placenta and underlying uterine wall contract independently of the rest of the uterus, expelling maternal blood from the intervillous space.


Conflict of interest statement

The authors have declared that no competing interests exist.

Figures

Fig 1
Fig 1
(A) Schematic showing blood movement through the placenta. Maternal blood enters the placenta via the spiral arteries before percolating through the IVS and then exiting through myometrial veins. Fetal blood flows through fetal vessels that cross the chorionic plate, before passing into stem villi (where fetal veins and arteries are closely apposed). Stem villi repeatedly branch to form the looped capillaries of the terminal villi so that maternal and fetal blood supplies are in close proximity without mixing. (B) Typical ROIs used in the analysis shaded in colour on an MRI scan (the purple area corresponds to the placental ROI); F and AF are also indicated. AF, amniotic fluid; F, fetus; IVS, intervillous space; MRI, magnetic resonance imaging; ROI, region of interest.
Fig 2
Fig 2. Net velocity of flow through the placenta.
(A) Maps of velocity across the placenta for participants HC3 (top) and PE6 (bottom) showing velocity in three orthogonal directions, net speed (|v|), and quiver plots that illustrate the direction and magnitude of blood flow within the imaging plane. (B) Speed of blood movement averaged across each ROI for each participant (* indicates significant difference between HC and PE; brackets indicate significant difference between ROIs for HC participants only; S3 Table). (C) The distribution of one component of velocity across the placental ROI for one HC, magnified to illustrate the tails of the histogram. The red curve indicates a normal distribution fitted to data within one standard deviation of the full histogram, and the dashed lines indicate four standard deviations from the centre of that fitted peak; voxels beyond these dashed lines were identified as fast-moving voxels. (D) The median (−), mean (+), interquartile range (box), and absolute range of the horizontal, vertical, and axial velocity in these fast-moving voxels. (E) The velocity of flow within the placenta in a narrow band adjacent to the basal plate, binned by direction of flow with respect to the normal to the basal plate, (F) showing that the highest velocities are perpendicular to the basal plate for both inflow and outflow. Underlying data plotted in panels B, D, and F are provided in S1 Data. HC, healthy control pregnancy; PE, preeclamptic pregnancy; ROI, region of interest.
Fig 3
Fig 3. Incoherent flow in the placenta and its relationship to regions of high coherent flow.
(A) Variation of signal with increasing sensitivity to incoherent movement (termed b-value in MRI). The black line shows the decay expected for unrestricted diffusion in stationary water. The green line illustrates slower decay typical of restricted diffusion by cells in blood samples [31]. The other curves show example placental data fitted to Eq 1. The red curve shows fast decay at low b-values caused by blood moving incoherently within a voxel, for instance, because of turbulence. The blue curve shows faster decay than expected due to diffusion in static blood, suggesting that flow is causing some incoherent motion in the voxel; the curvature indicates non-Gaussian diffusion consistent with percolation through a porous medium. (B) Maps of fIVIM, kurtosis, and overlaid masks of voxels with highest 20% of values of fIVIM, K, or |v| for HC3 and PE6. The red and blue arrows correspond to the arrows on Fig 2A. (C) Scatterplot showing average values of fIVIM in the chorionic plate, placenta, basal plate, and uterine wall ROIs for each participant (* indicates significant difference between HC and PE; brackets indicate significant difference between ROIs for HC participants only, S3 Table). (D) Kurtosis in the placenta region for HC and PE; the black line indicates the median. (E) Venn diagrams indicating top 20th centile of voxels in each primary ROI for both the HC and PE groups (mean ± standard deviation). *Value differs from value expected by chance by more than interparticipant standard deviation. Underlying data plotted in panels A, C, and D are provided in S1 Data. fIVIM, IVIM fraction; HC, healthy control pregnancy; IVIM, intravoxel incoherent motion; MRI, magnetic resonance imaging; PE, preeclamptic pregnancy; ROI, region of interest.
Fig 4
Fig 4. Magnetic susceptibility of the placenta.
(A) Maps of magnetic susceptibility (χ) of the placenta (blue corresponds to deoxygenated blood) for HC3 (moved slightly since the acquisition in Fig 2A) and PE6. (B) Plot of the median (−), mean (+), interquartile range (box), and absolute range of susceptibilities (χ) for the HCs and PEs. The red dotted line indicates the value expected for fully oxygenated blood. The χ of the PE placentas is significantly higher (P = 0.010). (C) Maps of χ, T2*, fIVIM, net speed, and horizontal velocity for HC8. The lower arrow indicates oxygenated blood flowing into the placenta, and the upper arrow indicates deoxygenated blood flowing out of the placenta (which was also associated with a reduced T2*). (D) Variation of T2* with birth weight centile. Underlying data plotted in panels B and D are provided in S1 Data. fIVIM, intravoxel incoherent motion fraction; HC, healthy control pregnancy; PE, preeclamptic pregnancy.
Fig 5
Fig 5. The utero-placental pump.
(A) T2*-weighted images of the same placenta (HC17) before and during a contraction, with lines indicating the placental ROI (red) and the parts of the uterine wall that are covered (green) and not covered by placenta (blue). These images show a single slice, but data from slices across the whole uterus were summed to estimate the total volumes and areas involved. (B) Percentage change at maximum contraction of area of uterine wall covered by placenta, area of wall not covered by placenta, and of placental volume (green, blue, and red lines in [A], respectively), in each participant who had contractions during the 10-minute scan. Participants HC18 and PE8 had two contractions in the 10 minutes. Participants are ordered by ascending gestational age at time of scan. (C) Time course of contractions in the same participants, with each line representing the change (%) of the wall not covered by placenta (increased during contraction) and the area of the uterine wall covered by placenta (decreased during contraction). Underlying data plotted in panels B and C are provided in S1 Data. AF, amniotic fluid; HC, healthy control pregnancy; PE, preeclamptic pregnancy; ROI, region of interest.

Similar articles

Cited by

References

    1. Wilkening RB, Meschia G. Current topic: Comparative physiology of placental oxygen transport. Placenta. 1992;13(1):1–15. 10.1016/0143-4004(92)90002-b - DOI - PubMed
    1. Peter Kaufmann. Comparative Placentation: Guinea Pig [Internet]. UCSF website. 2004 [cited 2019 Jan 12]. Available from: http://placentation.ucsd.edu/guinea.htm.
    1. Miglino MA, Carter AM, Ambrosio CE, Bonatelli M, De Oliveira MF, Dos Santos Ferraz RH, et al. Vascular Organization of the Hystricomorph Placenta: a Comparative Study in the Agouti, Capybara, Guinea Pig, Paca and Rock Cavy. Placenta. 2004;25(5):438–48. 10.1016/j.placenta.2003.11.002 - DOI - PubMed
    1. McNanley T, Woods J. Placental Physiology [Internet]. Glob Libr Women’s Med. 2008. [cited 2020 May 11]. Available from: http://www.glowm.com/index.html?p=glowm.cml/section_view&articleid=195.
    1. Harris LK, Aplin JD. Vascular Remodeling and Extracellular Matrix Breakdown in the Uterine Spiral Arteries during Pregnancy. Reprod Sci. 2007;14(8_suppl):28–34. 10.1177/1933719107309588 - DOI - PubMed

Publication types