. 2020 Aug 5;107(3):522-537.e6.
doi: 10.1016/j.neuron.2020.04.025. Epub 2020 May 27.

Rapid 3D Enhanced Resolution Microscopy Reveals Diversity in Dendritic Spinule Dynamics, Regulation, and Function

Affiliations

Rapid 3D Enhanced Resolution Microscopy Reveals Diversity in Dendritic Spinule Dynamics, Regulation, and Function

Colleen R Zaccard et al. Neuron. .

Abstract

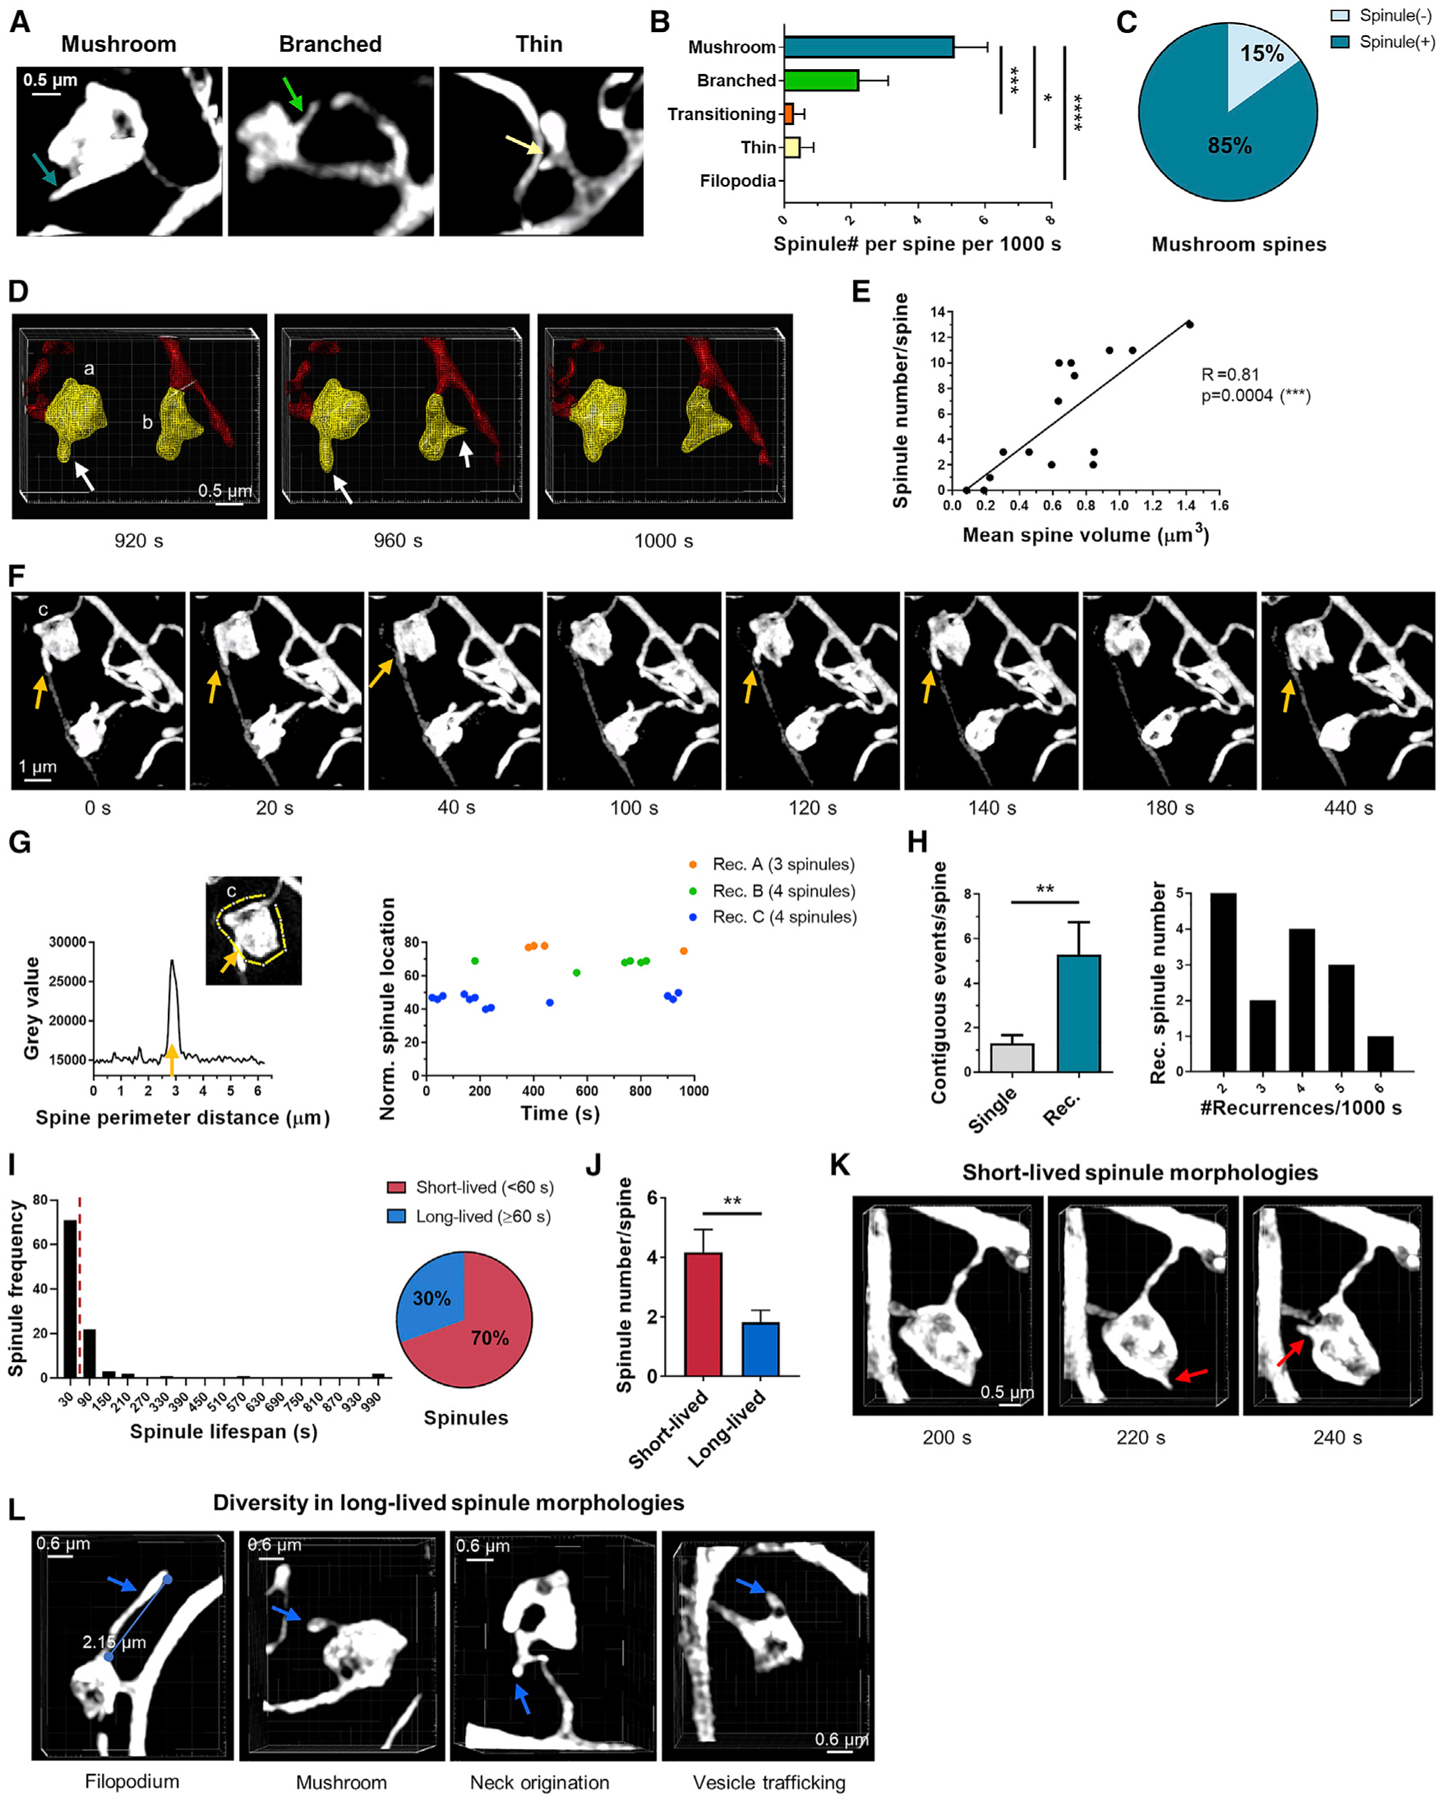
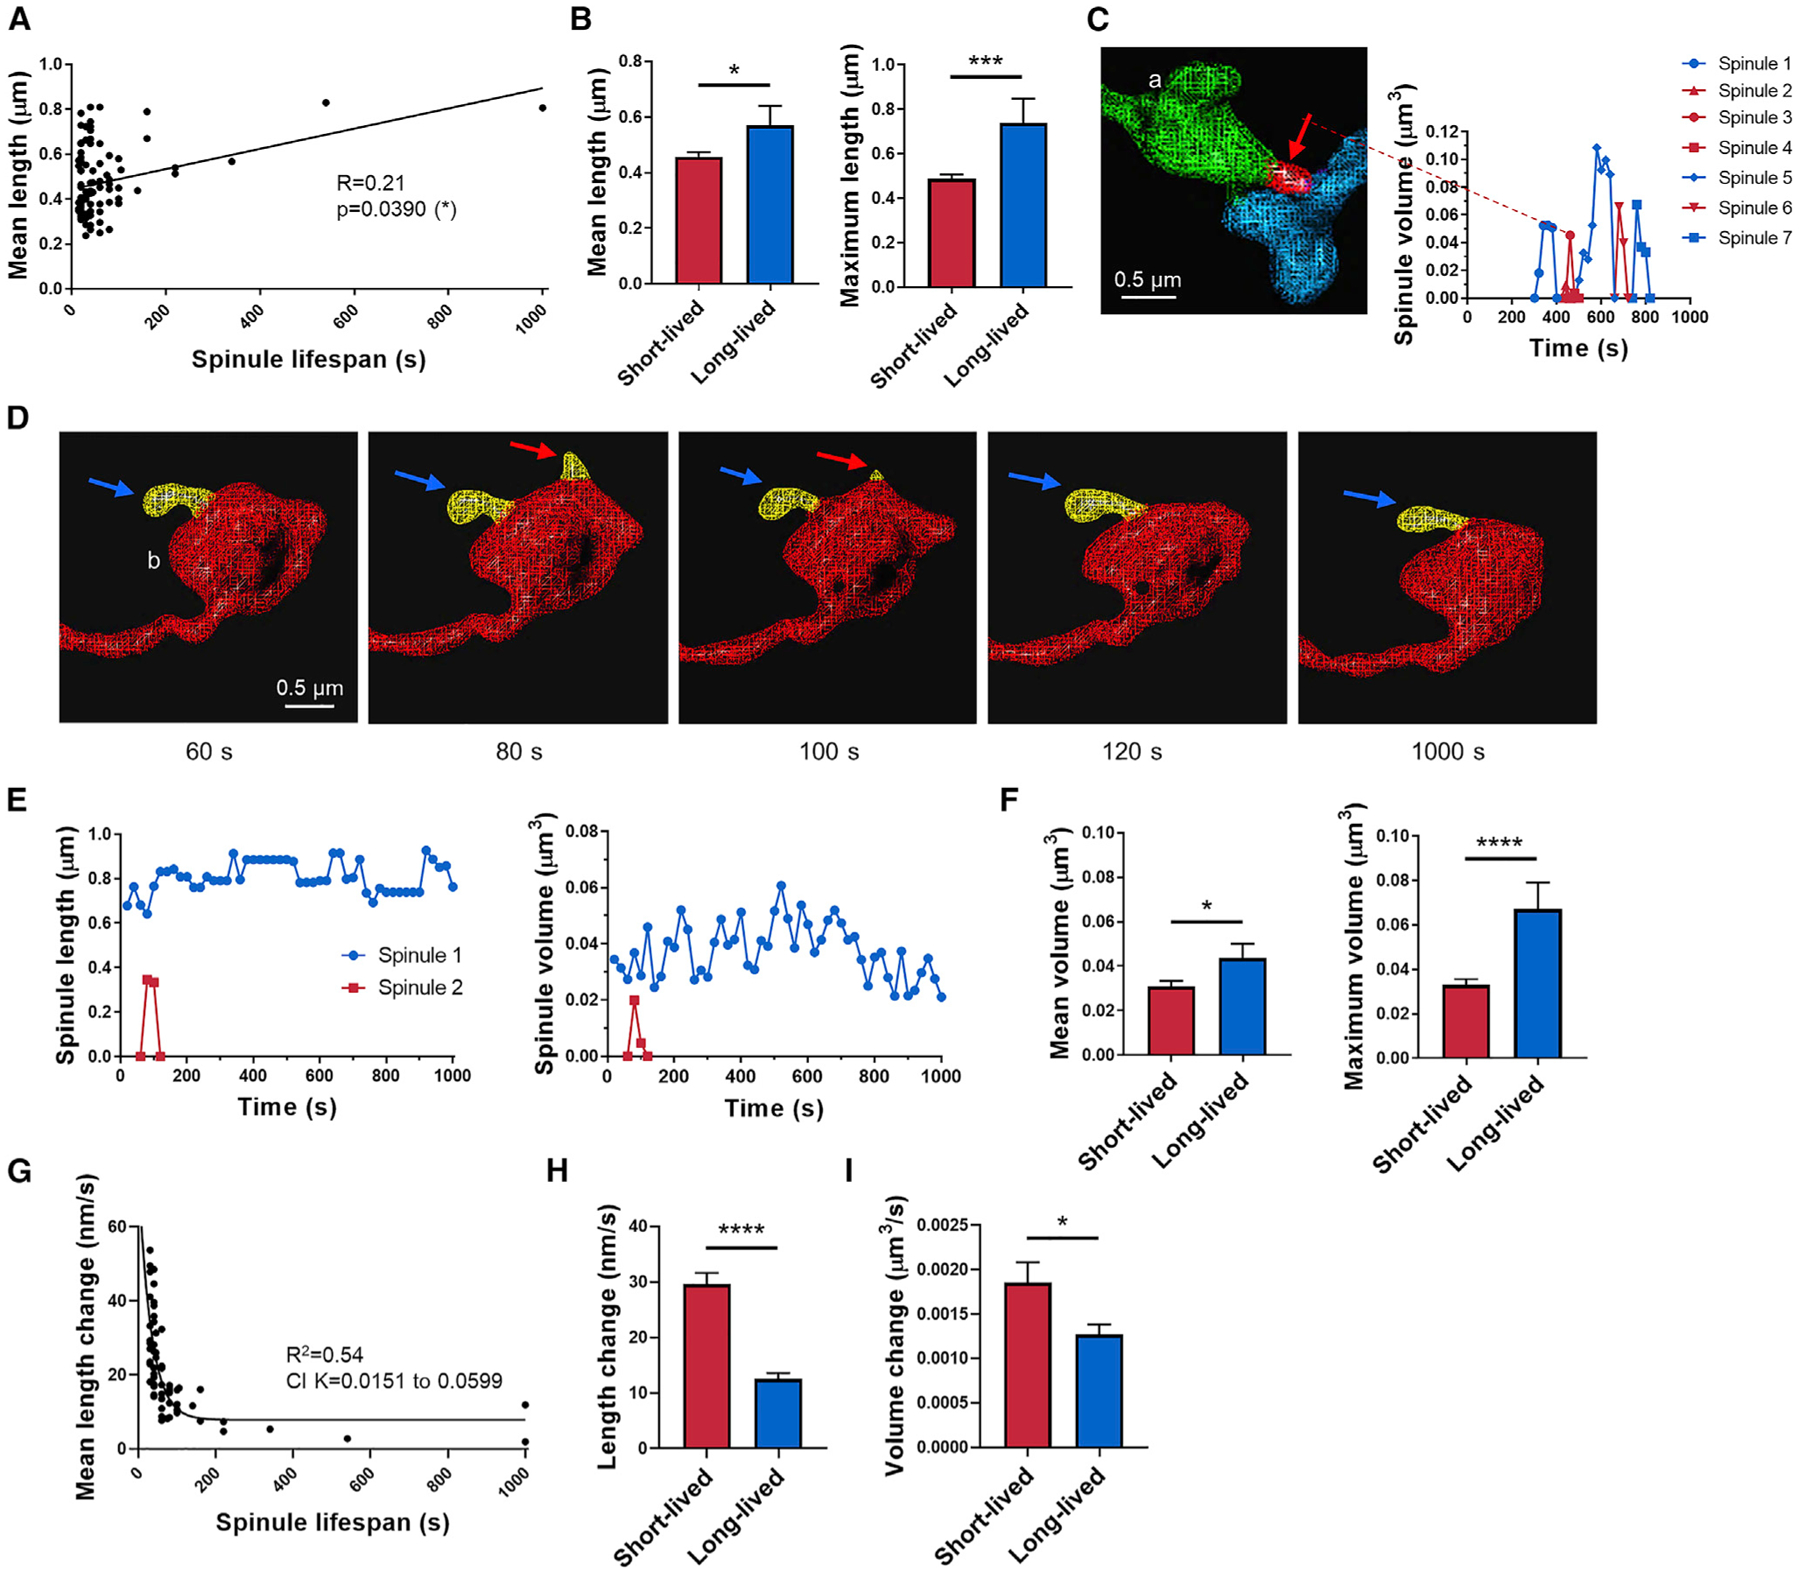
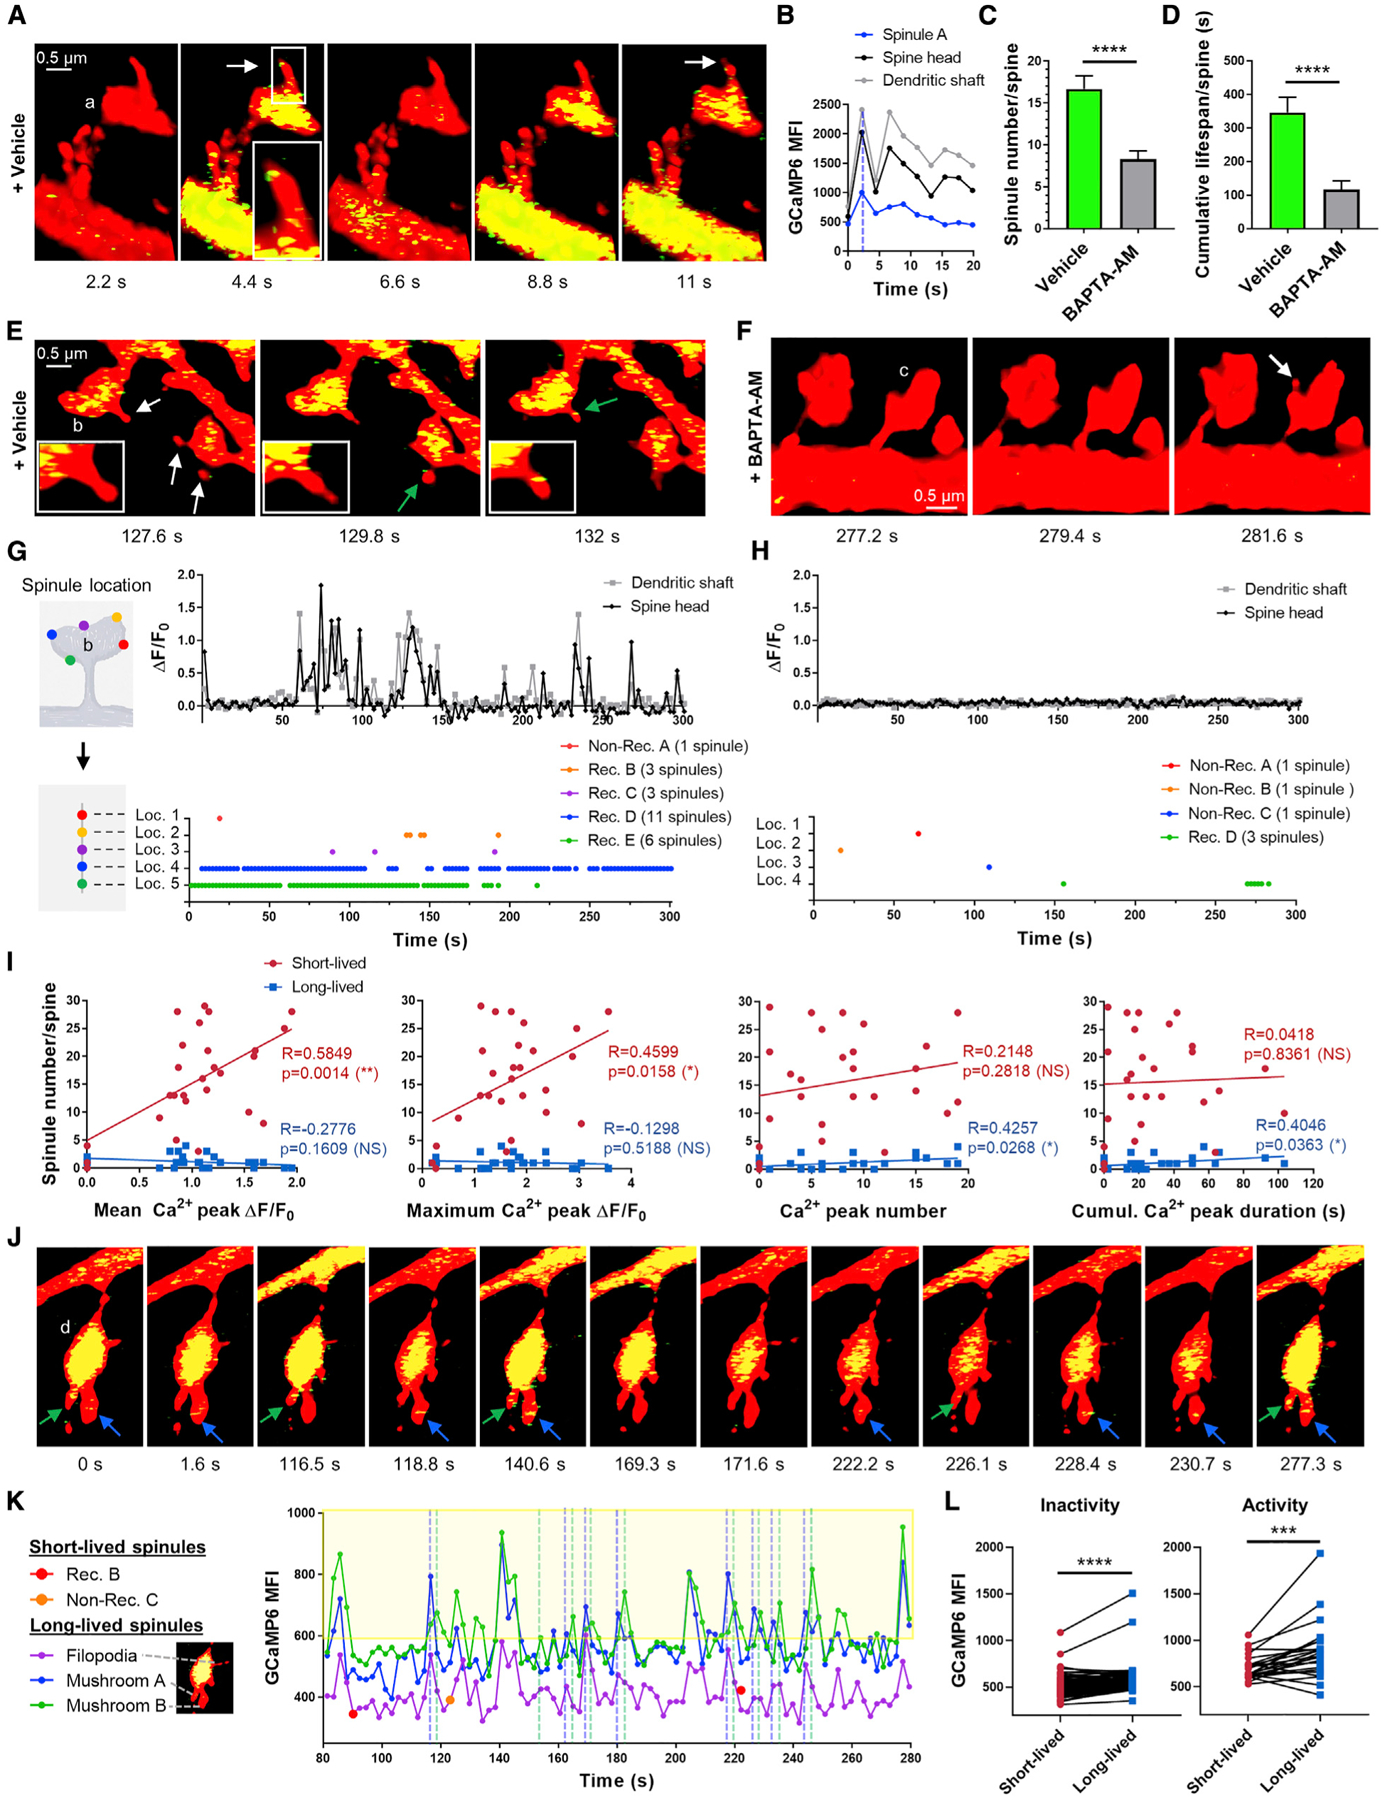
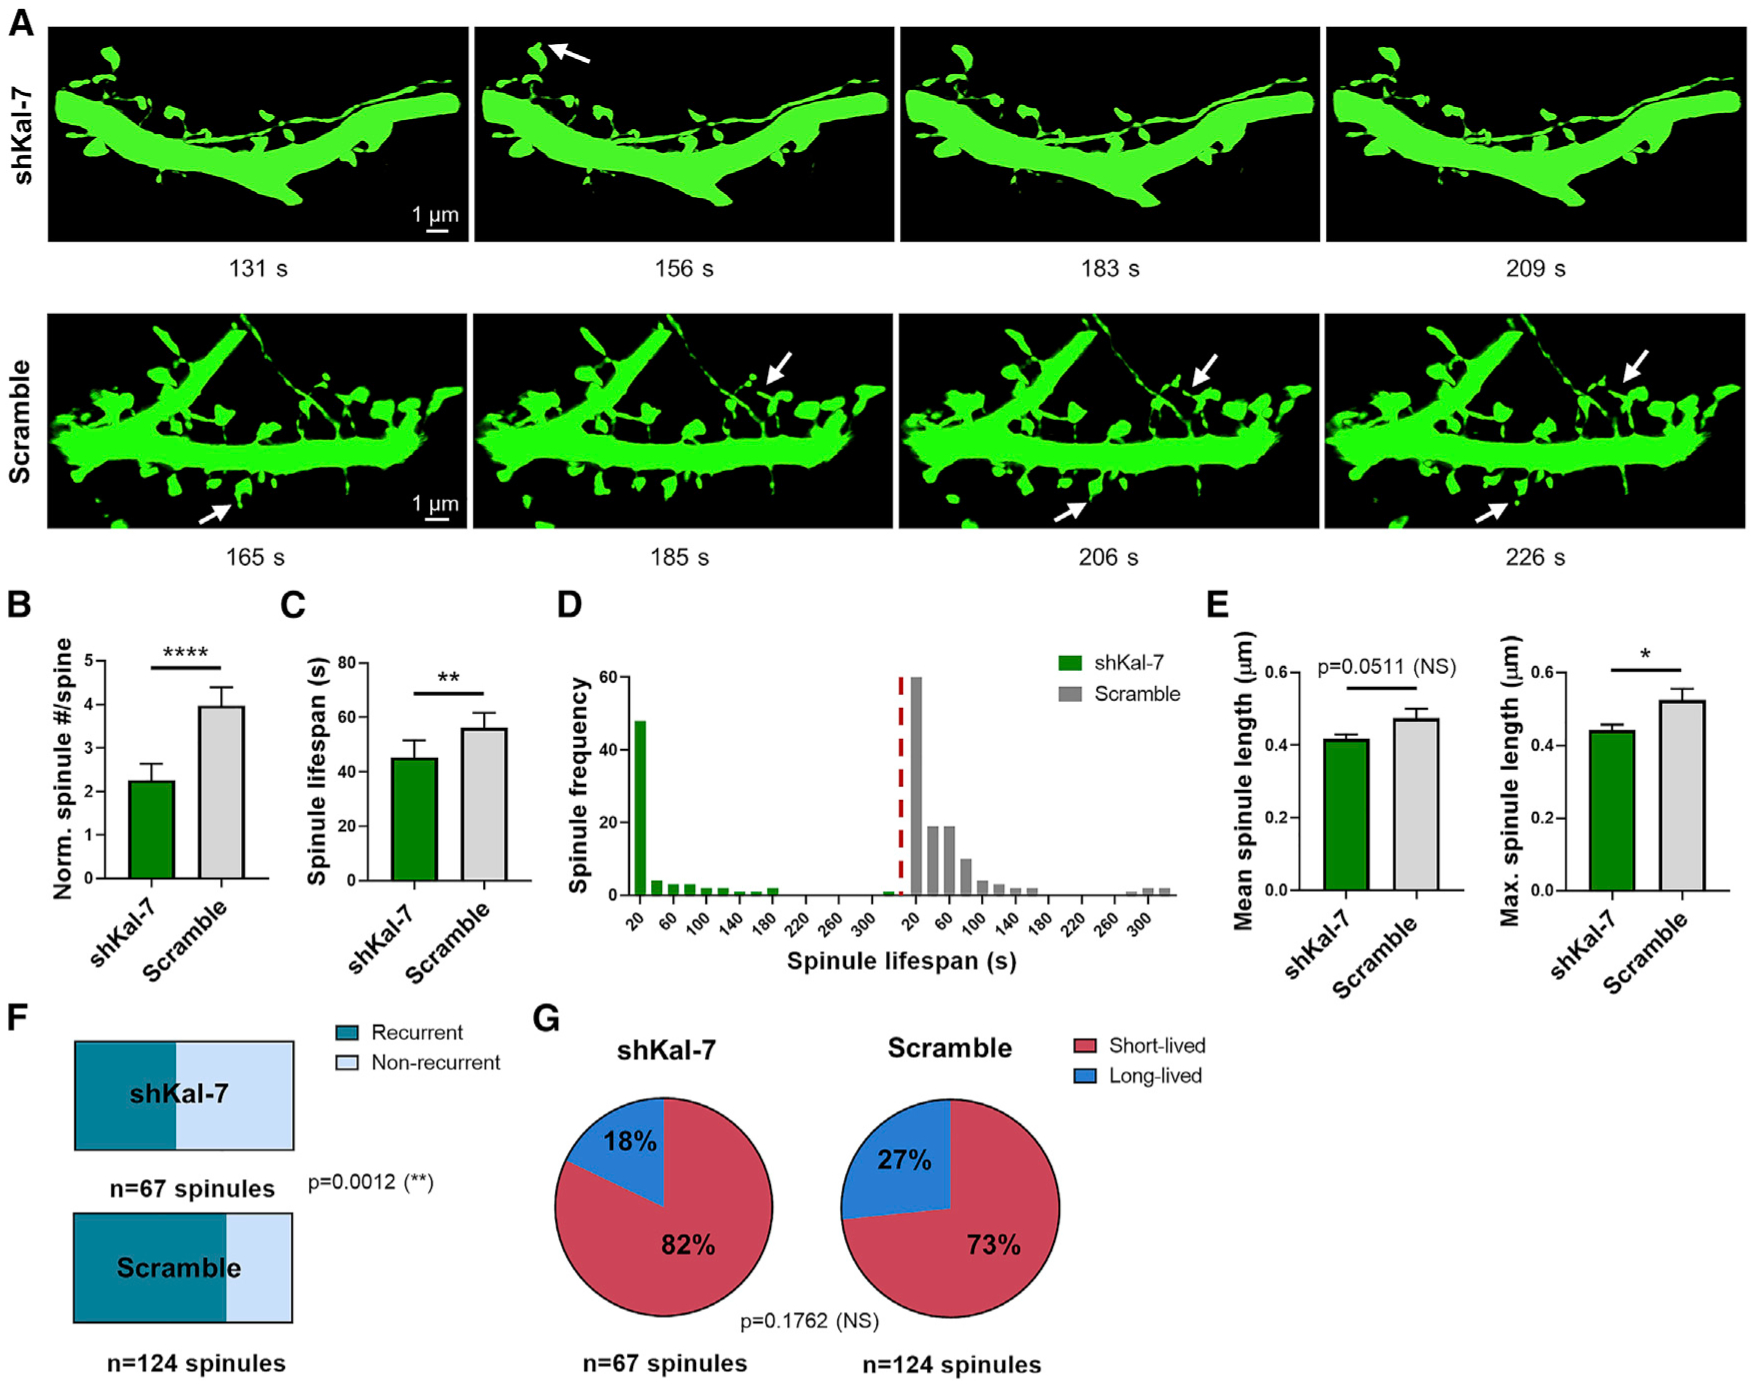
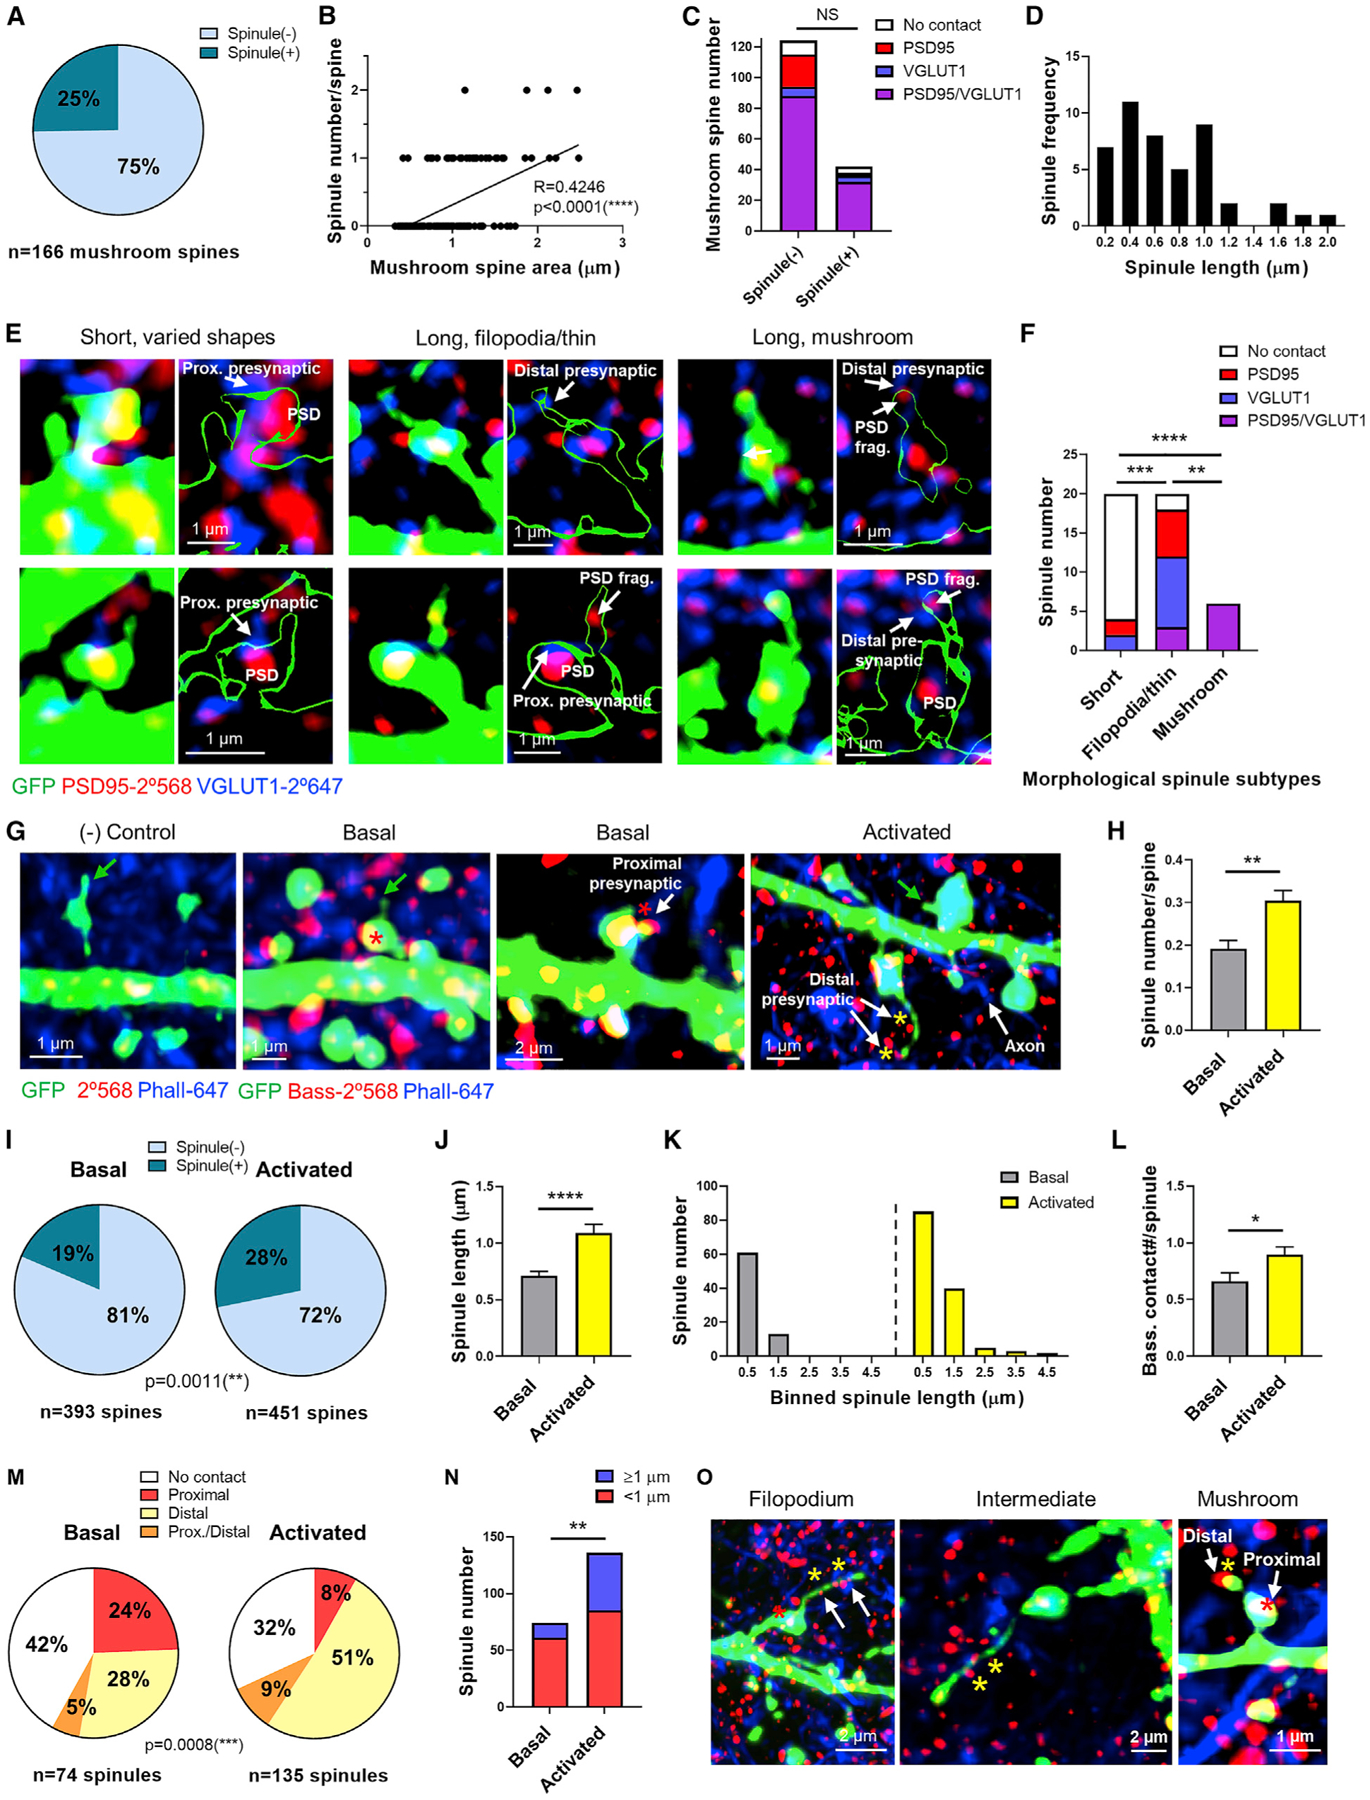
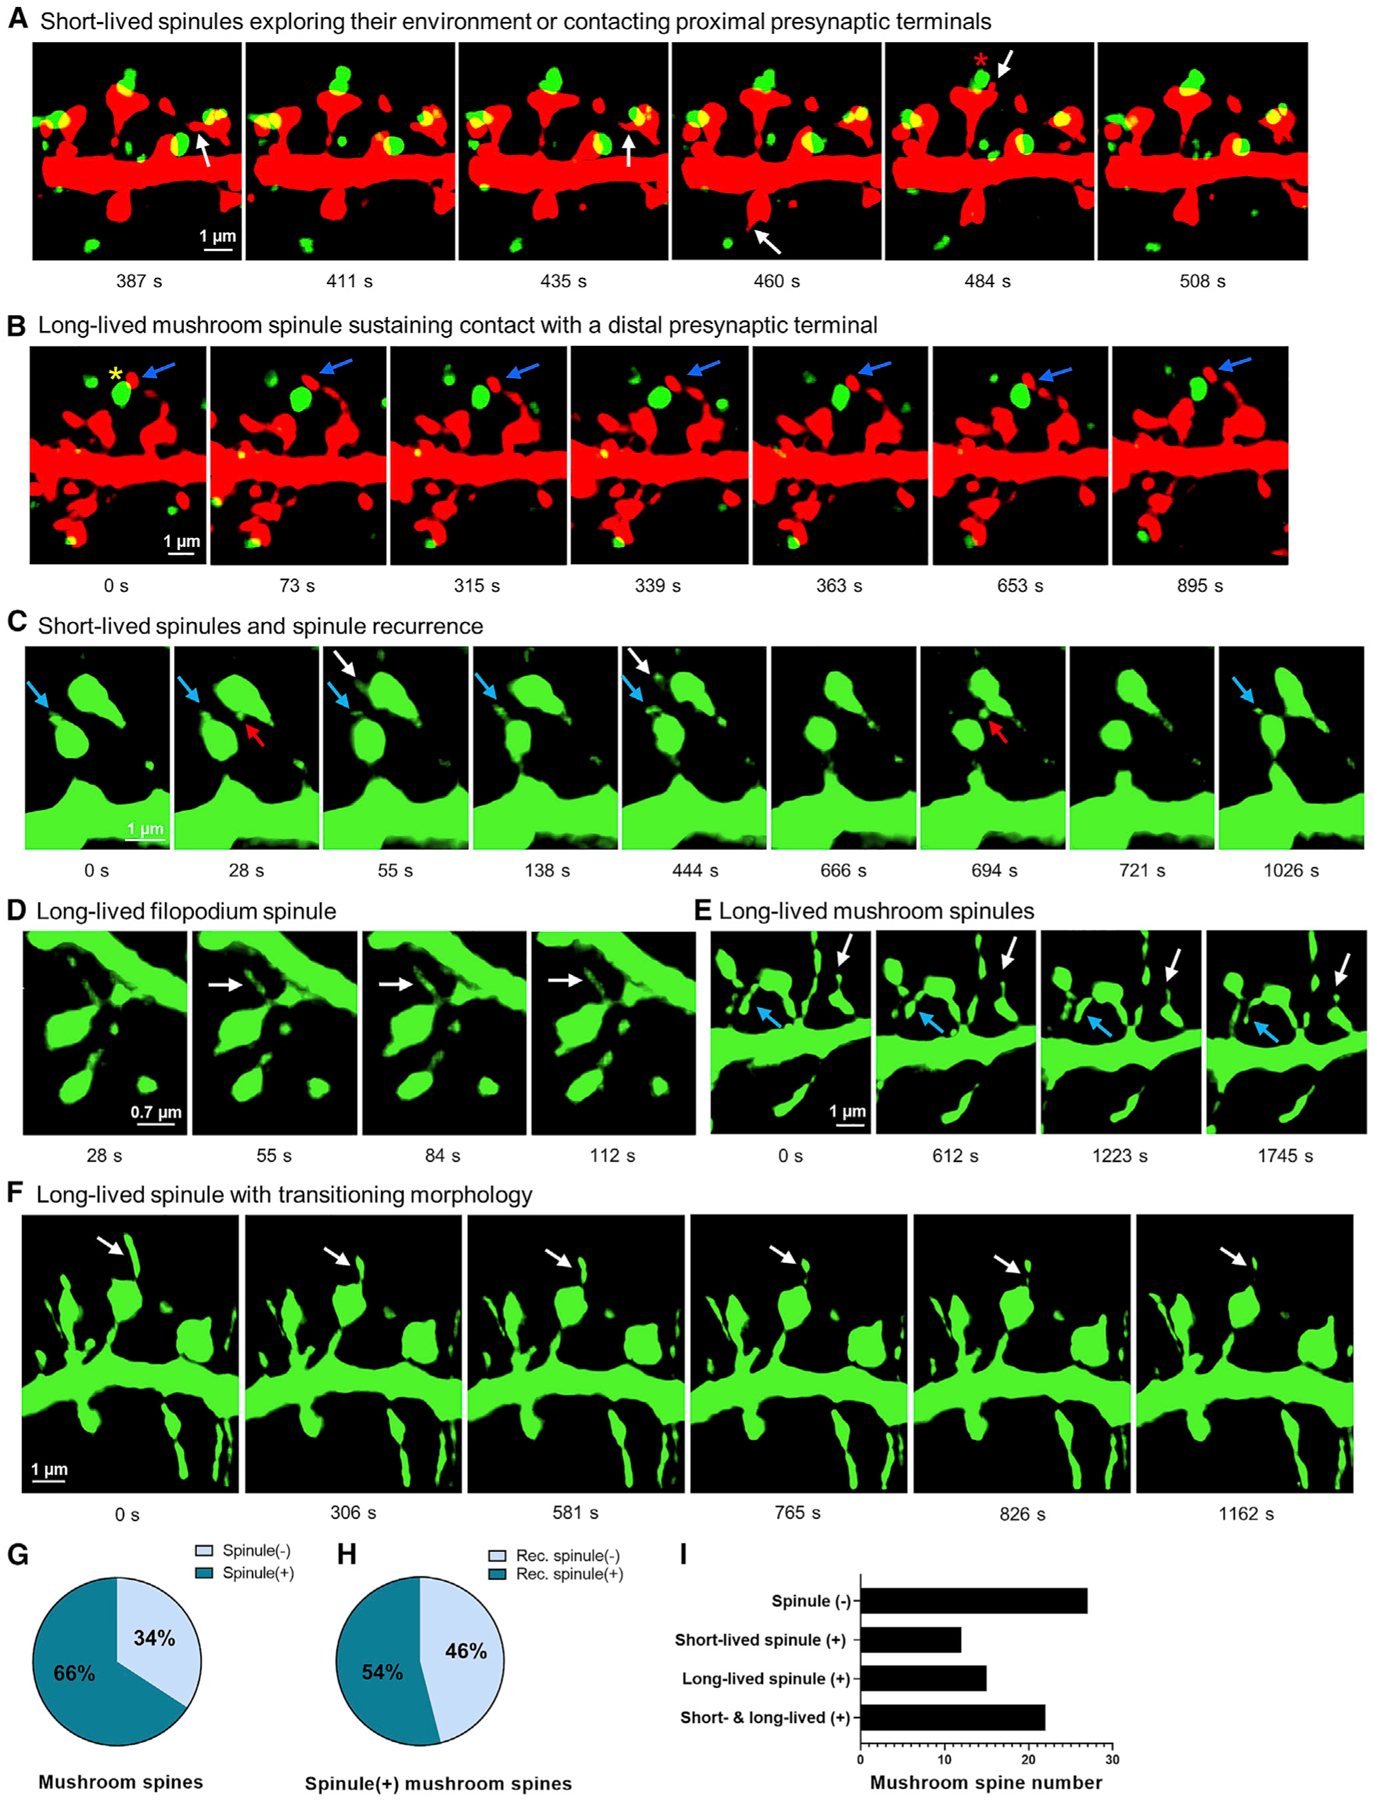
Dendritic spinules are thin protrusions, formed by neuronal spines, not adequately resolved by diffraction-limited light microscopy, which has limited our understanding of their behavior. Here we performed rapid structured illumination microscopy and enhanced resolution confocal microscopy to study spatiotemporal spinule dynamics in cortical pyramidal neurons. Spinules recurred at the same locations on mushroom spine heads. Most were short-lived, dynamic, exploratory, and originated near simple PSDs, whereas a subset was long-lived, elongated, and associated with complex PSDs. These subtypes were differentially regulated by Ca2+ transients. Furthermore, the postsynaptic Rac1-GEF kalirin-7 regulated spinule formation, elongation, and recurrence. Long-lived spinules often contained PSD fragments, contacted distal presynaptic terminals, and formed secondary synapses. NMDAR activation increased spinule number, length, and contact with distal presynaptic elements. Spinule subsets, dynamics, and recurrence were validated in cortical neurons of acute brain slices. Thus, we identified unique properties, regulatory mechanisms, and functions of spinule subtypes, supporting roles in neuronal connectivity.

Keywords: calcium transients; dendritic spine dynamics; intrabodies; kalirin-7; live imaging; multi-synaptic spines; postsynaptic density; structured illumination microscopy; synaptic plasticity; synaptic spinules.


Conflict of interest statement

Declaration of Interests The authors declare no competing interests.

Figures

Figure 1.
Figure 1.. Spinule Recurrence and Divergent Lifespans
(A) Representative 3D SIM constructions of spine classes displaying spinules (arrows). (B) Spinule number per spine, separated by class (n = 54), over 1000 s. Kruskal-Wallis test; mushroom versus transitioning p = 0.0009, thin p = 0.0153, and filopodia p < 0.0001. (C) Percentage of spinule(+) and (−) mushroom spines (n = 20) over time. (D) Wireframe Imaris reconstructions of a representative high-volume spine (a) with spinules (arrows) in multiple z stacks and low-volume spine (b) with a spinule in one stack. (E) Linear regression and Spearman correlation between spinule number and spine volume (n = 15). (F) Montage of a spinule (arrows) extending along an axon and recurring at one topographical location. See also Video S1. (G) Normalized temporal location mapping of three recurrent spinules from spine (c). (H) Comparison of single versus recurring spinule numbers per spine (n = 66). Unpaired Student’s t test, p = 0.0152. The histogram shows the number of recurrences at one location over time. (I) Spinule lifespan frequency and pie chart of the less than 60 s and 60 s or more spinule subsets (n = 102). (J) Short-versus long-lived spinule numbers per spine (n = 17). Unpaired Student’s t test, p = 0.0196. (K) Characteristic short-lived spinule shapes (red arrows). (L) Diverse long-lived spinule shapes (blue arrows). Data are shown as mean ± SEM. Not significant (NS) ≥ 0.05, *p < 0.05, **p < 0.01, ***p < 0.001, ****p < 0.0001. See also Figure S1.
Figure 2.
Figure 2.. Differential Short- and Long-Lived Spinule Dimensions and Dynamics
(A) Linear regression and Spearman correlation between mean spinule length and lifespan, with a 2.47-μm outlier removed (n = 101). (B) Mean and maximum length of short-lived (n = 71) versus long-lived spinules (n = 31). Mann-Whitney test, mean p = 0.0436, max. p = 0.0002. (C) Wireframe 3D model of a single spine (a) and spinule volume (red) and plot of spinule volumes over time. (D) Montage of a long-lived mushroom spinule (blue arrows) and a short-lived tapered spinule (red arrows). (E) Length and volume of spinules formed by spine (b). (F) Mean and maximum volume of short-lived (n = 56) versus long-lived spinules (n = 28). Mann-Whitney test, mean p = 0.0159, maximum p < 0.0001. (G) Non-linear regression and correlation between mean spinule length change and lifespan, excluding spinules present in a single z stack (n = 62). Confidence interval (CI) K = 0.0151–0.0599. (H) Mean change in length of spinules grouped by lifespan (n = 62). Unpaired t test, p < 0.0001. (I) Mean volume change in short-versus long-lived spinules, excluding those in a single z stack (n = 48). Unpaired t test, p = 0.0105. Data are shown as mean ± SEM. NS ≥ 0.05, *p < 0.05, **p < 0.01, ***p < 0.001, ****p < 0.0001. See also Figure S2.
Figure 3.
Figure 3.. Relationship between Spinule Subsets and PSD Complexity
(A) Enhanced resolution confocal image reconstruction of a dendrite with mushroom spines and their PSD volumes and spinules (arrows) in mRuby- and PSD95-specific GFP-tagged intrabody-expressing neurons. (B) Montage of recurring short-lived spinules (arrows) originating near a simple PSD edge. (C) Montage of a long-lived spinule (arrows) originating farther from a complex PSD. (D) Short- and long-lived spinule lifespans (n = 227) versus mean distance from spinule base to PSD edge. (E) Mean and maximum distance from base to PSD edge in short-lived (n = 215) versus long-lived spinules (n = 12). Mann-Whitney test, mean p < 0.0001, max. p < 0.0001. (F) Binned frequency of mean PSD volume per mushroom spine (n = 56) over time. (G) Linear regression and Spearman correlation between spinule number per spine and mean PSD volume. (H) Number of long-lived spinule(−) (n = 47) and spinule(+) (n = 9) spines with PSD partitioning. Fisher’s exact test, p = 0.0032. (I) Number of long-lived spinule(−) or (+) spines displaying fragmented PSDs. Fisher’s exact test, p = 0.0491. (J) Mean and maximum PSD fragment number per z stack in long-lived spinule(−) versus (+) spines. Mann-Whitney test, mean p = 0.0388, max. p = 0.0045. (K) Montage of a spine with a complex PSD with a small fragment (arrows) trafficking into a long-lived spinule. (L) Montage of small PSD fragment (arrows) trafficking within a long-lived filopodium spinule. See also Video S2. (M) Percentage of long-lived spinules (n = 12) displaying a PSD fragment in 1 or more stacks. Data are represented as mean ± SEM. NS ≥ 0.05, *p < 0.05, **p < 0.01, ***p < 0.001, ****p < 0.0001. See also Figure S3.
Figure 4.
Figure 4.. Differential Regulation of Short-Lived and Long-Lived Spinules by Ca2+
(A) Montage of vehicle (DMSO)-treated GCaMP6-expressing spine with Ca2+ nanodomains localizing to a long-lived spinule tip (arrows). (B) Plot of Ca2+ transients in the spine head (a), dendritic shaft, and spinule over 20 s. (C) Comparison of spinule number in vehicle-treated (n = 28) and BAPTA-AM-treated spines (n = 28). Unpaired t test, p < 0.0001. (D) Cumulative spinule lifespan in vehicle-versus BAPTA-AM-treated spines. Mann-Whitney test, p < 0.0001. (E) Vehicle-treated spines with short-lived spinules and long-lived spinules, where Ca2+ nanodomains are synchronized to spine head Ca2+ peaks (arrows). See also Video S3. (F) BAPTA-AM-treated spines with dampened Ca2+ transients and few dynamic spinules (arrows). (G) ΔF/F0 ratio in a vehicle-treated spine head (b) and dendritic shaft with a corresponding temporal recurrent spinule map. (H) ΔF/F0 ratio in a BAPTA-AM-treated spine head (c) and dendritic shaft with a corresponding temporal recurrent spinule map. (I) Linear regression and Pearson correlation of short- and long-lived spinule numbers per spine (n = 27) versus Ca2+ peak amplitude, frequency, and duration in control neurons. (J) Spine montage highlighting enhanced staggered Ca2+ transients in two long-lived mushroom spinules. See also Video S4. (K) Plot of Ca2+ transients in short- and long-lived spinules formed by spine (d). The yellow region highlights Ca2+ peaks, and dashed lines show staggered Ca2+ peaks of two mushroom spinules. (L) Comparison of GCaMP6 MFI in co-occurring short- versus long-lived spinules during spine head inactivity (n = 75 pairs, p < 0.0001) and activity (n = 24 pairs, p = 0.0007). Paired Student’s t test. Data are represented as mean ± SEM. NS ≥ 0.05, *p < 0.05, **p < 0.01, ***p < 0.001, ****p < 0.0001. See also Figure S4.
Figure 5.
Figure 5.. Exogenous Kalirin-7 Expression Enhances Spinule Formation
(A) 3D reconstruction montage of mushroom spine and spinule dynamics (arrows) in kalirin-7 neurons co-expressing pGFP and pLV-Kalirin mCherry versus controls co-expressing pGFP and pLV-mCherry. See also Videos S5 and S6. (B) Long and variously shaped spinules (arrows) on kalirin-7 spines. (C) Small dynamic spinules (arrows) on control spines. (D) Spinule number per spine over 5 min after normalizing to spine volume in kalirin-7 versus control neurons. Mann-Whitney test, p = 0.0003. (E) Mean spinule lifespan in kalirin-7 (n = 236 spinules) versus control spines (n = 64 spinules). Mann-Whitney test, p = 0.6876. (F) Mean spinule length comparison. Mann-Whitney test, p < 0.0001. (G) Relative frequency of mean spinule lengths. (H) Proportion of spinules recurring at one spine head location on kalirin-7 spines (n = 237 spinules) versus controls (n = 64 spinules). Fisher’s exact test. (I) Montage of spinules (arrows) on kalirin-7 spines extending to contact an axon. Data are represented as mean ± SEM. NS ≥ 0.05, *p < 0.05, **p < 0.01, ***p < 0.001, ****p < 0.0001. See also Figure S5.
Figure 6.
Figure 6.. Kalirin-7 Knockdown Inhibits Normal Spinule Formation
(A) Montage of spines and spinules in neurons co-expressing pAAV-shKal-7-GFP and p-mRuby versus pAAV-scramble-GFP and p-mRuby over 300 s. (B) Spinule number per mushroom spine, normalized to spine volume in shKal-7 (n = 82) and scramble spines (n = 51). Mann-Whitney test, p < 0.0001. (C) Spinule lifespans under shKal-7 (n = 67) versus scramble conditions (n = 124). Mann-Whitney test, p = 0.0045. (D) Frequency of spinule lifespans in shKal-7 versus scramble spines. (E) Mean and maximum spinule length over time on shKal-7 spines (n = 67 spinules) compared with the scramble (n = 124 spinules). Welch’s t test, mean p = 0.057, max. p = 0.0189. (F) Proportion of spinules recurring on spines from shKal-7 versus scramble neurons. Chi-square test. (G) Percentage of short-lived (< 60 s) and long-lived spinules (≥60 s) on shKal-7 versus scramble spines. Chi-square test. Data are shown as mean ± SEM. NS ≥ 0.05, *p < 0.05, **p < 0.01, ***p < 0.001, ****p < 0.0001. See also Figure S6.
Figure 7.
Figure 7.. Short Spinules Are Exploratory, whereas Elongated Spinules Contact Distal Synapses and Can Be Induced by Synaptic Activity
(A) Percentage of fixed basal state spinule(−) and (+) mushroom spines immunostained for PSD95 and the presynaptic terminal marker VGLUT1. (B) Linear regression and Pearson correlation of spinule number per spine versus spine area (n = 166). (C) Comparison of spinule(−) and (+) mushroom spines colocalizing with PSD95, VGLUT1, PSD95 and VGLUT1, or neither. Chi-square test, p = 0.1852. (D) Spinule length distribution (n = 46). (E) Representative 3D reconstructions of short versus long filopodia and thin versus long mushroom spine-shaped spinules and their pre- and postsynaptic contacts. (F) Short (n = 20), filopodia and thin (n = 20), and mushroom spinules (n = 6) colocalizing with PSD95, VGLUT1, both, or neither. Chi-square test, short versus filopodia and thin p = 0.0001 and versus mushroom p < 0.0001, filopodia and thin versus mushroom p = 0.0021. (G) Imaris 3D reconstructions of fixed basal versus activated state spinule(+) spines immunostained for bassoon to label spine head-proximal (red asterisk) and -distal presynaptic terminals (yellow asterisk), phalloidin (blue), and spinules (green arrows). (H) Spinule number per mushroom spine in the basal state (n = 391) versus activated state (n = 449) from maximum projection images. Mann-Whitney test, p = 0.0011. (I) Spinule(−) and (+) spine percentage in basal versus activated states. Chi-square test. (J) Spinule lengths in basal (n = 74) and activated states (n = 136). Mann-Whitney test, p < 0.0001. (K) Frequency distribution of spinule lengths. (L) Bassoon contact number per spinule. Mann-Whitney test, p = 0.0401. (M) Spinule percentage contacting spine head-proximal or -distal bassoon, both, or neither. Chi-square test. (N) Spinule number grouped by length in basal versus activated states. Chi-square test, p = 0.0027. (O) Imaris reconstructions highlighting spinule shapes (arrows) observed via live imaging. Data are represented as mean ± SEM. NS ≥ 0.05, *p < 0.05, **p < 0.01, ***p < 0.001, ****p < 0.0001. See also Figure S7.
Figure 8.
Figure 8.. Dynamics of Spinule Subset Interactions with Presynaptic Terminals in Culture and of Spinule Subsets and Recurrence in Live Acute Brain Slices
(A) A 3D reconstruction montage of short-lived spinules (arrows) not contacting FM dye-labeled presynaptic terminals (green) or contacting proximal terminals (red asterisk) in basal-state mRuby-expressing cultured neurons. (B) Spine montage of dynamic contact between an elongated mushroom spinule (arrows) and large, distal presynaptic terminal (yellow asterisk). See also Video S7. (C) A 3D montage from live YFP-expressing somatosensory cortical pyramidal neurons in acute brain slices showing recurrent short-lived (red/white arrows) and long-lived spinules (blue arrows). See also Video S8. (D) Montage of a long-lived filopodium spinule (arrows) existing for 1,200 s or more of imaging. (E) Long-lived elongated mushroom spinules (arrows) existing for 1,745 s or more. See also Video S9. (F) Montage of the transition in shape from filopodium to mushroom spinule (arrows). (G) Spinule(−) and (+) mushroom spine percentage (n = 76) over 1,200 s. (H) Percentage of spinule(+) mushroom spines (n = 50) displaying recurrent spinules. (I) Number of spinule(−), short-lived(+), long-lived(+), or short- and long-lived spinule(+) mushroom spines over time.

Similar articles

Cited by

References

    1. Anglade P, Mouatt-Prigent A, Agid Y, and Hirsch E (1996). Synaptic plasticity in the caudate nucleus of patients with Parkinson’s disease. Neurodegeneration 5, 121–128. - PubMed
    1. Biggs DS (2010). 3D deconvolution microscopy. Curr. Protoc. Cytom. Chapter 12, Unit 1219, 1–20. - PubMed
    1. Blanque A, Repetto D, Rohlmann A, Brockhaus J, Duning K, Pavenstädt H, Wolff I, and Missler M (2015). Deletion of KIBRA, protein expressed in kidney and brain, increases filopodial-like long dendritic spines in neocortical and hippocampal neurons in vivo and in vitro. Front. Neuroanat 9, 13. - PMC - PubMed
    1. Bourne JN, and Harris KM (2008). Balancing structure and function at hippocampal dendritic spines. Annu. Rev. Neurosci 31, 47–67. - PMC - PubMed
    1. Cahill ME, Xie Z, Day M, Photowala H, Barbolina MV, Miller CA, Weiss C, Radulovic J, Sweatt JD, Disterhoft JF, et al. (2009). Kalirin regulates cortical spine morphogenesis and disease-related behavioral phenotypes. Proc. Natl. Acad. Sci. USA 106, 13058–13063. - PMC - PubMed

Publication types

MeSH terms