. 2020 May 25;9(5):1319.
doi: 10.3390/cells9051319.

Acute Induction of Translocon-Mediated Ca2+ Leak Protects Cardiomyocytes Against Ischemia/Reperfusion Injury

Affiliations

Acute Induction of Translocon-Mediated Ca2+ Leak Protects Cardiomyocytes Against Ischemia/Reperfusion Injury

Ribal Al-Mawla et al. Cells. .

Abstract

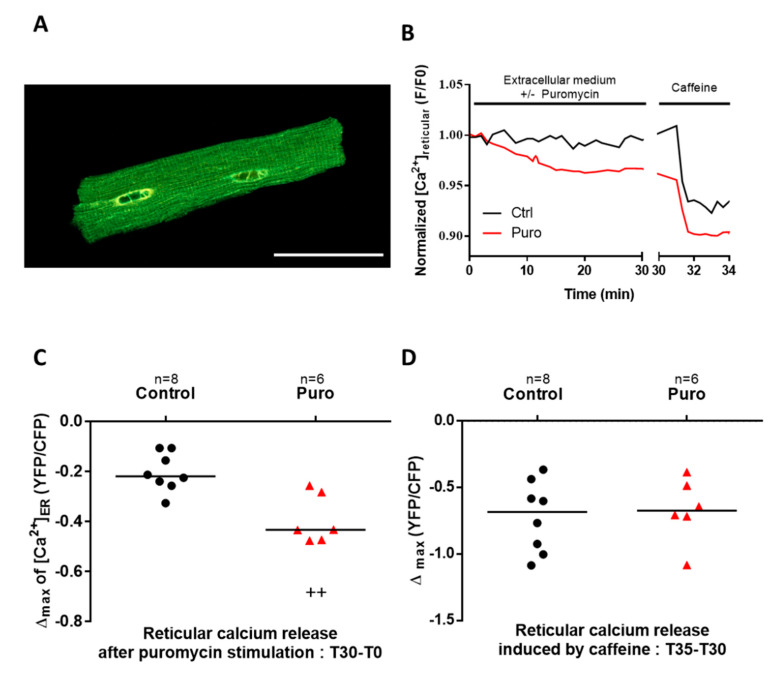
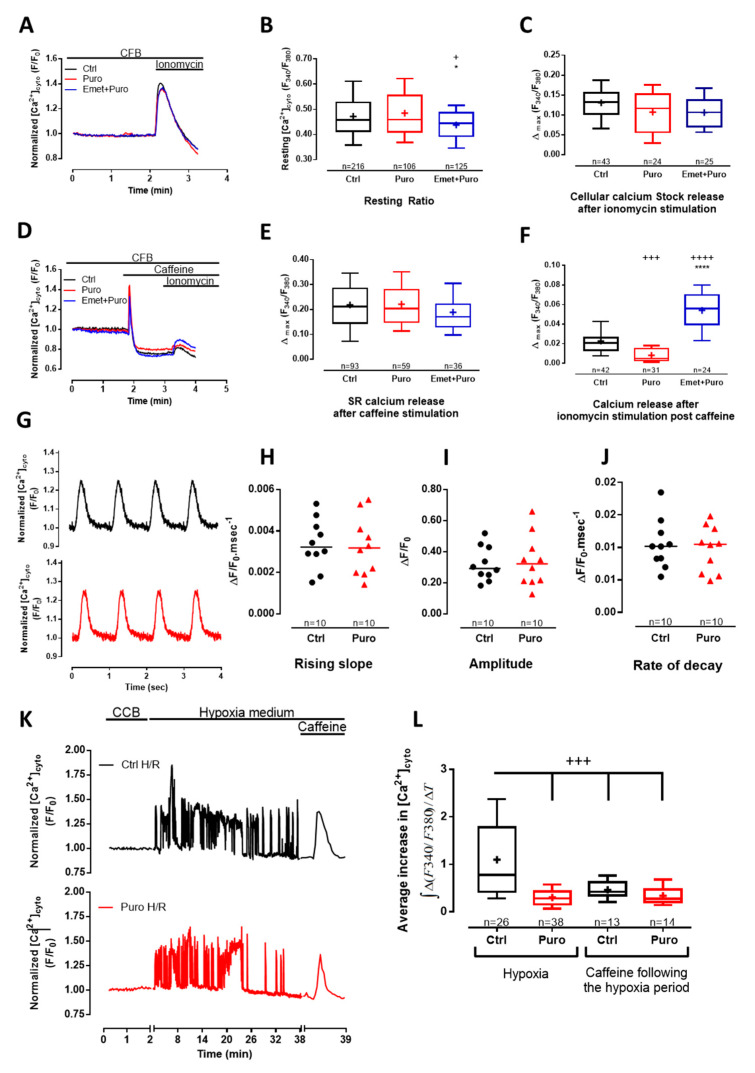
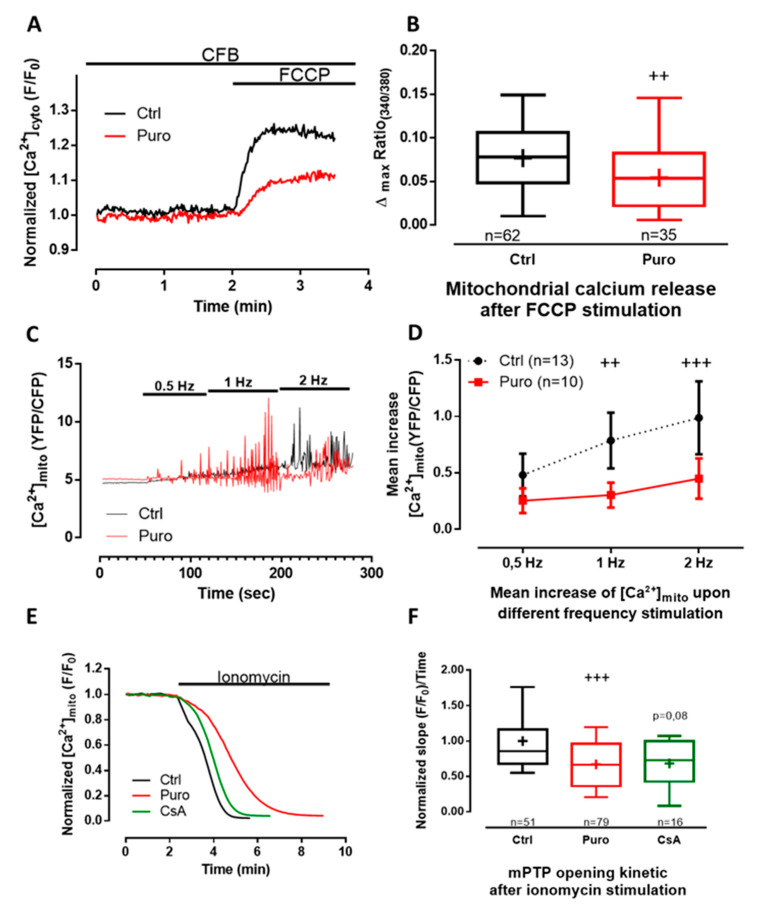
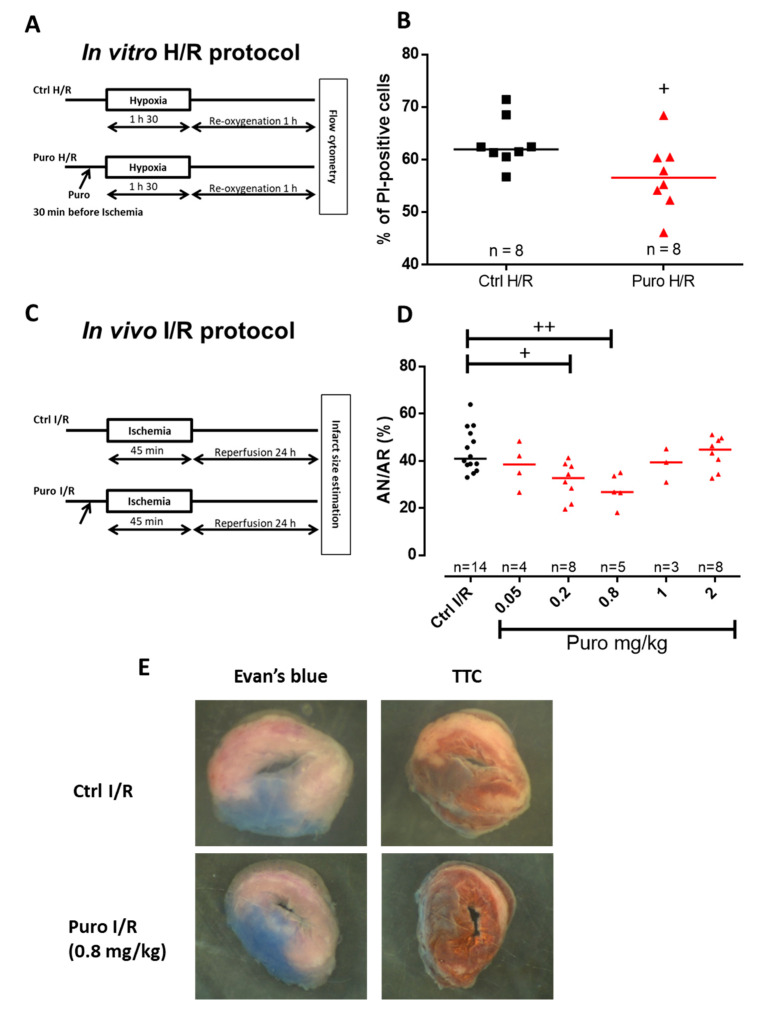
During myocardial infarction, dysregulation of Ca2+ homeostasis between the reticulum, mitochondria, and cytosol occurs in cardiomyocytes and leads to cell death. Ca2+ leak channels are thought to be key regulators of the reticular Ca2+ homeostasis and cell survival. The present study aimed to determine whether a particular reticular Ca2+ leak channel, the translocon, also known as translocation channel, could be a relevant target against ischemia/reperfusion-mediated heart injury. To achieve this objective, we first used an intramyocardial adenoviral strategy to express biosensors in order to assess Ca2+ variations in freshly isolated adult mouse cardiomyocytes to show that translocon is a functional reticular Ca2+ leak channel. Interestingly, translocon activation by puromycin mobilized a ryanodine receptor (RyR)-independent reticular Ca2+ pool and did not affect the excitation-concentration coupling. Second, puromycin pretreatment decreased mitochondrial Ca2+ content and slowed down the mitochondrial permeability transition pore (mPTP) opening and the rate of cytosolic Ca2+ increase during hypoxia. Finally, this translocon pre-activation also protected cardiomyocytes after in vitro hypoxia reoxygenation and reduced infarct size in mice submitted to in vivo ischemia-reperfusion. Altogether, our report emphasizes the role of translocon in cardioprotection and highlights a new paradigm in cardioprotection by functionally uncoupling the RyR-dependent Ca2+ stores and translocon-dependent Ca2+ stores.

Keywords: Ca2+ leak channel; cardioprotection; ischemia-reperfusion; reticulum; translocon.


Conflict of interest statement

The authors declare no conflict of interest. The funders had no role in the design of the study; in the collection, analyses, or interpretation of data; in the writing of the manuscript; or in the decision to publish the results.

Figures

Figure 1
Figure 1
Translocon (TLC) activation by puromycin induces a decrease in reticular Ca2+ stock. (A) Illustration of the in vivo adenoviral strategy to express a reticular Ca2+ sensor, D4ER, in adult mouse cardiomyocytes, presenting a typical reticular pattern of the fluorescent sensor as displayed on the representative confocal image. Scale bar: 50 µm. (B) Graphical representation of the D4ER fluorescence ratio evolution with time in control condition (black line) and in response to 30 min of 200 µM puromycin treatment (red line), both stimulated with 5 mM caffeine; representative curve of reticular fluorescence evolution in control (Ctrl) condition and under puromycin treatment. (C) Scatter plots of reticular Ca2+ decreased at the end of 30 min perfusion with or without puromycin. (D) Scatter plots of the ryanodine receptor (RyR)-dependent reticular Ca2+ stock after puromycin or Ctrl treatment estimated by caffeine stimulation, calculated as difference between fluorescence level at stimulation time and final fluorescence. n = cell count. Statistics: ++ p < 0.01 vs. Ctrl.
Figure 2
Figure 2
The reticular puromycin-mediated Ca2+ stock release was independent of the one stimulated by caffeine and did not affect excitation–contraction (E-C) coupling. (A,D) Time traces showing cytosolic Ca2+ concentration assessed by fura2-AM (acetoxymethyl ester) cytosolic probe, in Ctrl condition and after 30 min of 200 µM puromycin pretreatment or 20 µM emetine +200µM puromycin pretreatment. Effect of puromycin and emetine + puromycin was measured after cardiomyocyte (CM) pretreatment in Ca2+-containing buffer (CCB) for 30 min (see the Materials and Methods section). Ca2+ content was figured out by the maximum amplitude of fura2-AM fluorescence ratio (∆max Ratio(340/380)) after the addition of different stimulations in a Ca2+-free buffer (CFB). (B) Box blots representing the steady-state cytosolic Ca2+ concentration and (C) total cell Ca2+ content assessed by 5 µM of ionomycin stimulation. (E) RyR2-dependent Ca2+ stores assessed by 10 mM of caffeine stimulation and (F) remaining cell Ca2+ content after caffeine stimulation assessed by ionomycin stimulation. (GJ) Cytoplasmic Ca2+ transients were recorded using fluo5-AM–loaded intact CM electrically stimulated at 1 Hz. (G) Representative cytoplasmic Ca2+ transients in the absence or after 30 min of puromycin pretreatment; ΔF/F0 = normalized change fluorescence. (H) Scatter blots representing cytoplasmic Ca2+ transients amplitude, (I) Ca2+ transients rising slope (calculated from the relative amplitude and time to peak of the electrical induced Ca2+ transient), and (J) Ca2+ transients rate of decay. (K) Time traces displaying cytosolic Ca2+ concentration (measured by the fura2-AM fluorescence ratio) in a Ctrl CM and in a 200 µM puromycin preconditioned CM subjected to a 30 min ischemia-like hypoxia. At the end of the 30 min, 10 mM caffeine was added to the medium. CCB means Ca2+-containing buffer. (L) Average increase in the cytosolic Ca2+ concentration [Ca2+]cyto was figured out as masses of fura2-AM fluorescence signal over time in CM treated as explained in (K). Data are from at least three independent experiments. n = cell count. Statistics: + p < 0.05, +++ p < 0.001, ++++ p < 0.0001 vs. Ctrl, * p < 0.05, **** p < 0.0001 vs. Puro (puromycin).
Figure 3
Figure 3
Puromycin pretreatment modified mitochondrial Ca2+ content in beating CM and delays mitochondrial permeability transition pore (mPTP) opening. (A) Representative time traces of mitochondrial Ca2+ concentration (expressed as the 340/380 fluorescent ratio of fura2-AM cytosolic probe)) from Ctrl and CM pretreated with 200 µM of puromycin for 30 min. (B) Boxplots represent mitochondrial calcium content assessed by 25 µM of FCCP (Carbonyl cyanide 4-(trifluoromethoxy)phenylhydrazone) stimulation (expressed by the delta max of the 340/380 fluorescent ratio of fura2-AM cytosolic probe) in Ctrl condition and after 30 min of 200 µM puromycin pretreatment. (C,D) Mitochondrial Ca2+ rises recorded in 4mtD3cpv-positive CM electrically stimulated successively at 0.5, 1, and 2 Hz. (C) Representative time traces of mitochondrial Ca2+ concentration in Ctrl and after 30 min of puromycin pretreatment, expressed as YFP/CFP fluorescent ratio with a time binning of 4 (every 2.12 sec). (D) Corresponding averaged mean increase of mitochondrial Ca2+ concentrations at the same range of stimulation frequencies. (E) Representative time traces of calcein fluorescence from Ctrl, and 1 µM cyclosporin A (CsA)-pretreated and puromycin-pretreated CM. (F) Boxplots representing the slope of the mitochondrial calcein fluorescence decay induced by ionomycin stimulation. Data are represented as medians (except in E, mean ± SEM) from at least three independent experiments. n = cell count. Statistics: ++ p < 0.01, +++ p < 0.001 vs. Ctrl.
Figure 4
Figure 4
In vitro and in vivo CM protection by puromycin pretreatment after ischemia/reperfusion. (A) Experimental design representing ischemia-like hypoxia/reoxygenation (H/R) protocols achieved in isolated adult mouse CM. (B) Scatter plots showing mortality of CM subjected to H/R (Ctrl H/R) or CM concomitantly subjected to H/R and a 200 µM puromycin pretreatment (puro H/R). Evaluation of CM mortality was assessed via propidium iodide (PI) staining. (C) Experimental design showing the I/R protocols performed in mice by a blind test comparing different concentration of puromycin. (D) Scatter plots representing individual I/R mouse by the percentage of necrosis area (AN) over area-at-risk (AR). n = number of animals. Statistics: + p < 0.05, ++ p < 0.01 vs. Ctrl H/R. (E) Representative images of Evan’s blue- and triphenyltetrazolium chloride (TTC)-stained hearts from Ctrl I/R and Puro I/R mice.

References

    1. Sztark F., Payen J.F., Piriou V., Rigoulet M., Ventura-Clapier R., Mazat J.P., Leverve X., Janvier G. Cellular energy metabolism: Physiologic and pathologic aspects. Ann. Fr. D’anesthesie Reanim. 1999;18:261–269. doi: 10.1016/S0750-7658(99)90434-3. - DOI - PubMed
    1. Nabel E.G., Braunwald E. A tale of coronary artery disease and myocardial infarction. N. Engl. J. Med. 2012;366:54–63. doi: 10.1056/NEJMra1112570. - DOI - PubMed
    1. Chouchani E.T., Pell V.R., Gaude E., Aksentijević D., Sundier S.Y., Robb E.L., Logan A., Nadtochiy S.M., Ord E.N.J., Smith A.C., et al. Ischaemic accumulation of succinate controls reperfusion injury through mitochondrial ROS. Nature. 2014;515:431–435. doi: 10.1038/nature13909. - DOI - PMC - PubMed
    1. Saini H.K., Dhalla N.S. Defective calcium handling in cardiomyocytes isolated from hearts subjected to ischemia-reperfusion. Am. J. Physiol. Heart Circ. Physiol. 2005;288:H2260–H2270. doi: 10.1152/ajpheart.01153.2004. - DOI - PubMed
    1. Buja L.M. Myocardial ischemia and reperfusion injury. Cardiovasc. Pathol. 2005;14:170–175. doi: 10.1016/j.carpath.2005.03.006. - DOI - PubMed

Publication types

MeSH terms

LinkOut - more resources