. 2020 May 26;9(6):1332.
doi: 10.3390/cells9061332.

CUL4-DDB1-CRBN E3 Ubiquitin Ligase Regulates Proteostasis of ClC-2 Chloride Channels: Implication for Aldosteronism and Leukodystrophy

Affiliations

CUL4-DDB1-CRBN E3 Ubiquitin Ligase Regulates Proteostasis of ClC-2 Chloride Channels: Implication for Aldosteronism and Leukodystrophy

Ssu-Ju Fu et al. Cells. .

Abstract

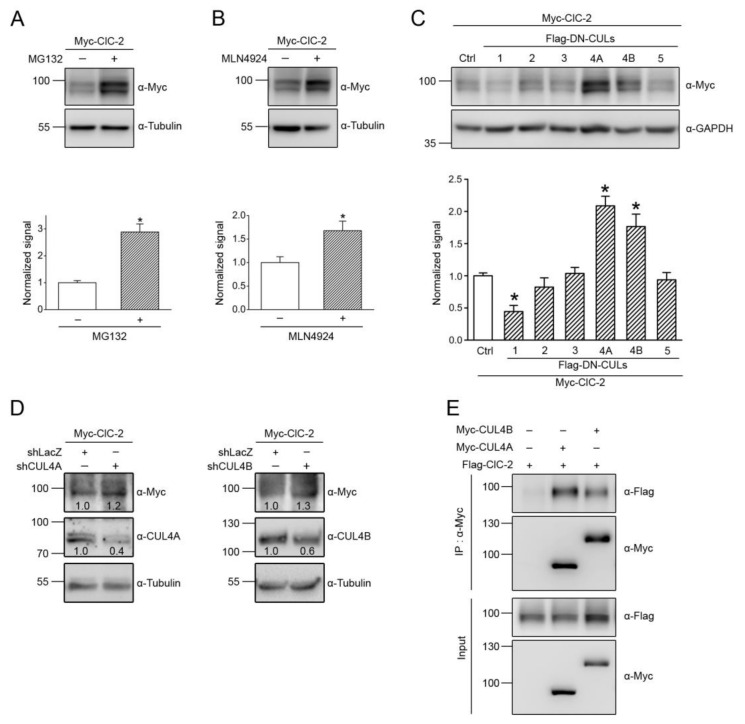
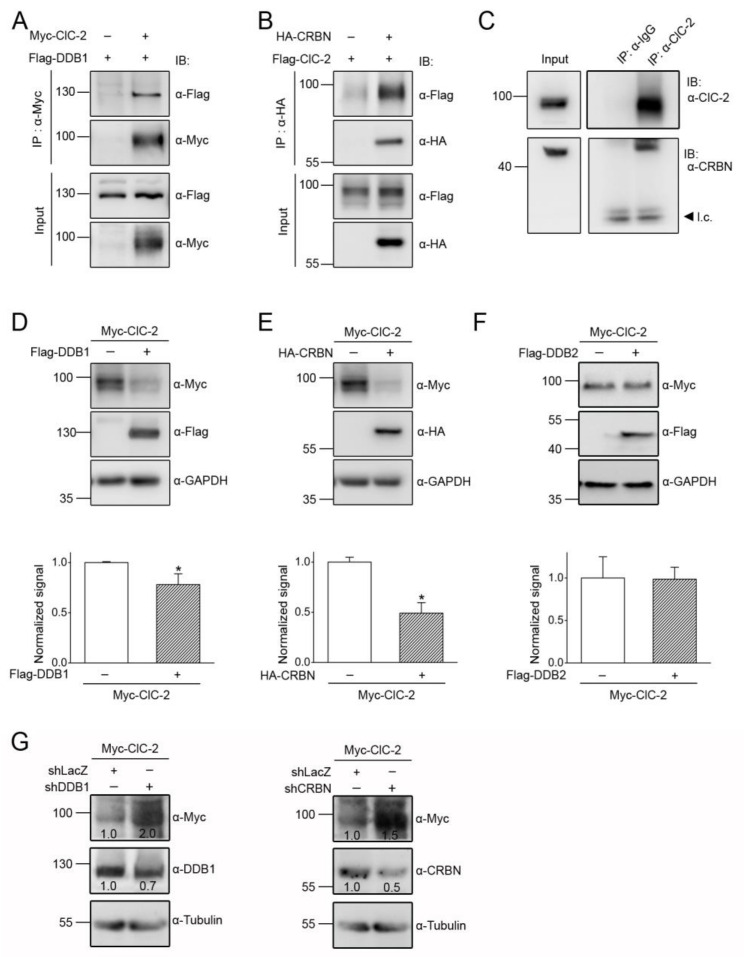
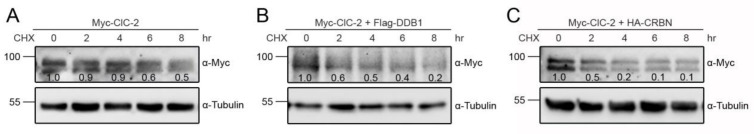
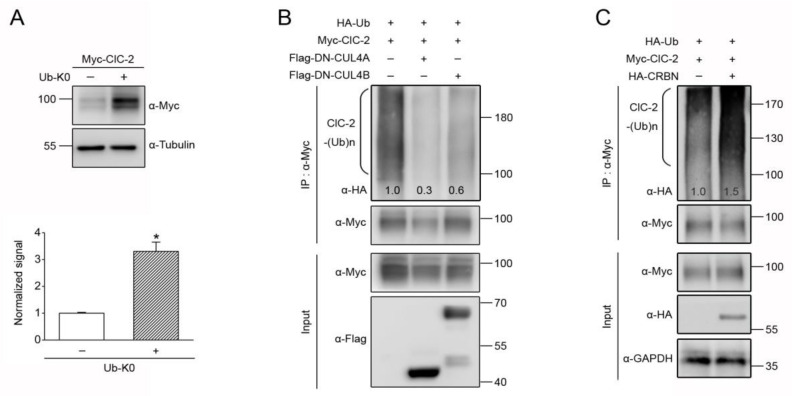
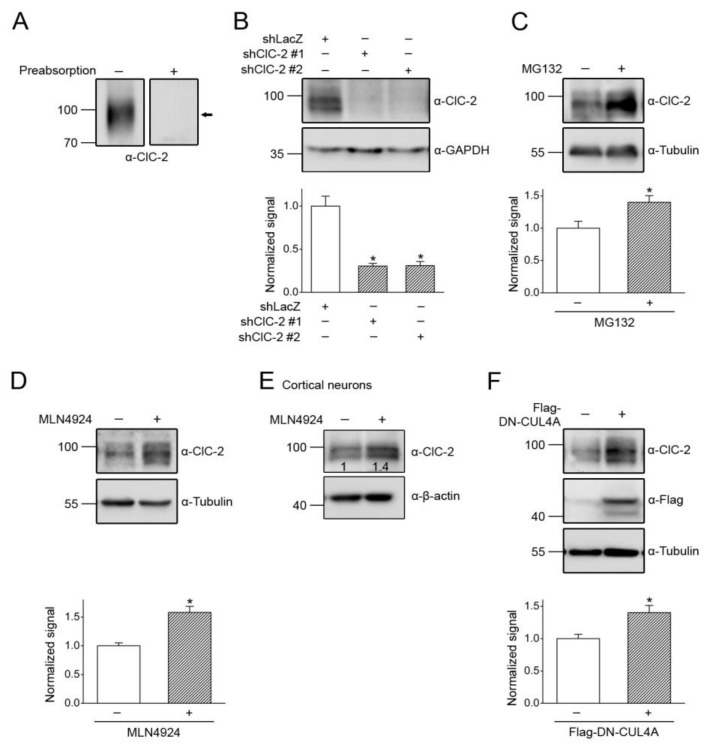
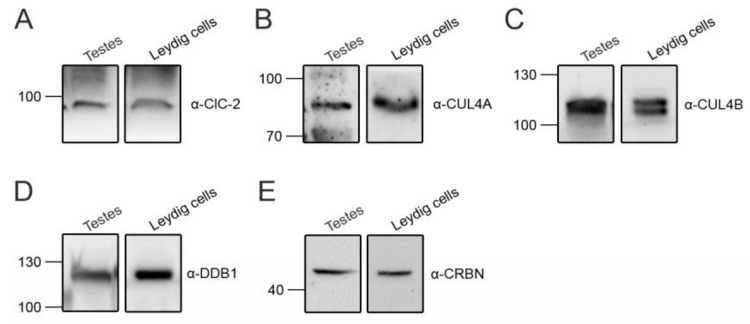
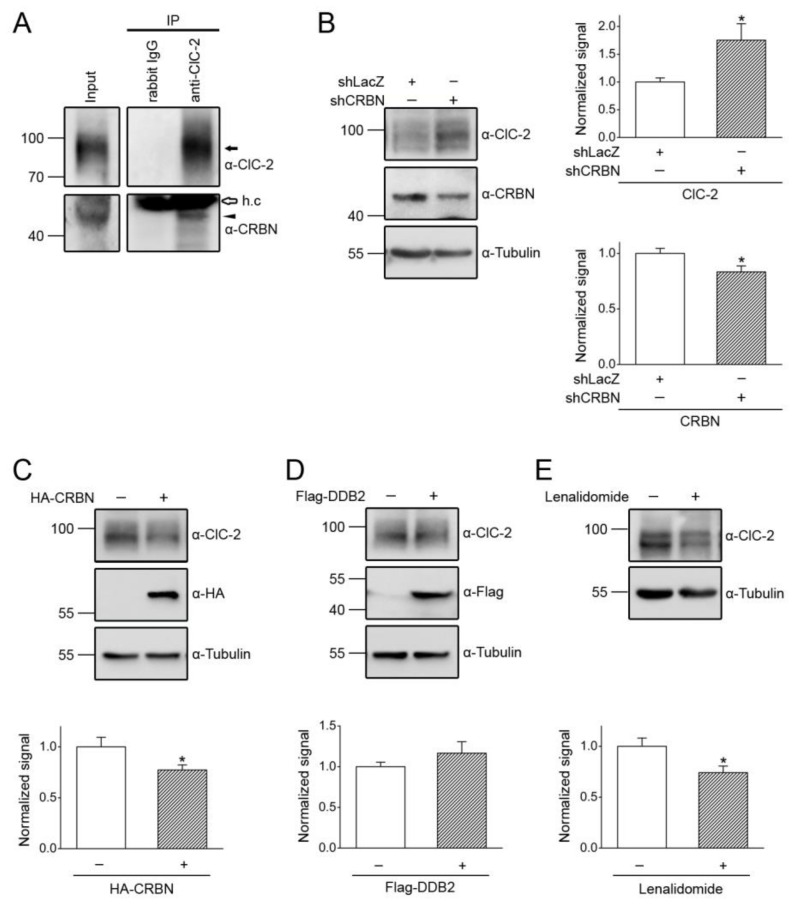
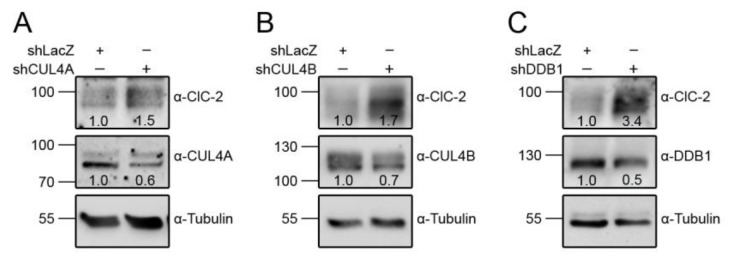
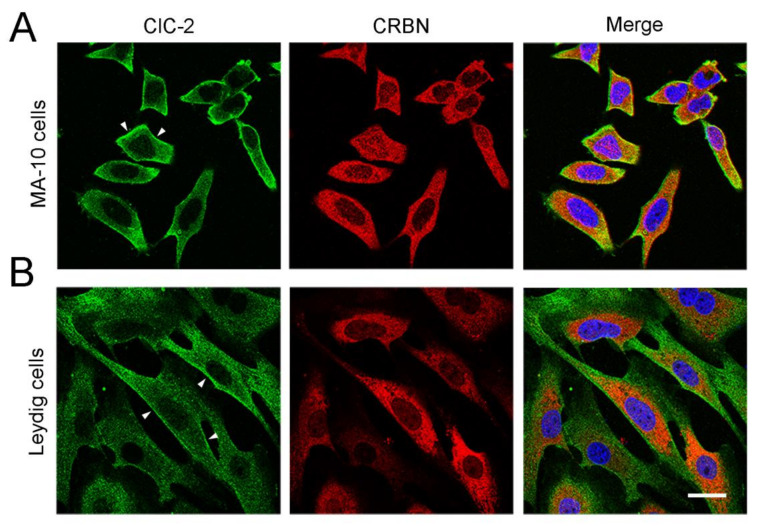
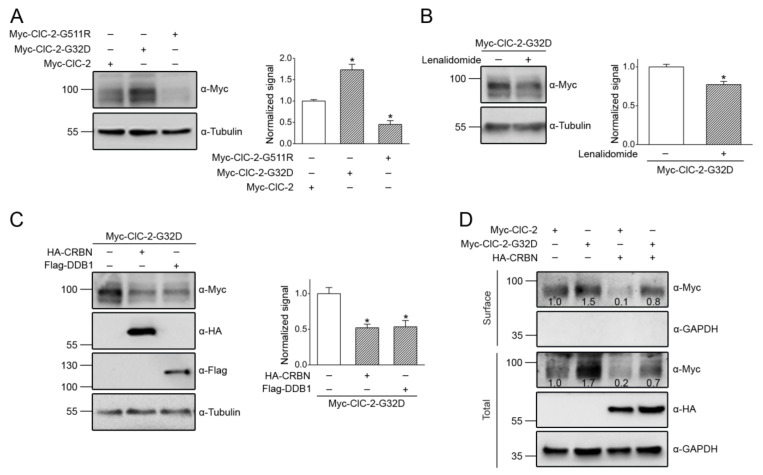
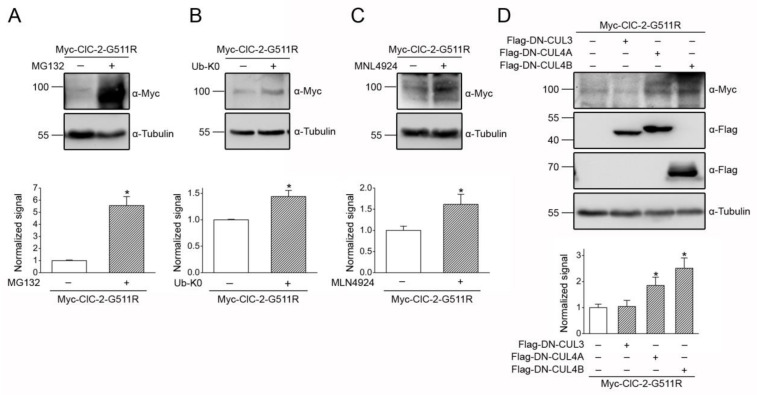
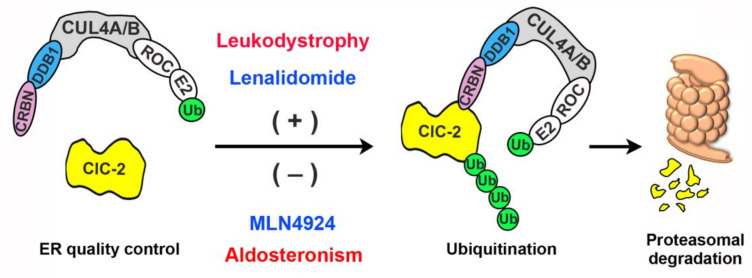
Voltage-gated ClC-2 channels are essential for chloride homeostasis. Complete knockout of mouse ClC-2 leads to testicular degeneration and neuronal myelin vacuolation. Gain-of-function and loss-of-function mutations in the ClC-2-encoding human CLCN2 gene are linked to the genetic diseases aldosteronism and leukodystrophy, respectively. The protein homeostasis (proteostasis) mechanism of ClC-2 is currently unclear. Here, we aimed to identify the molecular mechanism of endoplasmic reticulum-associated degradation of ClC-2, and to explore the pathophysiological significance of disease-associated anomalous ClC-2 proteostasis. In both heterologous expression system and native neuronal and testicular cells, ClC-2 is subject to significant regulation by cullin-RING E3 ligase-mediated polyubiquitination and proteasomal degradation. The cullin 4 (CUL4)-damage-specific DNA binding protein 1 (DDB1)-cereblon (CRBN) E3 ubiquitin ligase co-exists in the same complex with and promotes the degradation of ClC-2 channels. The CRBN-targeting immunomodulatory drug lenalidomide and the cullin E3 ligase inhibitor MLN4924 promotes and attenuates, respectively, proteasomal degradation of ClC-2. Analyses of disease-related ClC-2 mutants reveal that aldosteronism and leukodystrophy are associated with opposite alterations in ClC-2 proteostasis. Modifying CUL4 E3 ligase activity with lenalidomide and MLN4924 ameliorates disease-associated ClC-2 proteostasis abnormality. Our results highlight the significant role and therapeutic potential of CUL4 E3 ubiquitin ligase in regulating ClC-2 proteostasis.

Keywords: MG132; MLN4924; channelopathy; cullin E3 ubiquitin ligase; lenalidomide; polyubiquitination; proteasomal degradation.


Conflict of interest statement

The authors declare no competing financial interests.

Figures

Figure 1
Figure 1
CUL4 mediates the protein degradation of ClC-2 channels. Myc- or Flag-tagged mouse ClC-2 channels (Myc-ClC-2, Flag-ClC-2) were overexpressed in HEK293T cells. (A,B) (Upper panels) Representative immunoblots showing the effect of 24-h treatment of 10 μM MG132 (in 0.1% DMSO) (A) or 10 μM MLN4924 (in 0.1% DMSO) (B) on the protein expression of Myc-ClC-2. The molecular weight markers (in kilodaltons) and immunoblotting antibodies (α-Myc and α-Tubulin) are labeled to the left and right, respectively. Tubulin was used as the loading control. (Lower panels) Quantification of relative ClC-2 protein levels. Protein density was standardized as the ratio of the ClC-2 signal to the cognate tubulin signal. Values from the MG-132-treated or the MLN4924-treated groups (hatched bars) were then normalized to those for the corresponding control (clear bars). Asterisks denote a significant difference from the control (*, t test: p < 0.05; n = 6–12). (C) (Upper panel) Representative immunoblots illustrating the effect of co-expressing Flag-tagged dominant-negative cullins (Flag-DN-CULs) on Myc-ClC-2. Co-expression with the Flag vector was used as the control experiment. GAPDH was used as the loading control. (Lower panel) Quantification of relative ClC-2 protein levels in the presence of various Flag-DN-CUL constructs (*, t test: p < 0.05; n = 7–16). (D) Representative immunoblots showing the effect of shRNA knockdown of endogenous CUL4A/B (shCUL4A/B) in HEK293T cells on Myc-ClC-2. Infection with shLacZ was used as the control experiment. Tubulin was used as the loading control. The numbers on the immunoblot denote the relative ClC-2 protein levels. (E) Co-immunoprecipitation of Flag-ClC-2 and Myc-CUL4A/B. Cells were incubated in 10 μM MG132 for 24 h before being solubilized. Co-expression with the Myc vector was used as the control experiment. Cell lysates were immunoprecipitated (IP) with α-Myc, followed by immunoblotting (IB) of the immunoprecipitates with α-Myc or the anti-Flag antibody (α-Flag). Corresponding expression levels of ClC-2 and CUL4A/B in the lysates are shown in the Input lane. In all cases hereafter, input represents about 10% of the total protein used for immunoprecipitation.
Figure 2
Figure 2
DDB1 and CRBN enhance ClC-2 protein degradation. (A,B) Co-immunoprecipitation of Myc-ClC-2 and Flag-DDB1 (A), as well as of Flag-ClC-2 and HA-tagged CRBN (HA-CRBN) (B), in HEK293T cells. Flag-DDB1 and HA-CRBN were recognized with α-Flag and the anti-HA antibody (α-HA), respectively. (C) Interaction of endogenous CRBN with ClC-2 in the rat brain. Whole brain lysates were immunoprecipitated with the anti-ClC-2 antibody (α-ClC-2), followed by immunoblotting of the immunoprecipitates with α-ClC-2 or the anti-CRBN antibody (α-CRBN). Co-immunoprecipitation of CRBN was achieved by using α-ClC-2 but not by rabbit IgG (α-IgG). l.c.: IgG light chain. (DE) (Upper panels) Representative immunoblots showing the effect of Flag-DDB1 (D) or HA-CRBN (E) co-expression on the Myc-ClC-2 protein level. Co-expression with the Flag or the HA vector was used as the control experiment. (Lower panels) Quantification of the relative ClC-2 protein levels. Values from the DDB1 or the CRBN co-expression groups (hatched bars) were normalized to those for the corresponding vector control (clear bars) (*, t test: p < 0.05; n = 7–10). (F) (Upper panel) Representative immunoblots showing the lack of an effect of Flag-DDB2 co-expression on the Myc-ClC-2 protein level. Co-expression with the Flag vector was used as the control experiment. (Lower panel) Quantification of relative ClC-2 protein levels (t test: p > 0.05; n = 3). (G) Representative immunoblots showing the effect of shRNA knockdown of endogenous DDB1 (shDDB1) or CRBN (shCRBN) in HEK293T cells on Myc-ClC-2. Infection with shLacZ was used as the control experiment. The numbers on the immunoblot denote the relative ClC-2 protein levels.
Figure 3
Figure 3
DDB1 and CRBN reduce ClC-2 protein stability. Representative immunoblots showing the effect of vector (A), DDB1 (B), or CRBN (C) co-expression on ClC-2 protein turnover kinetics in HEK293T cells. Transfected cells were subject to different treatment durations (0 to 8 h) of the protein synthesis inhibitor cycloheximide (CHX). Protein densities were normalized to those of corresponding no-treatment controls at 0 h. The numbers on the immunoblot denote relative ClC-2 protein levels.
Figure 4
Figure 4
CUL4 E3 ligase promotes polyubiquitination of ClC-2 channels. (A) (Upper panel) Representative immunoblots showing the effect of the 24-h treatment of HA-tagged lysine-less ubiquitin (HA-Ub-K0) co-expression on the protein expression of Myc-ClC-2 in HEK293T cells. (Lower panel) Quantification of the relative ClC-2 protein levels. Protein density was standardized as the ratio of the ClC-2 signal to the cognate tubulin signal. Value from the Ub-K0 co-expression group (hatched bar) was then normalized to those for the vector control (clear bar). Asterisks denote a significant difference from the control (*, t test: p < 0.05; n = 5). (B,C) Representative immunoblots showing the effect of Flag-DN-CUL4A/B (B) or HA-CRBN (C) co-expression on ClC-2 polyubiquitination (ClC-2-(Ub)n) by HA-tagged ubiquitin (HA-Ub). Co-expression with the Flag/HA vector was used as the control experiment. The numbers shown on the immunoblot denote densitometric quantification of the relative ClC-2 ubiquitination with respect to the vector control. Cell lysates were immunoprecipitated (IP) with α-Myc/Flag, and protein ubiquitination was recognized by immunoblotting the immunoprecipitates with α-HA.
Figure 5
Figure 5
Regulation of endogenous ClC-2 expression by CUL4. (A) (Left) Endogenous expression of ClC-2 in the mouse testis. (Right) Verification of the specificity of α-ClC-2 in testes. Mouse ClC-2 protein detection was prevented by preabsorbing the immunoblot with a control antigen peptide. The protein band corresponding to mouse ClC-2 is highlighted with the black arrow. (B) (Upper panel) Representative immunoblot showing the effect of shRNA knockdown on the endogenous expression of ClC-2 in the mouse MA-10 Leydig cell. ClC-2 protein detection in MA-10 cells was prevented by infection with shRNA targeting specific mouse ClC-2 sequences (shClC-1 #1 and #2). shRNA targeting a LacZ sequence (shLacZ) was used as the control experiment. (Lower panel) Quantification of relative ClC-2 protein levels. Protein density was standardized as the ratio of the ClC-2 signal to the cognate GAPDH signal. Values from the shClC-2 groups (hatched bars) were then normalized to those for the corresponding shLacZ control (clear bar). Asterisk denotes a significant difference from the control (*, t test: p < 0.05; n = 4). (C) (Upper panel) Representative immunoblot showing the effect of the 24-h treatment of 10 μM MG132 on endogenous ClC-2 expression in MA-10 cells. (Lower panel) Quantification of the relative ClC-2 protein levels (*, t test: p < 0.05; n = 5). (D) (Upper panel) Representative immunoblot showing the effect of the 24-h treatment of 10 μM MLN4924 on endogenous ClC-2 expression in MA-10 cells. (Lower panel) Quantification of relative ClC-2 protein levels (*, t test: p < 0.05; n = 7). (E) Representative immunoblot showing the effect of MLN4924 treatment on endogenous ClC-2 expression in cultured rat cortical neurons. The numbers on the immunoblot denote the relative ClC-2 protein levels. (F) (Upper panel) Representative immunoblot showing the effect of Flag-DN-CUL4A overexpression on endogenous ClC-2 expression in MA-10 cells. Co-expression with the Flag vector was used as the control experiment. (Lower panel) Quantification of the relative ClC-2 protein levels (*, t test: p < 0.05; n = 7).
Figure 6
Figure 6
Endogenous expression of CUL4 E3 ligase in testes and Leydig cells. Representative immunoblots showing the endogenous expression of ClC-2 (A), CUL4A (B), CUL4B (C), DDB1 (D), and CRBN (E) in lysates prepared from mouse testes or cultured mouse Leydig cells. Approximately 30 µg of protein was loaded into each lane.
Figure 7
Figure 7
CRBN promotes degradation of endogenous ClC-2. (A) Co-immunoprecipitation of endogenous CRBN and ClC-2 in the mouse testis. Mouse testis lysates were immunoprecipitated with α-ClC-2 or the rabbit IgG. The protein bands corresponding to endogenous ClC-2 and CRBN are highlighted with the black arrow and the black arrowhead, respectively. The open arrow denotes the IgG heavy chain (h.c.). (B) (Left panel) Representative immunoblot showing the effect of shRNA knockdown of CRBN (shCRBN) on endogenous ClC-2 expression in the mouse MA-10 Leydig cell. Infection with shLacZ was used as the control experiment. (Right panels) Quantification of relative ClC-2 and CRBN protein levels. Protein density was standardized as the ratio of the ClC-2 signal to the cognate tubulin signal. Values from the shCRBN groups (hatched bars) were then normalized to those for the corresponding shLacZ control (clear bar). Asterisk denotes a significant difference from the control (*, t test: p < 0.05; n = 7). (C) (Upper panel) Representative immunoblot showing the effect of HA-CRBN overexpression on endogenous ClC-2 expression in MA-10 cells. Co-expression with the HA vector was used as the control experiment. (Lower panel) Quantification of relative ClC-2 protein levels (*, t test: p < 0.05; n = 7). (D) (Upper panel) Representative immunoblot showing the lack of an effect of Flag-DDB2 overexpression on endogenous ClC-2 expression in MA-10 cells. Co-expression with the Flag vector was used as the control experiment. (Lower panel) Quantification of relative ClC-2 protein levels (t test: p > 0.05; n = 9). (E) (Upper panel) Representative immunoblot showing the effect of the 24-h treatment of 10 μM lenalidomide (in 0.1% DMSO) on endogenous ClC-2 expression in MA-10 cells. (Lower panel) Quantification of relative ClC-2 protein levels (*, t test: p < 0.05; n = 6).
Figure 8
Figure 8
CUL4 and DDB1 promote the degradation of endogenous ClC-2. Representative immunoblots showing the effect of shRNA knockdown of CUL4A (shCUL4A) (A), CUL4B (shCUL4B) (B), or DDB1 (shCDDB1) (C) on endogenous ClC-2 expression in MA-10 cells. Infection with shLacZ was used as the control experiment. The numbers on the immunoblot denote the relative ClC-2 protein levels.
Figure 9
Figure 9
Subcellular localization of endogenous ClC-2 and CRBN. Representative confocal micrographs showing the immunofluorescence staining patterns of endogenous ClC-2 (green) and CRBN (red) in MA-10 cells (A) and cultured mouse Leydig cells (B). Merged images of ClC-2 and CRBN signals are shown in the rightmost panels, where cells were also stained with DAPI (blue) as a nuclear counterstain. Fixed cells were stained with the indicated antibodies under the permeabilized configuration. Arrowheads denote plasma membrane localization of ClC-2. Scale bar = 25 μm. Data are representative of three independent experiments.
Figure 10
Figure 10
Aldosteronism-associated gain-of-function alteration in ClC-2 proteostasis. (A) (Upper panel) Representative immunoblot comparing the protein expression of Myc-ClC-2 WT, aldosteronism-related G32D mutant, and leukodystrophy-related G511R mutant overexpressed in HEK293T cells. (Lower panel) Quantification of relative ClC-2 protein levels. Protein density was standardized as the ratio of the ClC-2 signal to the cognate tubulin signal. Values from the mutant groups (hatched bars) were then normalized to those for the corresponding WT control (clear bars). Asterisks denote a significant difference from the WT (*, t test: p < 0.05; n = 7–9). (B) (Upper panel) Representative immunoblot showing the effect of the 24-h treatment of 10 μM lenalidomide on the Myc-ClC-2 G32D mutant. (Lower panel) Quantification of the relative ClC-2 G32D protein levels (*, t test: p < 0.05; n = 7). (C) (Upper panel) Representative immunoblot showing the effect of HA-CRBN or Flag-DDB1 co-expression on the Myc-ClC-2 G32D mutant. (Lower panel) Quantification of the relative ClC-2 G32D protein levels (*, t test: p < 0.05; n = 4–6). (D) Representative immunoblot showing the enhanced surface expression of the Myc-ClC-2 G32D mutant, as well as its reduction by CRBN co-expression. Cell lysates from surface-biotinylated intact HEK293T cells were subject to either direct immunoblotting analyses (Total) or streptavidin pull-down prior to immunoblotting (Surface). The numbers on the immunoblot denote the relative ClC-2 protein levels.
Figure 11
Figure 11
CUL4 E3 ligase contributes to leukodystrophy-associated defective ClC-2 proteostasis. (A) (Upper panel) Representative immunoblot showing the effect of the 24-h treatment of 10 μM MG132 on the Myc-ClC-2 G511R mutant in HEK293T cells. (Lower panel) Quantification of the relative ClC-2 G511R protein levels (*, t test: p < 0.05; n = 6). (B) (Upper panel) Representative immunoblot showing the effect of the 24-h treatment of HA-UB-K0 co-expression on the Myc-ClC-2 G511R mutant. (Lower panel) Quantification of relative ClC-2 G511R protein levels (*, t test: p < 0.05; n = 3). (C) (Upper panel) Representative immunoblot showing the effect of the 24-h treatment of 10 μM MLN4924 on the Myc-ClC-2 G511R mutant. (Lower panel) Quantification of the relative ClC-2 G511R protein levels (*, t test: p < 0.05; n = 4). (D) (Upper panel) Representative immunoblot showing the effect of Flag-DN-CUL3/CUL4A/CUL4B co-expression on the Myc-ClC-2 G511R mutant. (Lower panel) Quantification of the relative ClC-2 G511R protein levels (*, t test: p < 0.05; n = 6).
Figure 12
Figure 12
Schematic model of endoplasmic reticulum (ER)-associated degradation of ClC-2. In this schematic diagram of the regulation of ClC-2 proteostasis by ER quality control, the scaffold protein CUL4A/B forms a protein complex with the adaptor protein DDB1 and the substrate receptor protein CRBN. CUL4A/B also interacts with the RING-finger protein ROC, which in turn recruits the E2 ubiquitin conjugating enzyme (E2) that transfers ubiquitin (Ub) for covalent linkage to a substrate protein. We propose that, through the direct interaction between CRBN and ClC-2, the CUL4A/B-DDB1-CRBN E3 ubiquitin ligase complex catalyzes the ubiquitination of misfolded ClC-2 proteins. Ubiquitinated ClC-2 is subsequently targeted for proteasomal degradation. Loss-of-function, leukodystrophy-causing mutations may instigate substantial protein misfolding, leading to enhanced degradation of mutant ClC-2 proteins. In contrast, gain-of-function aldosteronism-causing mutations appear to facilitate protein stability, thereby reducing proteasomal degradation of mutant ClC-2 channels. The CRBN-targeting immunomodulatory drug lenalidomide effectively promotes, whereas the cullin E3 ligase inhibitor MLN4924 significantly attenuates, proteasomal degradation of both ClC-2 WT and disease-associated mutant proteins.

Similar articles

Cited by

References

    1. Cid L.P., Montrose-Rafizadeh C., Smith D.I., Guggino W.B., Cutting G.R. Cloning of a putative human voltage-gated chloride channel (CIC-2) cDNA widely expressed in human tissues. Hum. Mol. Genet. 1995;4:407–413. doi: 10.1093/hmg/4.3.407. - DOI - PubMed
    1. Thiemann A., Grunder S., Pusch M., Jentsch T.J. A chloride channel widely expressed in epithelial and non-epithelial cells. Nature. 1992;356:57–60. doi: 10.1038/356057a0. - DOI - PubMed
    1. Sik A., Smith R.L., Freund T.F. Distribution of chloride channel-2-immunoreactive neuronal and astrocytic processes in the hippocampus. Neuroscience. 2000;101:51–65. doi: 10.1016/S0306-4522(00)00360-2. - DOI - PubMed
    1. Gyomorey K., Yeger H., Ackerley C., Garami E., Bear C.E. Expression of the chloride channel ClC-2 in the murine small intestine epithelium. Am. J. Physiol. Cell Physiol. 2000;279:1787–1794. doi: 10.1152/ajpcell.2000.279.6.C1787. - DOI - PubMed
    1. Jentsch T.J., Pusch M. CLC Chloride Channels and Transporters: Structure, Function, Physiology, and Disease. Physiol. Rev. 2018;98:1493–1590. doi: 10.1152/physrev.00047.2017. - DOI - PubMed

Publication types

MeSH terms