

A tutorial on frailty models
- PMID: 32466712
- PMCID: PMC7534210
- DOI: 10.1177/0962280220921889
A tutorial on frailty models
Abstract
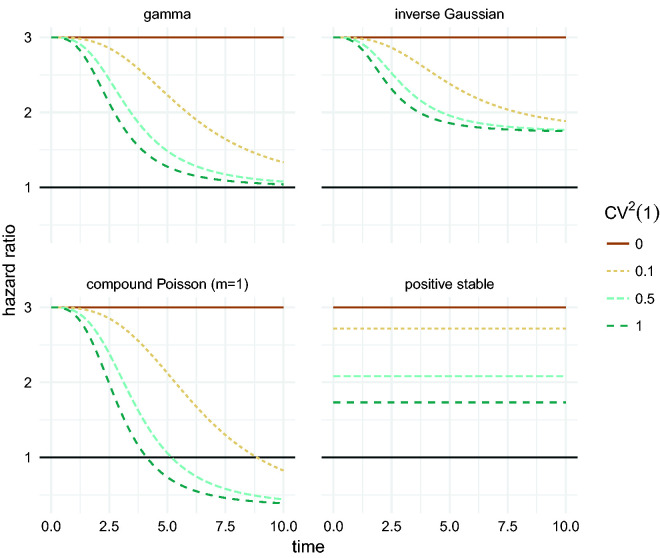
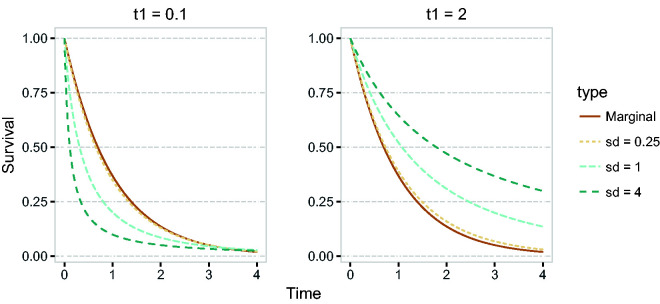
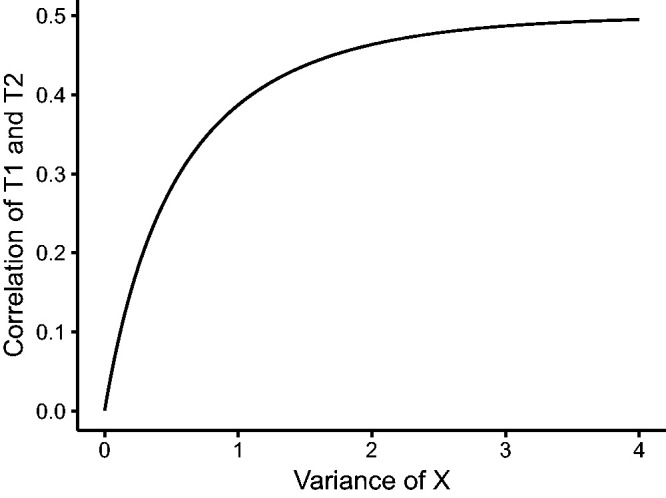
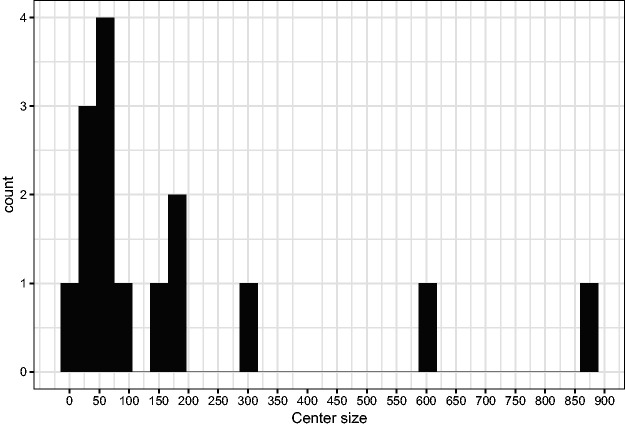
The hazard function plays a central role in survival analysis. In a homogeneous population, the distribution of the time to event, described by the hazard, is the same for each individual. Heterogeneity in the distributions can be accounted for by including covariates in a model for the hazard, for instance a proportional hazards model. In this model, individuals with the same value of the covariates will have the same distribution. It is natural to think that not all covariates that are thought to influence the distribution of the survival outcome are included in the model. This implies that there is unobserved heterogeneity; individuals with the same value of the covariates may have different distributions. One way of accounting for this unobserved heterogeneity is to include random effects in the model. In the context of hazard models for time to event outcomes, such random effects are called frailties, and the resulting models are called frailty models. In this tutorial, we study frailty models for survival outcomes. We illustrate how frailties induce selection of healthier individuals among survivors, and show how shared frailties can be used to model positively dependent survival outcomes in clustered data. The Laplace transform of the frailty distribution plays a central role in relating the hazards, conditional on the frailty, to hazards and survival functions observed in a population. Available software, mainly in R, will be discussed, and the use of frailty models is illustrated in two different applications, one on center effects and the other on recurrent events.
Keywords: Correlated failure times; frailty models; random effects models; survival analysis; unobserved heterogeneity.
Figures


Similar articles
-
Nonproportional hazards and unobserved heterogeneity in clustered survival data: When can we tell the difference?Stat Med. 2019 Aug 15;38(18):3405-3420. doi: 10.1002/sim.8171. Epub 2019 May 3. Stat Med. 2019. PMID: 31050028 Free PMC article.
-
Individual frailty excess hazard models in cancer epidemiology.Stat Med. 2023 Mar 30;42(7):1066-1081. doi: 10.1002/sim.9657. Epub 2023 Jan 24. Stat Med. 2023. PMID: 36694108 Free PMC article.
-
Comparison of statistical methods for the analysis of recurrent adverse events in the presence of non-proportional hazards and unobserved heterogeneity: a simulation study.BMC Med Res Methodol. 2022 Jan 20;22(1):24. doi: 10.1186/s12874-021-01475-8. BMC Med Res Methodol. 2022. PMID: 35057743 Free PMC article. Clinical Trial.
-
Frailty models for survival data.Lifetime Data Anal. 1995;1(3):255-73. doi: 10.1007/BF00985760. Lifetime Data Anal. 1995. PMID: 9385105 Review.
-
Some recent developments for regression analysis of multivariate failure time data.Lifetime Data Anal. 1995;1(4):403-15. doi: 10.1007/BF00985452. Lifetime Data Anal. 1995. PMID: 9385112 Review.
Cited by
-
Treatment in certified cancer centers is related to better survival in patients with colon and rectal cancer: evidence from a large German cohort study.World J Surg Oncol. 2024 Jan 6;22(1):11. doi: 10.1186/s12957-023-03262-9. World J Surg Oncol. 2024. PMID: 38183134 Free PMC article.
-
Increasing disparities in the proportions of active treatment and 5-year overall survival over time by age groups among older patients with gastric cancer in Korea.Front Public Health. 2023 Jan 9;10:1030565. doi: 10.3389/fpubh.2022.1030565. eCollection 2022. Front Public Health. 2023. PMID: 36699910 Free PMC article.
-
Association between neuromuscular blocking agent use and outcomes among out-of-hospital cardiac arrest patients treated with extracorporeal cardiopulmonary resuscitation and target temperature management: A secondary analysis of the SAVE-J II study.Resusc Plus. 2023 Sep 26;16:100476. doi: 10.1016/j.resplu.2023.100476. eCollection 2023 Dec. Resusc Plus. 2023. PMID: 37779884 Free PMC article.
-
Developing prediction models to estimate the risk of two survival outcomes both occurring: A comparison of techniques.Stat Med. 2023 Aug 15;42(18):3184-3207. doi: 10.1002/sim.9771. Epub 2023 May 23. Stat Med. 2023. PMID: 37218664 Free PMC article.
-
Aspartate aminotransferase to alanine aminotransferase ratio and short-term prognosis of patients with type 2 diabetes hospitalized for heart failure.Arch Med Sci. 2024 Oct 22;20(5):1416-1425. doi: 10.5114/aoms/184153. eCollection 2024. Arch Med Sci. 2024. PMID: 39649287 Free PMC article.
References
-
- Cox DR. Regression models and life-tables. J Royal Stat Soc, Ser B (Methodological) 1972; 34: 187–220.
-
- Woodbury MA, Manton KG. A random-walk model of human mortality and aging. Theoretical Population Biol 1977; 52: 37–48. - PubMed
-
- Vaupel JW, Manton KG, Stallard E. The impact of heterogeneity in individual frailty on the dynamics of mortality. Demography 1979; 16: 439–454. DOI:10.2307/2061224. - PubMed
-
- Heckman J, Singer B. A method for minimizing the impact of distributional assumptions in econometric models for duration data. Econometrica: J Econometric Soc 1984; 52: 271–320.
-
- Vaupel JW, Yashin AI. Heterogeneity’s ruses: some surprising effects of selection on population dynamics. Am Stat 1985; 39: 176–185. - PubMed
MeSH terms
LinkOut - more resources
Full Text Sources
