. 2020 Jul 17;295(29):9901-9916.
doi: 10.1074/jbc.RA120.012877. Epub 2020 May 27.

The BADC and BCCP subunits of chloroplast acetyl-CoA carboxylase sense the pH changes of the light-dark cycle

Affiliations

The BADC and BCCP subunits of chloroplast acetyl-CoA carboxylase sense the pH changes of the light-dark cycle

Yajin Ye et al. J Biol Chem. .

Abstract

Acetyl-CoA carboxylase (ACCase) catalyzes the first committed step in the de novo synthesis of fatty acids. The multisubunit ACCase in the chloroplast is activated by a shift to pH 8 upon light adaptation and is inhibited by a shift to pH 7 upon dark adaptation. Here, titrations with the purified ACCase biotin attachment domain-containing (BADC) and biotin carboxyl carrier protein (BCCP) subunits from Arabidopsis indicated that they can competently and independently bind biotin carboxylase (BC) but differ in responses to pH changes representing those in the plastid stroma during light or dark conditions. At pH 7 in phosphate buffer, BADC1 and BADC2 gain an advantage over BCCP1 and BCCP2 in affinity for BC. At pH 8 in KCl solution, however, BCCP1 and BCCP2 had more than 10-fold higher affinity for BC than did BADC1. The pH-modulated shifts in BC preferences for BCCP and BADC partners suggest they contribute to light-dependent regulation of heteromeric ACCase. Using NMR spectroscopy, we found evidence for increased intrinsic disorder of the BADC and BCCP subunits at pH 7. We propose that this intrinsic disorder potentially promotes fast association with BC through a "fly-casting mechanism." We hypothesize that the pH effects on the BADC and BCCP subunits attenuate ACCase activity by night and enhance it by day. Consistent with this hypothesis, Arabidopsis badc1 badc3 mutant lines grown in a light-dark cycle synthesized more fatty acids in their seeds. In summary, our findings provide evidence that the BADC and BCCP subunits function as pH sensors required for light-dependent switching of heteromeric ACCase activity.

Keywords: Arabidopsis; biophysics; fatty acid biosynthesis; intrinsic disorder; intrinsically disordered protein; lipid synthesis; nuclear magnetic resonance (NMR); pH regulation; plant biochemistry; protein–protein interaction; thermodynamics.


Conflict of interest statement

Conflict of interest—The authors declare that they have no conflicts of interest with the contents of this article.

Figures
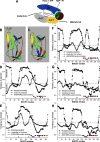
Figure 1.
Figure 1.
In chloroplast ACCase, the sequences of the BADC and BCCP subunits suggest both folded and disordered regions. A, the cartoon of heteroACCase indicates the types of subunits in the biotin carboxylase and carboxyltransferase subcomplexes, as well as the overall reaction. B and C, homology models of the folded domains of BCCP2 (B) and BADC1 (C) from A. thaliana. The ribbon is colored with the spectrum from purple at the N-terminal end to red at the C terminus. D–H, plot order predictions by MetaDisorderMD2 (using multiple algorithms at the GeneSilico server) with black squares versus sequence numbering of the mature forms of the BCCP1 (D), BCCP2 (E), BADC1 (F), BADC2 (G), and BADC3 (H) subunits. Values of >0.5 are considered disordered. ANCHOR2 (open circles) predicts potential regions of protein binding where the values exceed 0.5. The location of β-strands predicted by homology modeling using the EXPASY server are marked with arrowheads. T marks residues predicted to be part of the loop called the thumb. B represents the lysine that becomes biotinylated. A histidine is marked H in the folded region or h in an unfolded region.
Figure 2.
Figure 2.
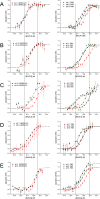
Affinities for BC of BADC and BCCP subunits measured by microscale thermophoresis (MST). The titrations were measured in HEPES buffer with 140 mm KCl (left) or phosphate buffer with 140 mm NaCl or KCl (right), with n = 3 technical replicates providing the S.D. of each point. Recombinant BC (19.5 nm) was titrated by recombinant BCCP1 (A), BCCP2 (B), BADC1 (C), BADC2 (D), or BADC3 (E). Black squares mark titrations at pH 7.0. Red circles mark titrations at pH 8.0. Green triangles mark titrations in phosphate buffer, named PBK, that replaces NaCl with KCl. Vertical gray lines mark the strongest and weakest KD in each column of panels.
Figure 3.
Figure 3.
Dependence of affinities for BC on pH, buffer, cation, and partner subunit. The Gibbs free energies of the associations between the BC subunit and each of the BCCP or BADC subunits are from the KD values fitted to the titrations plotted in Fig. 2 and listed in Table 1. The buffer ion is symbolized by the shape of the symbol, with a square representing HEPES, a triangle for phosphate buffer, and a circle comparing phosphate with HEPES. Open symbols represent pH 8, filled symbols pH 7. Orange represents Na+ ions present and violet for K+ ions. More negative quantities denote higher affinity for BC. Dashed lines connect results at pH 7 and 8. A, affinities for BC are compared between KCl and NaCl solutions. Comparison of Na+ and K+ ions at pH 7 is colored half orange and half violet. Comparison of Na+ and K+ ions at pH 8 is colored on the perimeter to represent K+ and in the interior to represent Na+. The diagonal line marks equivalence in affinity. B, the effects of pH and cation are compared again as differences (ΔΔG) from titrations in buffer at pH 8. Half-filled, half-open symbols compare pH 7 with pH 8 as a reference. A negative value means the titration displayed greater affinity than that of the titration at pH 8. The titration in PBS at pH 8 is the reference for the titration in PBK at pH 8. C, the difference in binding free energy between that in the phosphate buffer and that in HEPES buffer at the same pH is plotted for each of the titrations of BC with a small subunit. The two-color code is that of panel A. D, the difference in the binding free energy is plotted, relative to BCCP1 titrations, for each of the five buffer compositions used in the titrations. A negative ΔΔG specifies higher affinity than that in the BC titration with BCCP1. The error bars reflect uncertainties in curve fitting and propagation of the errors through differences between titrations.
Figure 4.
Figure 4.
Amide NMR spectra observe partial unfolding at the near-neutral end of the physiological pH range. Amide NMR spectra from pH titrations of BCCP1 (A–D), BCCP2 (E–H), and BADC1 (I–L) were collected on 15N-labeled samples of 150 to 180 μm in PBS buffer at 800 MHz using the BEST-TROSY pulse sequence of reference . Each panel shows a single spectrum. The peaks with the blue contours represent the folded domain. The peaks with red contours are attributable to partial unfolding. Complete unfolding of BCCP1 is observed at pH 4.7 in panel D.
Figure 5.
Figure 5.
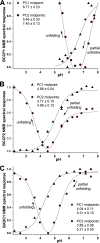
pH dependence of NMR spectra finds BCCP1 more sensitive to unfolding by mild acidification than BCCP2 or BADC1. The largest trends of pH-dependent change of BCCP1 (A), BCCP2 (B), and BADC1 (C) were derived as principal components (PCs) directly from the 15N BEST-TROSY spectra (34, 36). PC1 is marked with black triangles and PC2 with red circles. PC1 was fitted to Equation 4 and PC2 fitted to Equation 5 using TREND NMR software (35). The midpoints of the fitted pH-dependent changes are listed with the uncertainties in the fits. The curves fit the data points with R2 of 0.93, 0.99, and 0.98 for BCCP1, BCCP2, and BADC1, respectively. The changes in the appearance of the NMR spectra are attributable to partial unfolding or complete unfolding of the structured domain at lower pH.
Figure 6.
Figure 6.
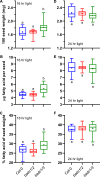
Increase in seed oil content of the Arabidopsis badc1 badc3 mutant depends on light conditions during growth. The WT (Col-0, blue) and the double mutants badc1 badc2 (badc1/2, red) and badc1 badc3 (badc1/3, green) were grown together in a 16/8 h light/dark cycle (A–C) or under 24 h of constant light (D–F). Harvested seeds were analyzed for seed weight (A, D), fatty acid content per seed (B, E), and fatty acid content as a percentage of seed weight (C, F). Each measurement utilized 100 seeds from a single plant and 15–18 separate individual plant replicates. Box-and-whisker plot: box, 25th to 75th percentile; line, median; +, mean; whiskers, the range of minimum to maximum. Significant differences between lines (one-way analysis of variance, p < 0.05) are indicated by different letters.
Figure 7.
Figure 7.
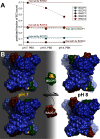
Predicted shifts in occupation of BC by BADC1 and BCCP1 between dark conditions of pH 7 and daylight conditions of pH 8. This prediction is based on the BC affinities for BCCP and BADC subunits, protein levels of these subunits during development of seeds in Arabidopsis siliques (19), and the simplifying assumption that the small subunit binds independently to BC. A, the saturation of BC by each subunit is calculated using Equation 3, KD measured in phosphate solution (Table 1), and the subunit concentrations in siliques given in Table S1, scaled up by the 400-mg/ml protein present in plastids (63). The horizontal lines indicate the maximum possible levels of saturation of BC by that subunit based on the concentrations in Table S1. B, the anticipated pH-dependent shift in the equilibrium binding of BC by the BADC1 and BCCP1 subunits that are abundant in plastids is depicted. The crystallographic coordinates (PDB entry 4HR7) of the BC subcomplex from E. coli (16) shows a tetramer of BC subunits in shades of blue and the folded domain of the BCCP subunits in green, with the conserved site of biotinylation (sequence of MKM) colored yellow. The homology model of the folded domain of BADC1 (brown) from Arabidopsis is superimposed on selected BCCP chains bound to a BC subunit in the crystal structure. Arabidopsis BCCP1 chains are represented by the E. coli BCCP chains (green) in the crystal structure. This overly simplified representation of the BC subcomplex in Arabidopsis plastids does not portray the range of oligomerization states, associations with other BADC and BCCP subunits, their intrinsic disorder, and the anticipated complexity of the mixtures of structural ensembles.

Similar articles

Cited by

References

    1. Ohlrogge J. B., and Jaworski J. G. (1997) Regulation of fatty acid synthesis. Annu. Rev. Plant Physiol. Plant Mol. Biol. 48, 109–136 10.1146/annurev.arplant.48.1.109 - DOI - PubMed
    1. Sasaki Y., and Nagano Y. (2004) Plant acetyl-CoA carboxylase: structure, biosynthesis, regulation, and gene manipulation for plant breeding. Biosci. Biotechnol. Biochem. 68, 1175–1184 10.1271/bbb.68.1175 - DOI - PubMed
    1. Thelen J. J., and Ohlrogge J. B. (2002) Metabolic engineering of fatty acid biosynthesis in plants. Metab. Eng. 4, 12–21 10.1006/mben.2001.0204 - DOI - PubMed
    1. Cahoon E. B., Shockey J. M., Dietrich C. R., Gidda S. K., Mullen R. T., and Dyer J. M. (2007) Engineering oilseeds for sustainable production of industrial and nutritional feedstocks: solving bottlenecks in fatty acid flux. Curr. Opin. Plant Biol. 10, 236–244 10.1016/j.pbi.2007.04.005 - DOI - PubMed
    1. Salie M. J., and Thelen J. J. (2016) Regulation and structure of the heteromeric acetyl-CoA carboxylase. Biochim. Biophys. Acta 1861, 1207–1213 10.1016/j.bbalip.2016.04.004 - DOI - PubMed

Publication types

MeSH terms

Associated data

LinkOut - more resources