. 2020 Jun 22;147(12):dev178582.
doi: 10.1242/dev.178582.

Canonical Notch signaling controls the early thymic epithelial progenitor cell state and emergence of the medullary epithelial lineage in fetal thymus development

Affiliations

Canonical Notch signaling controls the early thymic epithelial progenitor cell state and emergence of the medullary epithelial lineage in fetal thymus development

Dong Liu et al. Development. .

Abstract

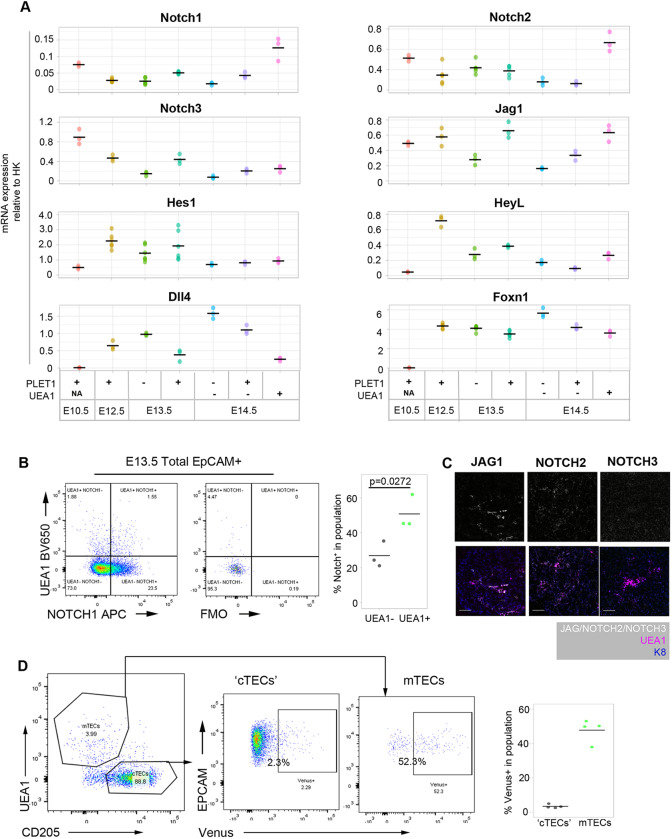
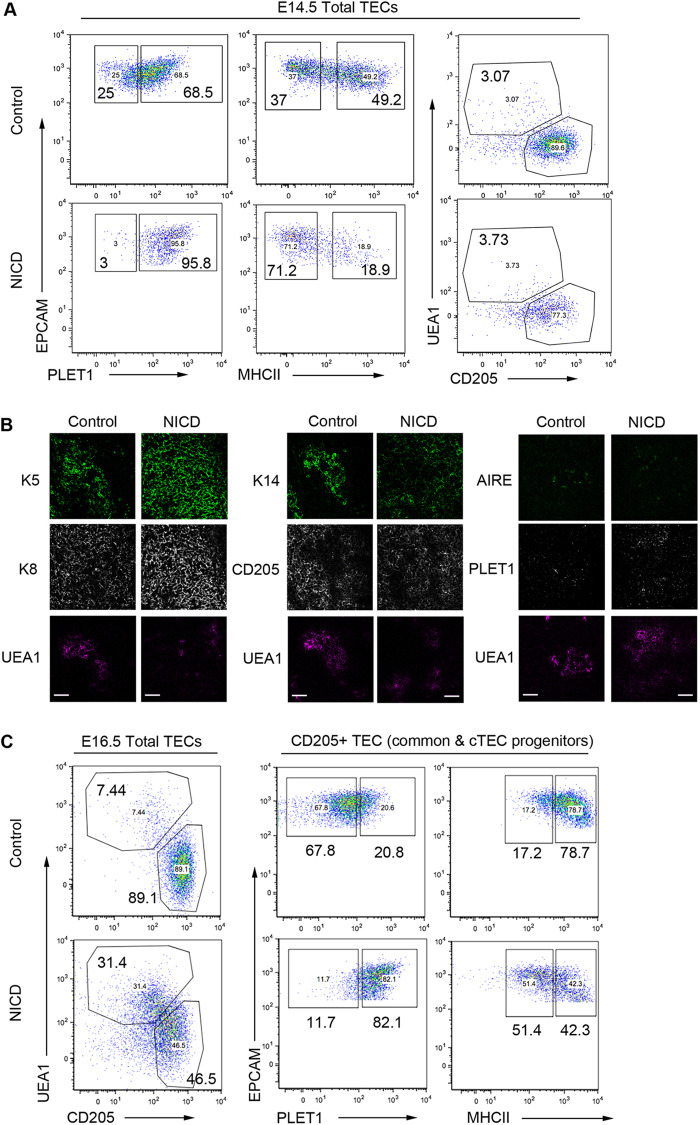
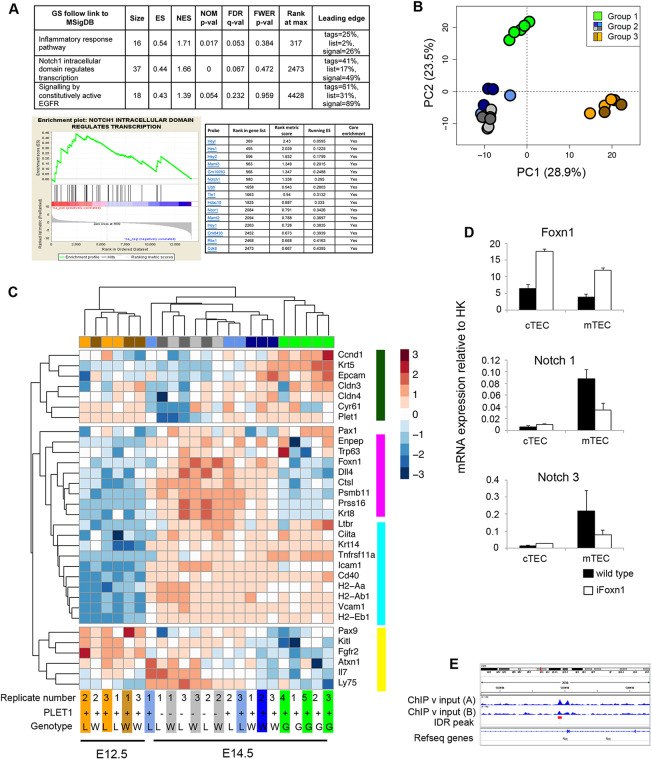
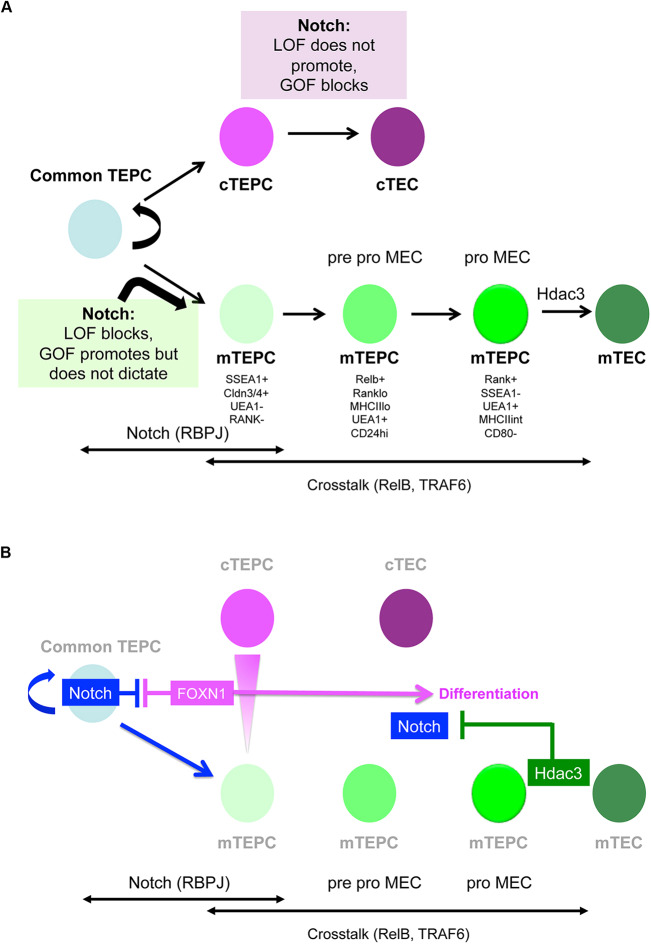
Thymus function depends on the epithelial compartment of the thymic stroma. Cortical thymic epithelial cells (cTECs) regulate T cell lineage commitment and positive selection, while medullary (m) TECs impose central tolerance on the T cell repertoire. During thymus organogenesis, these functionally distinct sub-lineages are thought to arise from a common thymic epithelial progenitor cell (TEPC). However, the mechanisms controlling cTEC and mTEC production from the common TEPC are not understood. Here, we show that emergence of the earliest mTEC lineage-restricted progenitors requires active NOTCH signaling in progenitor TEC and that, once specified, further mTEC development is NOTCH independent. In addition, we demonstrate that persistent NOTCH activity favors maintenance of undifferentiated TEPCs at the expense of cTEC differentiation. Finally, we uncover a cross-regulatory relationship between NOTCH and FOXN1, a master regulator of TEC differentiation. These data establish NOTCH as a potent regulator of TEPC and mTEC fate during fetal thymus development, and are thus of high relevance to strategies aimed at generating/regenerating functional thymic tissue in vitro and in vivo.

Keywords: Cell fate regulation; Differentiation; Lineage divergence; Notch signaling; Progenitor cell; Stem cell; Thymic epithelial cell; Thymus.


Conflict of interest statement

Competing interestsThe authors declare no competing or financial interests.

Figures

Fig. 1.
Fig. 1.
Expression of Notch pathway components in thymus organogenesis. (A) Plots show RT-qPCR analysis of Notch receptor, ligand and target expression from E10.5 to E14.5 in cell populations of the phenotypes shown. (B) Representative flow cytometry plots of Notch1 expression in E13.5 TECs, split by expression of UEA1. (C) Single images of JAG1, Notch2 and Notch3, and co-staining with the mTEC marker UEA1 and epithelial marker K8 on sections of E14.5 thymus primordium. Scale bars: 50 μm. (D) Left: representative profile of E14.5 CBF1:H2B-Venus thymi, gated on EPCAM+ epithelial cells. Cell suspension was stained with the mTEC marker UEA1 and the cTEC/progenitor (‘cTEC’) marker CD205. Middle: proportion of ‘cTECs’ and mTECs showing the expression of Venus. Right: quantitation of the percentage of Venus expression in E14.5 ‘cTEC’ and mTEC populations. (A) n=3 (all genes at E10.5 and E14.5, Notch 3, Jag1, Heyl, Dll4 at E12.5 and E13.5) or 6 (Notch 1, Notch 2, Hes1 and Foxn1 at E12.5 and E13.5). In each case, n represents RNA obtained from pooled cells of the phenotype stated from an independent litter of embryos. All data points are shown. (B) Plots shown are representative of n=3. Each ‘n’ represents cells obtained from pooled thymi from an individual wild-type litter. (C) n=3 independent immunohistochemistry analyses. (D) n=4. Each ‘n’ is an independent E14.5 embryo from the same CBF1:Venus×C57BL6 litter; genotypes were retrospectively confirmed. P value in B was calculated using an unpaired two-tailed t-test.
Fig. 2.
Fig. 2.
Loss of Rbpj leads to a proportional and numerical reduction of mTECs in postnatal thymus. (A) Left: representative plots of TEC subset distribution in 2-week-old males. Right: proportion of mTECs among total TECs in 2-week-old males and females. (B) Absolute cell count of total TEC and subpopulations in 2-week-old males (left) and females (right). (C-E) TEC subset distribution in 8- (C,E) and 16- (D,E) week-old males: 78.97±1.56 wild-type 8-week-old mTECs; 78.27±4.98 Rbpj cKO 8-week-old mTECs. (F) Left and middle: absolute numbers of thymocyte subsets in 2-week-old females. Right: absolute numbers of CD25FOXP3, CD25+FOXP3 and CD25+FOXP3+ Tregs in 2-week-old males. Tregs were pre-gated as CD4+TCRβhiCCR6. (A,B,F) n=3 cKO and 3 littermate control mice for male and female. (C-E) 8 weeks, n=3 cKO and 3 littermate control male mice; 16 weeks n=3 cKO and 3 littermate control male mice from 3 independent litters; results were confirmed in females (not shown). P values in pairwise comparisons were calculated using a two-tailed t-test.
Fig. 3.
Fig. 3.
Notch is required prior to NF-κB signaling in early mTEC development. (A) Representative transverse sections of embryos of the genotype indicated showing the thymus primordium stained with the mTEC markers K14 and UEA1. DAPI reveals nuclei. (A′) Proportion of pixels in the thymic section (within the outline of DAPI) that stained positive for UEA1. Left plot shows data from each quantified section, grouped by embryo; right plot shows per embryo means from the left plot. (B,B′) E15.5 thymi of the genotypes shown were microdissected and cultured as FTOC for 3 days in dGUO and in the presence of absence of RANKL. (B) Representative plots showing cTEC/mTEC subset distribution after culture. The condition and genotype are as shown. (B′) Quantitation of the percentage of mTECs and the percentage of MHCII+ cells in mTEC and cTEC populations. (A,A′) UEA1 images are representative of data collected from 3 cKO and 3 littermate control embryos from 3 separate litters. K14 images are representative of data collected from 4 cKO and 4 control embryos from 4 separate litters. Embryos were snap frozen in OCT. cKO and control embryos were selected for analysis following genotyping. (A′) Left plot: each data point represents a section; right plot, each mean value represents the reconstruction of all thymus-containing sections of an embryo. (B) E15.5 thymi from three litters from a Foxn1Cre;RbpjFL/+×RbpjFL/FL cross were cultured with or without RANKL. Litters were obtained and cultured on different days. Genotypes for each embryo were determined retrospectively. No samples were excluded from the analysis and graphs show all datapoints obtained. For each condition, each n represents the thymic lobes from a single embryo; dGuo control, n=6; dGuo cKO, n=5; RANKL control, n=5; RANKL cKO, n=4. (A′) P values in pairwise comparisons were calculated with a two-tailed t-test. (B′) P values were calculated using a one-way ANOVA test (two tailed).
Fig. 4.
Fig. 4.
Notch signaling is an essential mediator of mTEC specification. (A-C) Representative images of thymi showing (A) the overlap between GFP (recombined cells) and K8 (TECs), and (B,C) staining for mTEC progenitor marker claudin 3 (CLDN3; B), the mTEC marker K14 (C) and epithelial marker K8. Age and genotype are as shown. Scale bars: 50 μm. (D) Quantification of CLDN3+ TECs in E14.5 control and dnMAML thymi. Some weakly stained CLDN3+ cells colocalized with the endothelial marker CD31 (white arrowhead in B; see also Fig. S7A); hence, for quantification, only CLDN3+K8+ double-positive cells were counted. (E) Representative images of E16.5 thymi stained for DAPI, UEA1, K14 and AIRE. Scale bars: 50 μm. (F,G) Quantification of AIRE+ mTECs as assessed by an unbiased automated counting protocol (F) and of K14+ staining (area of marker over the positive threshold/area of thymus defined by DAPI staining) (G) in E16.5 control and dnMAML thymi. Foxa2T2iCre;Rosa26loxp-STOP-loxp-dnMAML-IRES-eGFP and Foxa2T2iCre;Gt(ROSA)26Sortm1(EYFP)Cos (control) embryos were collected at E14.5 and E16.5. Samples analyzed were littermates. (D,F,G) Each data point represents a section. Mean values from all sections analyzed from the same embryo were used for statistics. E14.5, n=3; E16.5, n=4 embryos. P values were calculated with a two-tailed unpaired t-test.
Fig. 5.
Fig. 5.
Outcome of enforced Notch signaling in TEC. (A) (Left and middle) Representative plots showing E14.5 EpCAM+ TEC stained with markers of early progenitor TECs (PLET1), TEC differentiation [MHC class II (MHCII)], mTEC (UEA1) and cTEC (CD205). (Right) Proportions of PLET1+MHCII, PLET1+MHCII+, PLET1MHCII and PLET1MHCII+ TEC in 3 independent E14.5 control and NICD thymi, revealing over-representation of undifferentiated PLET1+ TEC and under-representation of differentiated MHCII+ TECs in NICD thymi. (B) E16.5 control and NICD thymi stained with the markers shown. Uniform K5+ K8+ epithelium (left) and expansion of K14 staining into CD205+ regions (middle) in NICD compared with clearly demarcated K14+ and CD205+ zones in controls (right). Both control and NICD thymi express AIRE in UEA1+ areas. PLET1 expression is broader in NICD than in controls. Scale bars: 50 μm. (C) Representative plots showing TEC subset distribution in E16.5 thymi after staining for the markers shown. Data after gating on EPCAM+ cells (left) and after gating on CD205+ cTECs/common TEPCs (right). Foxn1Cre;R26LSL-NICD-EGFP and C57BL/6 control embryos were collected at E14.5 and E16.5. Samples analyzed were from the same litter. E14.5 NICD, n=4; E14.5 control, n=3; E16.5 NICD, n=3; E16.5 control, n=3. (B) Images are representative of analysis of thymi from two E16.5 NICD and two control embryos.
Fig. 6.
Fig. 6.
Transcriptome analysis of Notch loss- and gain-of-function mutants. (A) Pathway analysis of the E14.5 NICD and E14.5 controls identified three signaling pathways as enriched (FDR≤0.25) in E14.5 NICD versus E14.5 control thymi (top). GSEA enrichment plot for the Notch signaling pathway (bottom left). Leading edge subset genes contributing to the enrichment for Notch signaling pathway (bottom right). (B) PCA of Rbpj cKO, wild-type and NICD TECs at the ages shown (500 most variable genes). Group 1, E14.5 NICD samples; group 2, E14.5 PLET1+ and PLET1 Rbpj cKO and controls; and group 3, E12.5 Rbpj cKO and controls. (C) Heatmap of lineage-specific genes among all groups of samples shown in the PCA above. Colors at the top and bottom of the heatmap indicate clustering of samples per group, while side colors indicate groups of genes regulated similarly across all conditions. Groups: E12.5 wild type, brown; E12.5 Rbpj cKO, orange; E14.5 wild-type PLET1+, dark blue; E14.5 wild-type PLET1, light gray; E14.5 Rbpj cKO PLET1+, light blue; E14.5 Rbpj cKO PLET1, dark gray; W, wild type; L, loss of function (Rbpj cKO); G, gain of function (NICD). (D) RT-qPCR analysis of sorted cTECs and mTECs from E17.5 wild-type and iFoxn1 thymi for the genes shown. Data are mean±s.d. (E) Genomic locus of Rbpj showing Foxn1 peaks identified by Zuklys et al. (2016). (A-C) To obtain the E12.5 and E14.5 cKO and wild-type samples, thymi were microdissected from E12.5 and E14.5 embryos generated from a Foxn1Cre;RbpjFL/+×RbpjFL/FL cross and TECs were obtained by flow cytometric cell sorting. Following genotyping, cells from three cKO and three control samples were processed for sequencing. The E12.5 and E14.5 samples were each obtained from two separate litters, on two separate days for each timepoint. To obtain the E14.5 NICD samples, thymi were microdissected from five E14.5 Foxn1Cre; R26LSL-NICD-EGFP embryos of the same litter, TECs were obtained by flow cytometric cell sorting and the samples processed for sequencing. (D) n=3, where each n represents TECs sorted from pooled embryos from a single litter of E17.5 iFoxn1 or wild-type embryos.
Fig. 7.
Fig. 7.
Model for Notch signaling regulation of early TEC development. Schematic diagrams presenting the model of early TEC development supported by the findings presented herein. (A) Notch signalling has an essential role in the differentiation of early fetal TECs: its loss of function results in mTEC hypoplasia, while its gain of function leads to TEPC maturation arrest. Notch activity precedes crosstalk-dependent further expansion and maturation of mTECs. (B) The Notch pathway in the context of a broader regulatory network. In early TEC differentiation, Notch influences and may be influenced by FOXN1, whereas it is suppressed by HDAC3 in postnatal mTECs.

Similar articles

Cited by

References

    1. Abramson J. and Anderson G. (2017). Thymic epithelial cells. Annu. Rev. Immunol. 35, 85-118. 10.1146/annurev-immunol-051116-052320 - DOI - PubMed
    1. Akiyama T., Maeda S., Yamane S., Ogino K., Kasai M., Kajiura F., Matsumoto M. and Inoue J.-I. (2005). Dependence of self-tolerance on TRAF6-directed development of thymic stroma. Science 308, 248-251. 10.1126/science.1105677 - DOI - PubMed
    1. Akiyama N., Takizawa N., Miyauchi M., Yanai H., Tateishi R., Shinzawa M., Yoshinaga R., Kurihara M., Demizu Y., Yasuda H. et al. (2016). Identification of embryonic precursor cells that differentiate into thymic epithelial cells expressing autoimmune regulator. J. Exp. Med. 213, 1441-1458. 10.1084/jem.20151780 - DOI - PMC - PubMed
    1. Alves N. L., Takahama Y., Ohigashi I., Ribeiro A. R., Baik S., Anderson G. and Jenkinson W. E. (2014). Serial progression of cortical and medullary thymic epithelial microenvironments. Eur. J. Immunol. 44, 16-22. 10.1002/eji.201344110 - DOI - PMC - PubMed
    1. Anderson M. S. and Su M. A. (2016). AIRE expands: new roles in immune tolerance and beyond. Nat. Rev. Immunol. 16, 247-258. 10.1038/nri.2016.9 - DOI - PMC - PubMed

Publication types

MeSH terms

Substances