

Inflammation-Induced Abnormal Expression of Self-molecules on Epithelial Cells: Targets for Tumor Immunoprevention
- PMID: 32467324
- PMCID: PMC7415557
- DOI: 10.1158/2326-6066.CIR-19-0870
Inflammation-Induced Abnormal Expression of Self-molecules on Epithelial Cells: Targets for Tumor Immunoprevention
Abstract
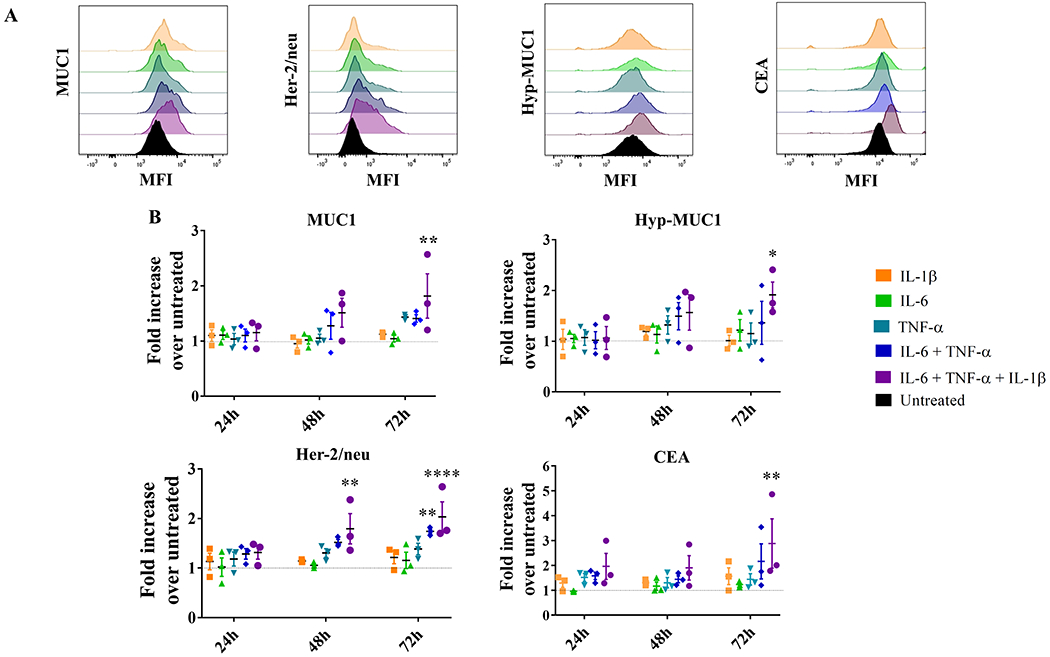
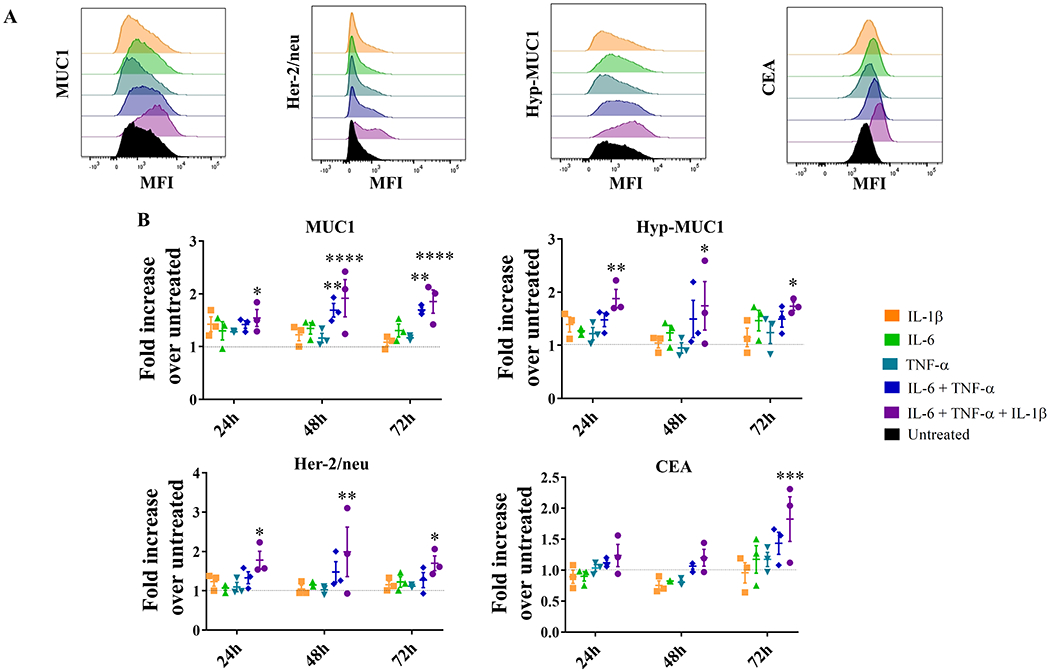
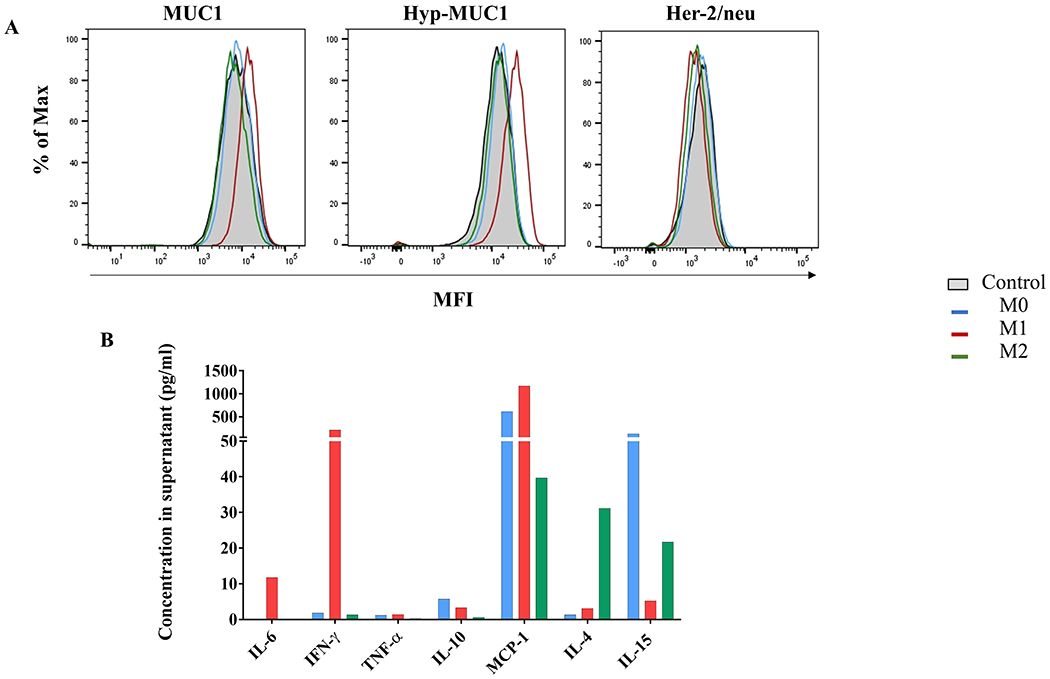
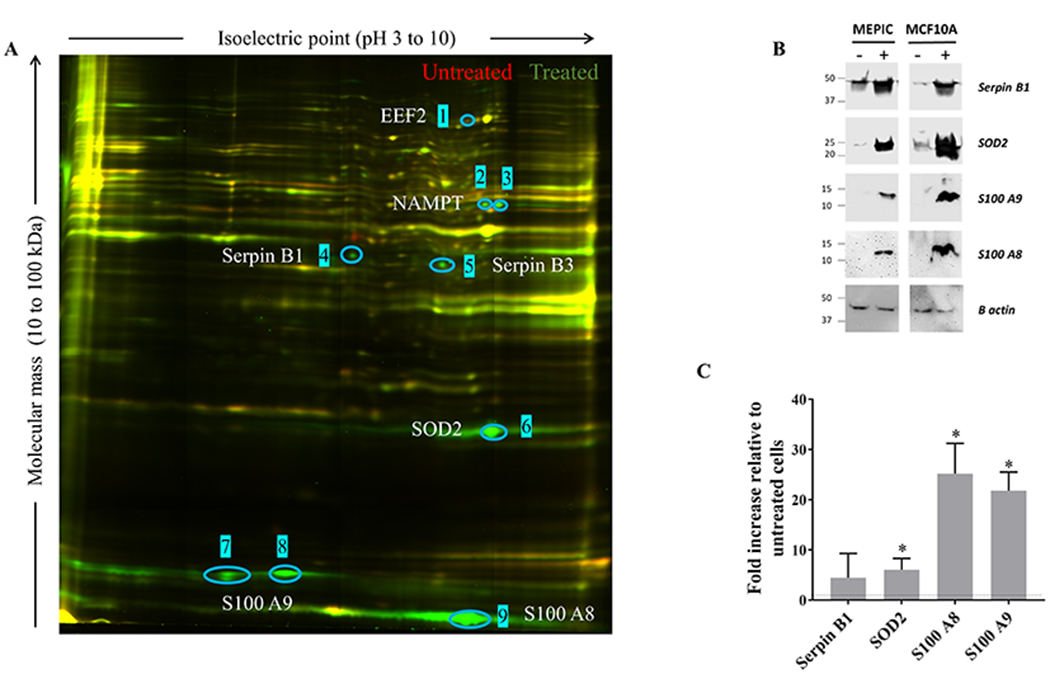
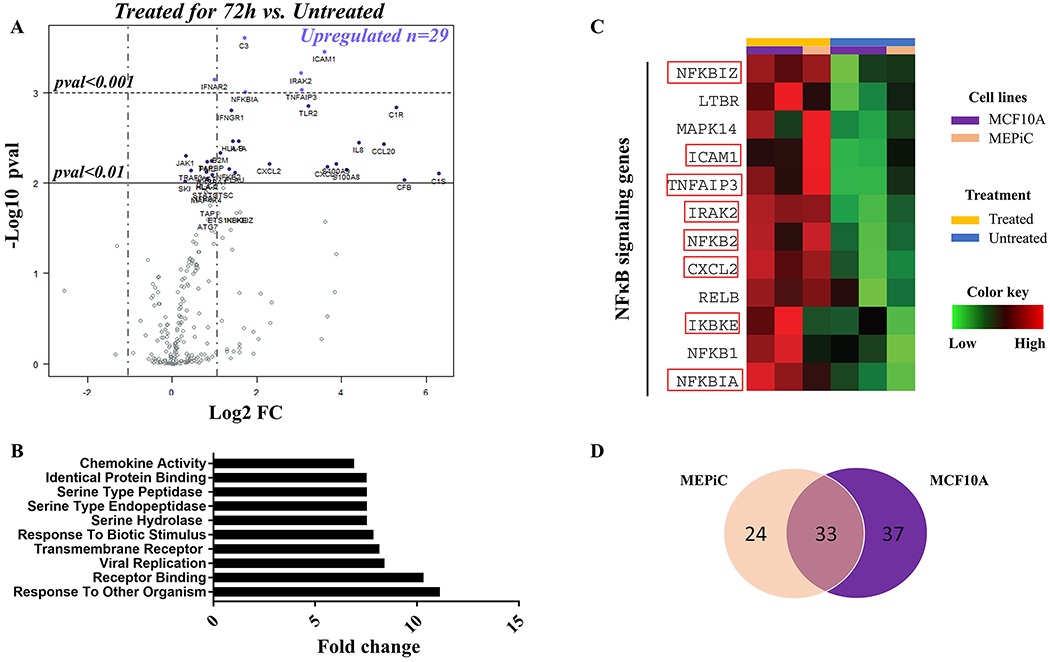
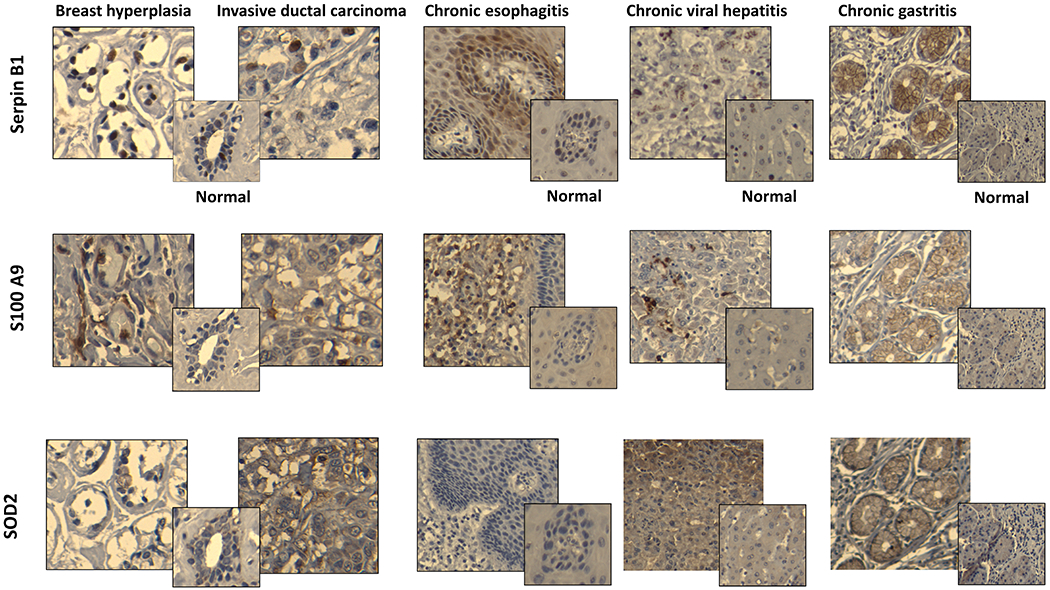
Tumor-associated antigens (TAA) are self-molecules abnormally expressed on tumor cells, which elicit humoral and cellular immunity and are targets of immunosurveillance. Immunity to TAAs is found in some healthy individuals with no history of cancer and correlates positively with a history of acute inflammatory and infectious events and cancer risk reduction. This suggests a potential role in cancer immunosurveillance for the immune memory elicited against disease-associated antigens (DAA) expressed on infected and inflamed tissues that are later recognized on tumors as TAAs. To understand probable sources for DAA generation, we investigated in vitro the role of inflammation that accompanies both infection and carcinogenesis. After exposure of normal primary breast epithelial cells to proinflammatory cytokines IL1β, IL6, and TNFα, or macrophages producing these cytokines, we saw transient overexpression of well-known TAAs, carcinoembryonic antigen and Her-2/neu, and overexpression and hypoglycosylation of MUC1. We documented inflammation-induced changes in the global cellular proteome by 2D difference gel electrophoresis combined with mass spectrometry and identified seven new DAAs. Through gene profiling, we showed that the cytokine treatment activated NF-κB and transcription of the identified DAAs. We tested three in vitro-identified DAAs, Serpin B1, S100A9, and SOD2, and found them overexpressed in premalignant and malignant breast tissues as well as in inflammatory conditions of the colon, stomach, and liver. This new category of TAAs, which are also DAAs, represent a potentially large number of predictable, shared, immunogenic, and safe antigens to use in preventative cancer vaccines and as targets for cancer therapies.
©2020 American Association for Cancer Research.
Conflict of interest statement
Conflict of interest statement :
O.J.F. is on the External Advisory Boards of GeoVax, Biovelocita and Immodulon.
Figures
Similar articles
-
Preventing cancer by targeting abnormally expressed self-antigens: MUC1 vaccines for prevention of epithelial adenocarcinomas.Ann N Y Acad Sci. 2013 May;1284:52-6. doi: 10.1111/nyas.12108. Ann N Y Acad Sci. 2013. PMID: 23651193
-
Influenza virus infection elicits protective antibodies and T cells specific for host cell antigens also expressed as tumor-associated antigens: a new view of cancer immunosurveillance.Cancer Immunol Res. 2014 Mar;2(3):263-73. doi: 10.1158/2326-6066.CIR-13-0125. Epub 2013 Dec 5. Cancer Immunol Res. 2014. PMID: 24778322 Free PMC article.
-
Antibodies specific for disease-associated antigens (DAA) expressed in non-malignant diseases reveal potential new tumor-associated antigens (TAA) for immunotherapy or immunoprevention.Semin Immunol. 2020 Feb;47:101394. doi: 10.1016/j.smim.2020.101394. Epub 2020 Apr 6. Semin Immunol. 2020. PMID: 32273212 Free PMC article. Review.
-
The present status and future prospects of peptide-based cancer vaccines.Int Immunol. 2016 Jul;28(7):319-28. doi: 10.1093/intimm/dxw027. Epub 2016 May 28. Int Immunol. 2016. PMID: 27235694 Review.
-
Structures suggest an approach for converting weak self-peptide tumor antigens into superagonists for CD8 T cells in cancer.Proc Natl Acad Sci U S A. 2021 Jun 8;118(23):e2100588118. doi: 10.1073/pnas.2100588118. Proc Natl Acad Sci U S A. 2021. PMID: 34074778 Free PMC article.
Cited by
-
Randomized, Double-Blind, Placebo-Controlled Trial of MUC1 Peptide Vaccine for Prevention of Recurrent Colorectal Adenoma.Clin Cancer Res. 2023 May 1;29(9):1678-1688. doi: 10.1158/1078-0432.CCR-22-3168. Clin Cancer Res. 2023. PMID: 36892581 Free PMC article. Clinical Trial.
-
LCVM infection generates tumor antigen-specific immunity and inhibits growth of nonviral tumors.Oncoimmunology. 2022 Jan 21;11(1):2029083. doi: 10.1080/2162402X.2022.2029083. eCollection 2022. Oncoimmunology. 2022. PMID: 35083098 Free PMC article.
-
SOD2 expression in patients with triple-negative breast cancer is associated with tumor-infiltrating lymphocytes and prognosis.Breast Cancer Res Treat. 2025 Aug;213(1):181-192. doi: 10.1007/s10549-025-07775-7. Epub 2025 Jul 9. Breast Cancer Res Treat. 2025. PMID: 40634732
-
A novel rat model of vertebral inflammation-induced intervertebral disc degeneration mediated by activating cGAS/STING molecular pathway.J Cell Mol Med. 2021 Oct;25(20):9567-9585. doi: 10.1111/jcmm.16898. Epub 2021 Sep 3. J Cell Mol Med. 2021. PMID: 34477314 Free PMC article.
-
2-dodecyl-6-methoxycyclohexa-2,5-diene-1,4-dione mediates the effect of ROS-enhanced PI3K/Akt/mTOR pathway on autophagy in breast cancer.FEBS Open Bio. 2025 Mar;15(3):474-489. doi: 10.1002/2211-5463.13940. Epub 2024 Dec 9. FEBS Open Bio. 2025. PMID: 39648951 Free PMC article.
References
-
- Hanahan D, Weinberg RA. Review Hallmarks of Cancer : The Next Generation Cell. Elsevier Inc; 2011;144:646–74. - PubMed
-
- Kawakami Y, Wang X, Shofuda T, Sumimoto H, Tupesis JP, Fitzgerald E, et al.. Isolation of a New Melanoma Antigen, MART-2, Containing a Mutated Epitope Recognized by Autologous Tumor-Infiltrating T Lymphocytes J Immunol. American Association of Immunologists; 2001;166:2871–7. - PubMed
Publication types
MeSH terms
Substances
Grants and funding
LinkOut - more resources
Full Text Sources
Medical
Research Materials
Miscellaneous
