. 2020 Jun;19(6):e13135.
doi: 10.1111/acel.13135. Epub 2020 May 28.

Older adults with sarcopenia have distinct skeletal muscle phosphodiester, phosphocreatine, and phospholipid profiles

Affiliations

Older adults with sarcopenia have distinct skeletal muscle phosphodiester, phosphocreatine, and phospholipid profiles

James Matthew Hinkley et al. Aging Cell. 2020 Jun.

Abstract

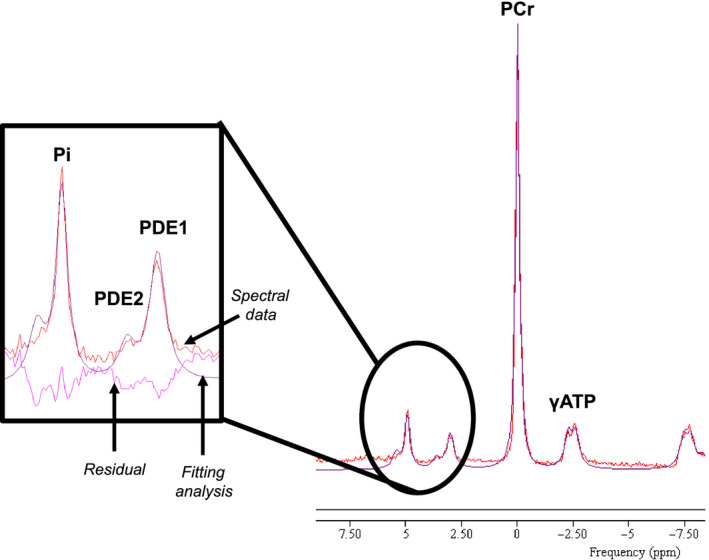
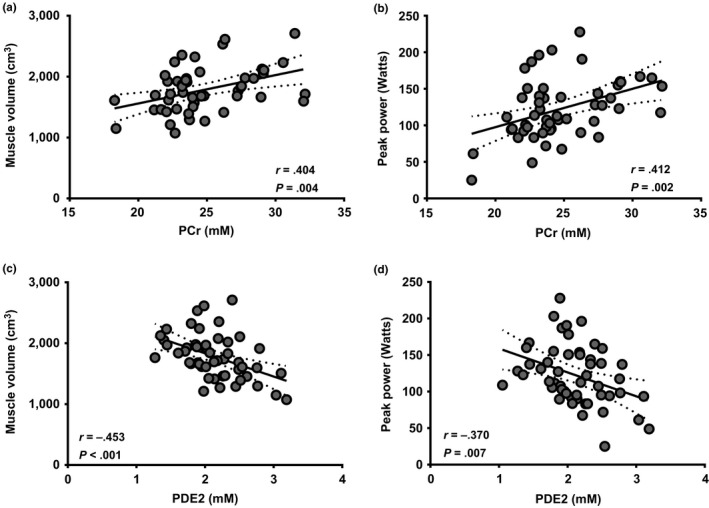
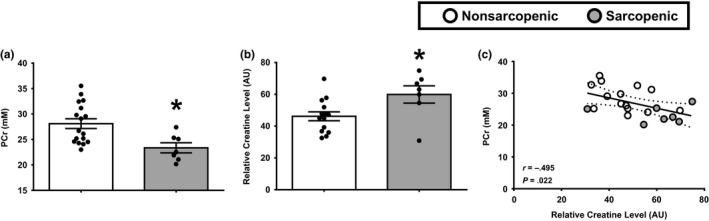
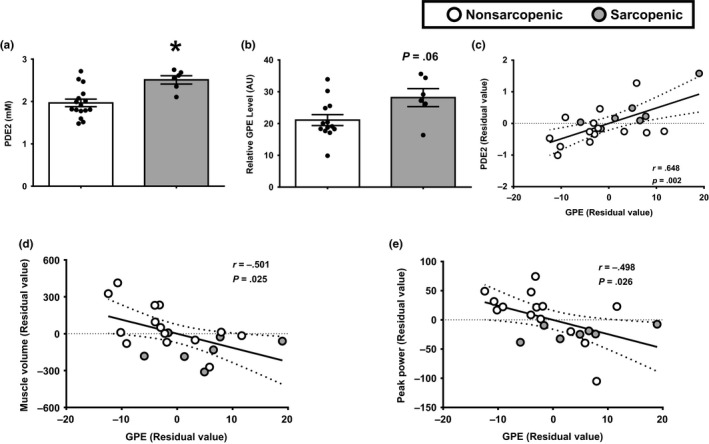
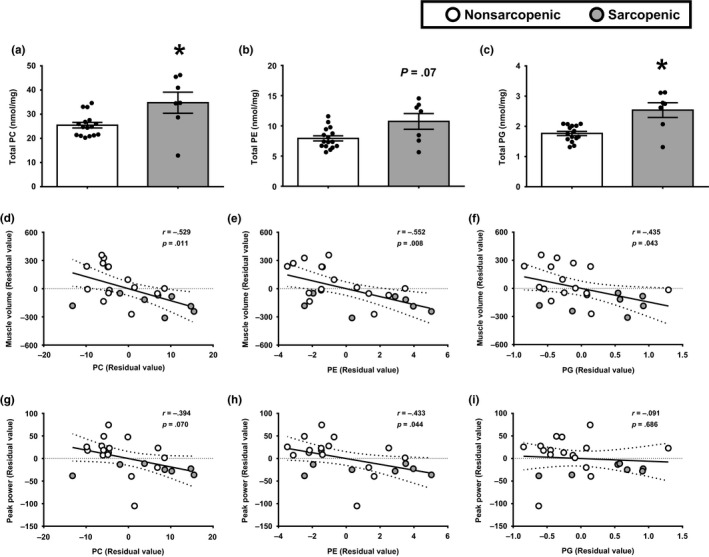
The loss of skeletal muscle mass and function with age (sarcopenia) is a critical healthcare challenge for older adults. 31-phosphorus magnetic resonance spectroscopy (31 P-MRS) is a powerful tool used to evaluate phosphorus metabolite levels in muscle. Here, we sought to determine which phosphorus metabolites were linked with reduced muscle mass and function in older adults. This investigation was conducted across two separate studies. Resting phosphorus metabolites in skeletal muscle were examined by 31 P-MRS. In the first study, fifty-five older adults with obesity were enrolled and we found that resting phosphocreatine (PCr) was positively associated with muscle volume and knee extensor peak power, while a phosphodiester peak (PDE2) was negatively related to these variables. In the second study, we examined well-phenotyped older adults that were classified as nonsarcopenic or sarcopenic based on sex-specific criteria described by the European Working Group on Sarcopenia in Older People. PCr content was lower in muscle from older adults with sarcopenia compared to controls, while PDE2 was elevated. Percutaneous biopsy specimens of the vastus lateralis were obtained for metabolomic and lipidomic analyses. Lower PCr was related to higher muscle creatine. PDE2 was associated with glycerol-phosphoethanolamine levels, a putative marker of phospholipid membrane damage. Lipidomic analyses revealed that the major phospholipids, (phosphatidylcholine, phosphatidylethanolamine, and phosphatidylglycerol) were elevated in sarcopenic muscle and were inversely related to muscle volume and peak power. These data suggest phosphorus metabolites and phospholipids are associated with the loss of skeletal muscle mass and function in older adults.

Keywords: aging; muscle volume; peak power; phosphatidylcholine; phosphatidylethanolamine; phosphodiester.


Conflict of interest statement

P.M. Coen is a consultant for Astellas/Mitobridge, Incorporated.

Figures

FIGURE 1
FIGURE 1
Representative 31P‐MRS spectra from thigh muscle of older adult participant. Trace was taken from older participant without sarcopenia (Study 2). The spectral data are shown in red, the smooth line overlaying the raw data (purple line) is the result of the fitting analysis, and the residual (pink line) is shown as the difference between the raw data and the fit. Inset: peaks that identify inorganic phosphate (Pi), and 2 phosphodiester (PDE) peaks (PDE1 and PDE2). Additionally, lines for spectral data, fitting analysis, and residual are highlighted
FIGURE 2
FIGURE 2
PCr and PDE2 are associated with whole‐muscle mass and function in a homogeneous group of older obese adults. 31P‐MRS was used to quantify in vivo PCr and PDE2 levels in older obese adults. Pearson correlations were then examined associations concentrations (in mM) of PCr (a–b) and PDE2 (c–d) with (a and c) muscle volume (cm3), and (b and d) peak power (Watts). N = 55. Best‐fit trend line (solid line) and 95% confidence intervals (dotted line) are included
FIGURE 3
FIGURE 3
Lower in vivo phosphocreatine levels are associated with elevated creatine levels in sarcopenic skeletal muscle. (a) 31P‐MRS was used to quantify in vivo phosphocreatine (PCr) metabolites in the thigh muscle of older nonsarcopenic (white bars) and sarcopenic (gray bars) adults. (b) Quantitative analysis of skeletal muscle creatine levels was examined in muscle biospecimens from older nonsarcopenic and sarcopenic adults. *p ≤ .05 vs. nonsarcopenic. N = 7–16 participants per group. (c) Pearson correlations were first used to determine the relationship between in vivo concentrations of phosphocreatine (PCr, mM) and biochemical analysis of creatine levels. N = 21 participants total. White circles, nonsarcopenic adults; gray circle, sarcopenic adults. Best‐fit trend line (solid line) and 95% confidence intervals (dotted line) are included
FIGURE 4
FIGURE 4
Increases in the metabolic constituent of PDE2, GPE, are related to lower muscle mass and function. (a) 31P‐MRS was used to quantify in vivo phosphocreatine (PCr) metabolites in the thigh muscle of older nonsarcopenic (white bars) and sarcopenic (gray bars) adults. (b) Quantitative analysis of skeletal muscle GPE levels was examined in muscle biospecimens from older nonsarcopenic and sarcopenic adults. *p ≤ .05 vs. nonsarcopenic. N = 7–16 participants per group. Pearson correlations were first used to determine the relationship between in vivo concentrations of PDE2 and GPE (c), as well as the relationship between skeletal muscle concentrations of GPE and (d) muscle volume and (e) peak power. N = 21 participants total. Data are presented as residual values, which were derived from a regression model taking gender into account. White circles, nonsarcopenic adults; gray circle, sarcopenic adults. Best‐fit trend line (solid line) and 95% confidence intervals (dotted line) are included
FIGURE 5
FIGURE 5
Elevated skeletal muscle phospholipids in sarcopenic muscle are associated with whole‐muscle mass and function in older adults with and without sarcopenia. Total content of phosphatidylcholine (PC) (a), phosphatidylethanolamine (PE) (b), and phosphatidylglycerol (PG) (c) were examined in skeletal muscle biopsy samples from nonsarcopenic (white bars) and sarcopenic (gray bars) participants. *p ≤ .05 vs. nonsarcopenic. N = 7–16 participants per group. Pearson correlations were used to examine associations with the total levels of PC (d and g), PE (e and h), and PG (f and i) with muscle volume (d–f), and peak power (g–i). N = 23. Data are presented as residual values, which were derived from a regression model taking gender into account. White circles, nonsarcopenic adults; gray circle, sarcopenic adults. Best‐fit trend line (solid line) and 95% confidence intervals (dotted line) are included

Comment in

  • Muscle phosphorus metabolites in sarcopenia.
    Hinkley JM, Coen PM. Hinkley JM, et al. Aging (Albany NY). 2020 Aug 28;12(16):15880-15881. doi: 10.18632/aging.104032. Epub 2020 Aug 28. Aging (Albany NY). 2020. PMID: 32860671 Free PMC article. No abstract available.

References

    1. Aliev, M. , Guzun, R. , Karu‐Varikmaa, M. , Kaambre, T. , Wallimann, T. , & Saks, V. (2011). Molecular system bioenergics of the heart: Experimental studies of metabolic compartmentation and energy fluxes versus computer modeling. International Journal of Molecular Sciences, 12, 9296–9331. - PMC - PubMed
    1. Baburina, I. , & Jackowski, S. (1999). Cellular responses to excess phospholipid. Journal of Biological Chemistry, 274, 9400–9408. - PubMed
    1. Burt, C. T. (1985). Phosphodiesters and NMR: A tale of rabbits and chickens. Trends in Biochemical Sciences, 10, 404–406.
    1. Clark, R. V. , Walker, A. C. , O’Connor‐Semmes, R. L. , Leonard, M. S. , Miller, R. R. , Stimpson, S. A. , … Evans, W. J. (2014). Total body skeletal muscle mass: Estimation by creatine (methyl‐d 3) dilution in humans. Journal of Applied Physiology, 116, 1605–1613. - PMC - PubMed
    1. Conley, K. E. , Jubrias, S. A. , & Esselman, P. C. (2000). Oxidative capacity and ageing in human muscle. Journal of Physiology, 526, 203–210. 10.1111/j.1469-7793.2000.t01-1-00203.x - DOI - PMC - PubMed

Publication types

LinkOut - more resources