piNET: a versatile web platform for downstream analysis and visualization of proteomics data
- PMID: 32469073
- PMCID: PMC7319557
- DOI: 10.1093/nar/gkaa436
piNET: a versatile web platform for downstream analysis and visualization of proteomics data
Abstract
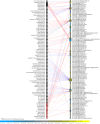
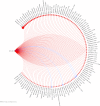
Rapid progress in proteomics and large-scale profiling of biological systems at the protein level necessitates the continued development of efficient computational tools for the analysis and interpretation of proteomics data. Here, we present the piNET server that facilitates integrated annotation, analysis and visualization of quantitative proteomics data, with emphasis on PTM networks and integration with the LINCS library of chemical and genetic perturbation signatures in order to provide further mechanistic and functional insights. The primary input for the server consists of a set of peptides or proteins, optionally with PTM sites, and their corresponding abundance values. Several interconnected workflows can be used to generate: (i) interactive graphs and tables providing comprehensive annotation and mapping between peptides and proteins with PTM sites; (ii) high resolution and interactive visualization for enzyme-substrate networks, including kinases and their phospho-peptide targets; (iii) mapping and visualization of LINCS signature connectivity for chemical inhibitors or genetic knockdown of enzymes upstream of their target PTM sites. piNET has been built using a modular Spring-Boot JAVA platform as a fast, versatile and easy to use tool. The Apache Lucene indexing is used for fast mapping of peptides into UniProt entries for the human, mouse and other commonly used model organism proteomes. PTM-centric network analyses combine PhosphoSitePlus, iPTMnet and SIGNOR databases of validated enzyme-substrate relationships, for kinase networks augmented by DeepPhos predictions and sequence-based mapping of PhosphoSitePlus consensus motifs. Concordant LINCS signatures are mapped using iLINCS. For each workflow, a RESTful API counterpart can be used to generate the results programmatically in the json format. The server is available at http://pinet-server.org, and it is free and open to all users without login requirement.
© The Author(s) 2020. Published by Oxford University Press on behalf of Nucleic Acids Research.
Figures


References
-
- Gillet L.C., Leitner A., Aebersold R.. Mass spectrometry applied to bottom-up proteomics: entering the high-throughput era for hypothesis testing. Annu. Rev. Analyt. Chem. 2016; 9:449–472. - PubMed
-
- Aebersold R., Mann M.. Mass-spectrometric exploration of proteome structure and function. Nature. 2016; 537:347–355. - PubMed
-
- Tyanova S., Temu T., Cox J.. The MaxQuant computational platform for mass spectrometry-based shotgun proteomics. Nat. Protoc. 2016; 11:2301–2319. - PubMed
-
- Bilbao A., Varesio E., Luban J., Strambio-De-Castillia C., Hopfgartner G., Müller M., Lisacek F.. Processing strategies and software solutions for data-independent acquisition in mass spectrometry. Proteomics. 2015; 15:964–980. - PubMed
Publication types
MeSH terms
Substances
Grants and funding
LinkOut - more resources
Full Text Sources

