Changes in Opioid Prescribing Patterns Among Generalists and Oncologists for Medicare Part D Beneficiaries From 2013 to 2017
- PMID: 32469405
- PMCID: PMC7260690
- DOI: 10.1001/jamaoncol.2020.2211
Changes in Opioid Prescribing Patterns Among Generalists and Oncologists for Medicare Part D Beneficiaries From 2013 to 2017
Abstract
Importance: In response to the opioid epidemic, policies aiming to reduce opioid prescribing, misuse, and abuse may have the unintended consequence of restricting access to necessary opioid therapy for cancer-related pain. It is unknown how opioid prescribing patterns have changed among generalists and oncologists during this era.
Objective: To examine trends in opioid prescription rates for Medicare Part D beneficiaries from 2013 to 2017 among oncologists and generalists.
Design, setting, and participants: This repeated cross-sectional study of generalist physicians (internal medicine, family medicine, geriatric medicine, general practice) and oncology specialists (medical oncology, hematology-oncology, and radiation oncology) analyzed the Medicare Provider Utilization and Payment Data: Part D prescriber files from 2013 to 2017.
Exposures: Generalist vs oncology specialty.
Main outcomes and measures: Outcomes included physician-level rates of both opioid and long-acting opioid prescriptions per 100 Medicare Part D beneficiaries. Poisson regression was used to estimate annual predicted outcome rates and incidence rate ratios, adjusting for prescriber characteristics and state fixed effects.
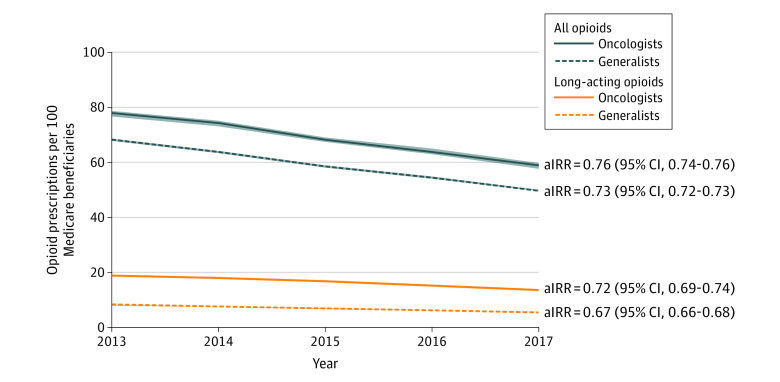
Results: We analyzed the prescribing patterns of 251 820 generalists and 14 210 oncologists. From 2013 to 2017, the annual adjusted predicted mean rate of opioid prescriptions per 100 Medicare beneficiaries decreased from 68.2 to 49.7 among generalists (adjusted incidence rate ratio [aIRR] = 0.73; 95% CI, 0.73-0.73) and from 77.8 to 58.8 among oncologists (aIRR = 0.76; 95% CI, 0.74-0.77). The rate of long-acting opioid prescriptions per 100 Medicare beneficiaries also decreased from 8.0 to 5.4 for generalists (aIRR = 0.67; 95% CI, 0.66-0.68) and from 18.6 to 13.3 for oncologists (aIRR = 0.72; 95% CI, 0.69-0.74).
Conclusions and relevance: We found large declines in opioid prescription rates for Medicare beneficiaries by generalists and oncologists from 2013 to 2017. Opioid policy and advocacy appear to have been effective in reducing the extent of opioid prescribing in the Medicare population. Similar declines between generalists and oncologists raise concern that access to cancer pain management may have been inadvertently restricted. How much of the decrease in prescribing by oncologists is appropriate vs inappropriate deserves further investigation.
Conflict of interest statement
Figures
References
MeSH terms
Substances
Grants and funding
LinkOut - more resources
Full Text Sources
Medical