. 2020 May 29;15(5):e0227932.
doi: 10.1371/journal.pone.0227932. eCollection 2020.

Use of Thrombodynamics for revealing the participation of platelet, erythrocyte, endothelial, and monocyte microparticles in coagulation activation and propagation

Affiliations

Use of Thrombodynamics for revealing the participation of platelet, erythrocyte, endothelial, and monocyte microparticles in coagulation activation and propagation

E N Lipets et al. PLoS One. .

Abstract

Background and objective: For many pathological states, microparticles are supposed to be one of the causes of hypercoagulation. Although there are some indirect data about microparticles participation in coagulation activation and propagation, the integral hemostasis test Thrombodynamics allows to measure micropaticles participation in these two coagulation phases directly. Demonstrates microparticles participation in coagulation activation by influence on the appearance of coagulation centres in the plasma volume and the rate of clot growth from the surface with immobilized tissue factor.Methods: Microparticles were obtained from platelets and erythrocytes by stimulation with thrombin receptor-activating peptide (SFLLRN) and calcium ionophore (A23187), respectively, from monocytes, endothelial HUVEC culture and monocytic THP cell culture by stimulation with lipopolysaccharides. Microparticles were counted by flow cytometry and titrated in microparticle-depleted normal plasma in the Thrombodynamics test.

Results: Monocyte microparticles induced the appearance of clotting centres through the TF pathway at concentrations approximately 100-fold lower than platelet and erythrocyte microparticles, which activated plasma by the contact pathway. For endothelial microparticles, both activation pathways were essential, and their activity was intermediate. Monocyte microparticles induced plasma clotting by the appearance of hundreds of clots with an extremely slow growth rate, while erythrocyte microparticles induced the appearance of a few clots with a growth rate similar to that from surface covered with high-density tissue factor. Patterns of clotting induced by platelet and endothelial microparticles were intermediate. Platelet, erythrocyte and endothelial microparticles impacts on the rate of clot growth from the surface with tissue factor did not differ significantly within the 0-200·103/ul range of microparticles concentrations. However, at concentrations greater than 500·103/ul, erythrocyte microparticles increased the stationary clot growth rate to significantly higher levels than do platelet microparticles or artificial phospholipid vesicles consisting of phosphatidylcholine and phosphatidylserine.

Conclusion: Microparticles of different origins demonstrated qualitatively different characteristics related to coagulation activation and propagation.


Conflict of interest statement

The authors have declared that no competing interests exist.

Figures

Fig 1
Fig 1. Design of the Thrombodynamics assay.
A. Typical images of growing fibrin clot in normal platelet-free plasma and in plasma supplemented with microparticles. Coagulation is activated by immobilized TF (on the top), and the fibrin clot grows into the bulk of the plasma. When plasma is supplemented with microparticles, spontaneous clots in the bulk of the plasma appear. The scale bar is 2 mm. B. Clot size dependence on time, definition of initial clot growth rate, Vi, and stationary clot growth rate, Vs. C. Dependence on time of the percentage of spontaneous clot area of the whole chamber area excluding walls and clot grown from activator (Tsp definition).
Fig 2
Fig 2. Analysis and counting of MPs of different cellular origins by flow cytometry on a FACS Canto II.
The noise threshold was set up in the FITC fluorescence channel (200 a.u) (B1-B5). A1, B1 –filtered HBS buffer without MPs (negative control); A2, B2 –MPs from erythrocytes; A3, B3 –MPs from platelets; A4, B4 –MPs from THP-1 cells; A5, B5 –MPs from ECs. Annexin V-FITC was added to all probes. All events above the FITC fluorescence threshold (200 a.u) were counted in the SSC/FSC window (A1-A5) in the size gate < 1 μm (gate P3). After subtracting the events in the negative control, all events in this gate were considered MPs. Gate P1 (A1-A5)–size calibration beads (1 μm), gate P2 (A1-A5)–counting beads (3 μm). Gate P4 (B1-B5) annexin V-positive events above the threshold set up in the negative control in the FITC fluorescence channel. Percentages of annexin V-positive events are presented for each type of MPs. Analysis of MPs from monocytes is not shown since they have approximately the same distribution pattern as MPs from monocytic THP-1 cells (approximately 30% of annexin V-positive events).
Fig 3
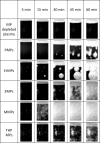
Fig 3. Photos of growing clot and typical patterns of spontaneous clotting induced by MPs of different origins.
As MPs of different origins induce spontaneous clotting at 100-fold different concentrations, the photos represented at arbitrary concentrations at which the patterns of clotting centre appearance were well distinguished within 60 min. The MPs concentrations in assays in photos were as follows: PMPs, 627·103 1/μl; ErMPs, 500·103 1/μl; EMPs, 480·103 1/μl; THP MPs, 132·103 1/μl; and MMPs, 132·103 1/μl.
Fig 4
Fig 4. Activation pathway from MPs.
Photos at 60 min of plasma supplemented with MPs of different origins in the Thrombodynamics test without any inhibitors, with 100 nM VIIai (TF pathway inhibitor), with 200 μg/ml CTI (contact pathway inhibitor) or both inhibitors. MPs were supplemented at arbitrary concentrations, which induced the appearance of clotting centres within 10–20 min in samples without inhibitors. That was optimal for checking inhibitor effects. B. Mean ± sd of Tsp in plasma supplemented with MPs without inhibitors and with one or both inhibitors. Three repeats were carried out for PMPs and THP MPs and two repeats for ErMPs, EMPs and MMPs. PMPs–platelet microparticles, ErMPs–erythrocyte microparticles, EMPs–endothelial microparticles, MMPs–monocyte microparticles, THP MPs–microparticles from monocyte culture.
Fig 5
Fig 5. The light scattering intensity profiles of spontaneous clots induced by MPs of different origins.
Clotting was induced in normal MP-depleted plasma by supplementation of (A) platelet MPs, (B) erythrocyte MPs, (C), (E), (G) endothelial MPs, monocyte MPs, THP MPs respectively in conditionally “low” concentrations, (D), (F), (H) endothelial MPs, monocyte MPs, THP MPs respectively in conditionally “high” concentrations. The time interval between profiles is 5 min.
Fig 6
Fig 6. The maximal rate of increase of light scattering intensity in the centre of spontaneous clots and its ratio to the maximal rate of increase of light scattering intensity of clots growing from activator.
(A) The mean maximal rate of light scattering intensity increase in the centre of spontaneous clots growth. (B) Ratio of the mean maximal rates of light scattering intensity increase in the centre of spontaneous clots growth to the maximal rate of light scattering intensity increase of clots growing from activator. Dots correspond to individual clots induced by different MP samples at different concentrations. Boxes on the plot bound the 25th and the 75th percentiles. Tables under histograms contain significance levels of corresponding parameter differences between MP of different origin according to Mann–Whitney test.
Fig 7
Fig 7. The rate of coagulation front propagation from centres of spontaneous clots induced by MPs of different origin and its ratio to the clot growth rate from activator.
(A) Mean rate of coagulation front propagation from centres of spontaneous clots. (B) Mean ratio of the rate of coagulation front propagation from the centres of spontaneous clots to the clot growth rate from the activator. Dots correspond to individual clots induced by different MP samples at different concentrations. Boxes on the plot bound the 25th and the 75th percentiles. Tables under histograms contain the significance levels of corresponding parameter differences between MP of different origins according to the Mann–Whitney test.
Fig 8
Fig 8. Influence of MPs of different origin on coagulation propagation.
Mean ± sd dependence of the initial (A) and stationary (B) clot growth rates on platelet (PMPs) (n = 10), erythrocyte (ErMPs) (n = 7), endothelial (EMPs) (n = 5), THP monocyte culture (THP MPs) (n = 6) and monocyte (MMPs) (n = 5) microparticles concentrations. (C), (D) The same dependences on a smaller scale.
Fig 9
Fig 9. Influence of artificial vesicles on coagulation propagation.
Mean ± sd dependence of the initial (A) and stationary (B) clot growth rates on the concentration of artificial phospholipid vesicles (PL) containing 10% (n = 3), 15% (n = 3) and 20% (n = 2) PS.

Similar articles

Cited by

References

    1. Flaumenhaft R, Dilks JR, Richardson J, Alden E, Patel-Hett SR, Battinelli E, et al. Megakaryocyte-derived microparticles: direct visualization and distinction from platelet-derived microparticles. Blood. 2009;113: 1112–1121. 10.1182/blood-2008-06-163832 - DOI - PMC - PubMed
    1. Berckmans RJ, Nieuwland R, Boing AN, Romijn FP, Hack CE, Sturk A. Cell-derived microparticles circulate in healthy humans and support low grade thrombin generation. Thromb Haemost. 2001;85: 639–646. - PubMed
    1. Owens AP, Mackman N. Microparticles in Hemostasis and Thrombosis. Weber C, Mause S, editors. Circ Res. 2011;108: 1284–1297. 10.1161/CIRCRESAHA.110.233056 - DOI - PMC - PubMed
    1. George FD. Microparticles in vascular diseases. Thromb Res. 2008;122: S55–S59. 10.1016/S0049-3848(08)70020-3 - DOI - PubMed
    1. Mooberry MJ, Key NS. Microparticle analysis in disorders of hemostasis and thrombosis. Cytometry A. 2016;89: 111–22. 10.1002/cyto.a.22647 - DOI - PMC - PubMed

Publication types

MeSH terms