. 2020 May 29;15(5):e0223872.
doi: 10.1371/journal.pone.0223872. eCollection 2020.

Modeling Dragons: Using linked mechanistic physiological and microclimate models to explore environmental, physiological, and morphological constraints on the early evolution of dinosaurs

Affiliations

Modeling Dragons: Using linked mechanistic physiological and microclimate models to explore environmental, physiological, and morphological constraints on the early evolution of dinosaurs

David M Lovelace et al. PLoS One. .

Abstract

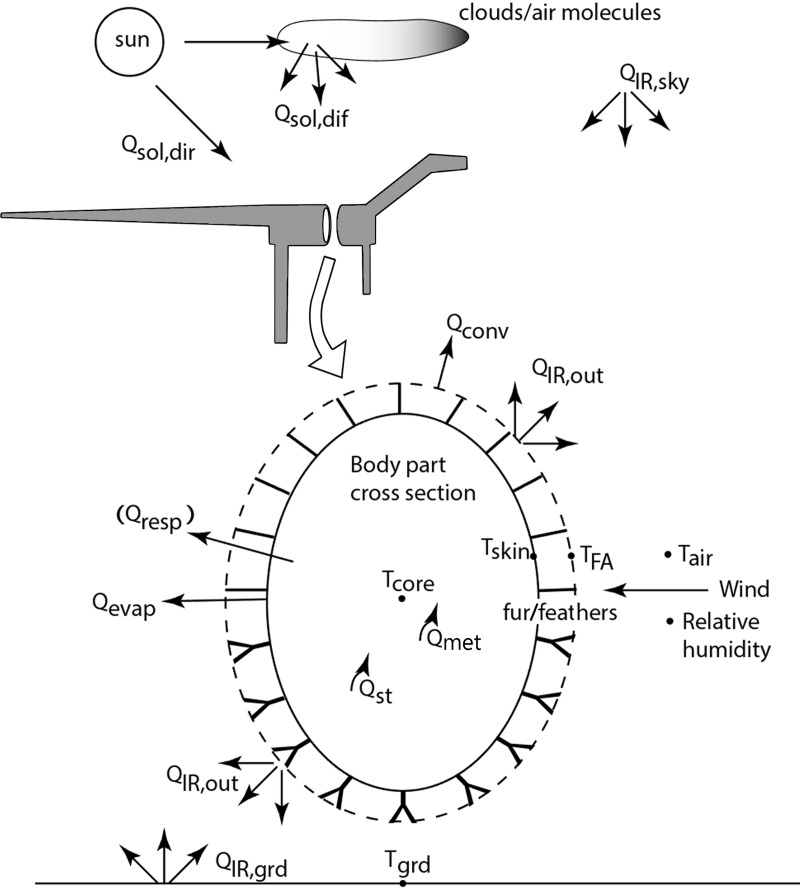
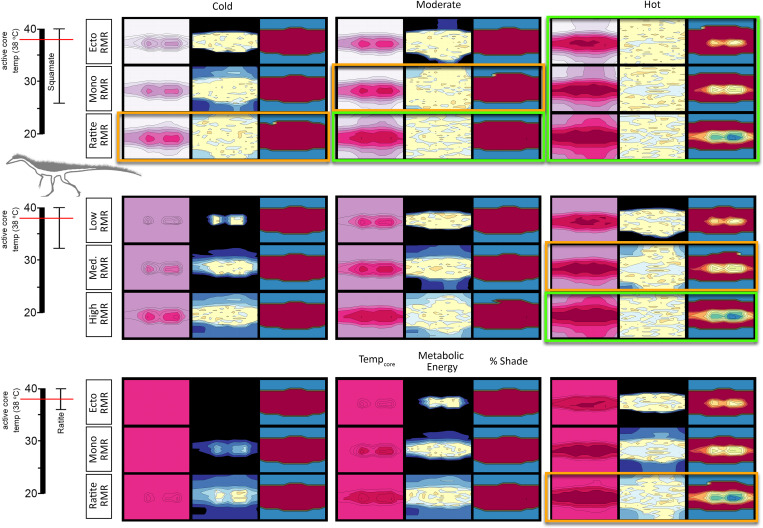
We employed the widely-tested biophysiological modeling software, Niche Mapper™ to investigate the metabolic function of the Late Triassic dinosaurs Plateosaurus and Coelophysis during global greenhouse conditions. We tested a variety of assumptions about resting metabolic rate, each evaluated within six microclimate models that bound paleoenvironmental conditions at 12° N paleolatitude, as determined by sedimentological and isotopic proxies for climate within the Chinle Formation of the southwestern United States. Sensitivity testing of metabolic variables and simulated "metabolic chamber" analyses support elevated "ratite-like" metabolic rates and intermediate "monotreme-like" core temperature ranges in these species of early saurischian dinosaur. Our results suggest small theropods may have needed partial to full epidermal insulation in temperate environments, while fully grown prosauropods would have likely been heat stressed in open, hot environments and should have been restricted to cooler microclimates such as dense forests or higher latitudes and elevations. This is in agreement with the Late Triassic fossil record and may have contributed to the latitudinal gap in the Triassic prosauropod record.


Conflict of interest statement

The authors have declared that no competing interests exist.

Figures

Fig 1
Fig 1. Organism-environment heat balance interactions.
The reptile’s heat and mass balances that influence body temperature are determined by where it chooses to be each hour to remain within its preferred body temperature range. Niche Mapper allows it to find a location each hour where it can remain active, or not, if necessary, to optimize its body temperature and/or water balance.
Fig 2
Fig 2. Heatmaps of microclimate air temperature and wind speed at average animal height for each modeled hour.
We use a turbulent velocity and temperature profile where the most significant changes occur within the first 15 cm from the ground. The microclimates are the same for both Coelophysis (shown) and Plateosaurus. (A) hot and B) cold climate regimes, C) high and D) low wind speeds.
Fig 3
Fig 3. Heat transfer pathways between modeled organism and environment.
Cross-section of a body segment (e.g., elliptical cylindrical torso of distributed heat generating flesh surrounded by an optional layer of fat (not shown), then skin surrounded by porous insulation whose properties may be the same or different dorsally vs. ventrally). The flesh is generating metabolic heat throughout the body (Qmet) and exchanging (Qresp, Qevap, QIRnet, Qconv, Qsol) heat with its environment as modeled by Niche Mapper (adapted from Porter et al. [23]). The transient model also includes a heat storage term, Qst, for the flesh. A full list of symbols and abbreviations can be found in the text.
Fig 4
Fig 4. Internal mass balance models coupled to heat transfer.
System diagram for the respiratory and digestive system driven by the metabolic rate, Qmet.
Fig 5
Fig 5. Effect of mass estimate (Coelophysis) on annual energy.
The matrix reflects the effect of size and insulation for Coelophysis in a hot and cold microclimate. Dark blue = >10% above target ME; light blue = 5–10% above target ME; green = +/- 5% of target ME; light orange = 5–10% below target ME; and dark orange = >10% below target ME.
Fig 6
Fig 6. Effect of mass estimate (Plateosaurus) on annual energy.
The matrix reflects the effect of size and insulation for Plateosaurus in a hot and cold microclimate. Dark blue = >10% above target ME; light blue = 5–10% above target ME; green = +/- 5% of target ME; light orange = 5–10% below target ME; and dark orange = >10% below target ME.
Fig 7
Fig 7. Dietary variability with diet type and insulation.
The amount of food needed to maintain the specified (target) core body temperature throughout the year varies with diet type. Diet types: low browser herbivore (dark green); high browser herbivore (light green); and carnivore (red). Climate conditions also affect the quantity of food required to maintain core temperatures in hot (closed circles) and cold (closed squares) climates; annual target food intake in kilograms for each species is denoted by a closed blue pentagon when Plateosaurus = high browser and Coelophysis = carnivore. Data represent each species with a ratite RMR and CTR.
Fig 8
Fig 8. Active thermoneutral zones of Plateosaurus and variably insulated Coelophysis.
Shaded areas represent the active thermoneutral zone determined from 18 metabolic chamber experiments for Plateosaurus and Coelophysis (fully insulated, top-only, and uninsulated) with RMR ranging from squamates to eutherians based on published regression equations [7,75,76]. Light gray = broad CTR (26–40°C); dark gray = moderate CTR (32–40°C); black = high CTR (36–40°C). Target Tcore = 38°C. The active thermoneutral zones for the top-only and fully insulated Coelophysis were calculated with the ptiloerection behavioral function enabled.
Fig 9
Fig 9. Heatmaps of Tcore, metabolic energy (ME), and % shade.
Heatmaps provide a quick quantitative tool for visualizing results on an hourly basis across the year. A) Top; example of narrow CTR heatmap where 36core<40 ~6–8 hrs per day. Bottom; 36<Tcore<38 ~0–3 hrs per day (e.g., cold stressed). B) Top; Metabolic energy (ME) heatmap displaying heat stress during mid-day hours, mid-year. Middle; ME heatmap displaying a reasonable range around 2x RMR. Bottom; results of a cold-stressed model with ME exceeding 5x RMR. C) Heatmaps demonstrating a high (top), moderate (middle), and low (bottom) daylight hours shade requirement.
Fig 10
Fig 10. Tcore, ME, and %shade heatmaps for Coelophysis (uninsulated).
Heatmaps representing the hourly results across the modeled year the three dominant variables: microclimate (hot, moderate, and cold), RMR (low, moderate, and high), CTR (broad, moderate, and narrow) for an uninsulated Coelophysis. See Fig 9 for key. Two most likely scenarios for survivability are outlined in bright green, the three edge conditions are outlined in orange; all other conditions are considered to be non-viable.
Fig 11
Fig 11. Comparison of daily temperature curves for Varanus and Coelophysis (uninsulated).
Daily temperature curves for hot and cold microclimates for the 15th of May (uninsulated Coelophysis) and November (Varanus komodoensis) [40]. There is strong agreement between the low RMR and broad CTR Coelophysis and V. komodoensis in the hot microclimate. Coelophysis modeled in the cold microclimate was significantly cold stressed. Green shaded area represents duration of day with Tcore > 30°C.
Fig 12
Fig 12. Tcore, ME, and %shade heatmaps for Coelophysis (top-only insulated).
Heatmaps representing the hourly results across the modeled year the three dominant variables: microclimate (hot, moderate, and cold), RMR (low, moderate, and high), CTR (broad, moderate, and narrow) for a top-only insulated Coelophysis. See Fig 9 for key. Five most likely scenarios for survivability are outlined in bright green, the four edge conditions are outlined in orange; all other conditions are considered to be non-viable.
Fig 13
Fig 13. Tcore, ME, and %shade heatmaps for Coelophysis (fully insulated).
Heatmaps representing the hourly results across the modeled year the three dominant variables: microclimate (hot, moderate, and cold), RMR (low, moderate, and high), CTR (broad, moderate, and narrow) for a fully insulated Coelophysis. See Fig 9 for key. Tenmost likely scenarios for survivability are outlined in bright green, the six edge conditions are outlined in orange; all other conditions are considered to be non-viable.
Fig 14
Fig 14. Tcore, ME, and %shade heatmaps for Plateosaurus.
Heatmaps representing the hourly results across the modeled year the three dominant variables: microclimate (hot, moderate, and cold), RMR (low, moderate, and high), CTR (broad, moderate, and narrow) for a Plateosaurus. See Fig 9 for key. Ten most likely scenarios for survivability are outlined in bright green, the six edge conditions are outlined in orange; all other conditions are considered to be non-viable.
Fig 15
Fig 15. Energetic cost of wind exposure for Coelophysis.
As temperature increases (blue, black, and red lines, respectively) ptiloerection was less beneficial with increased insulation volume. (e.g., fully insulated Coelophysis does not significantly benefit by implementing ptiloerection at hot temperatures but the presence of feathers broadens its active thermoneutral zone). The three light gray horizontal lines represent, from bottom to top, resting, twice resting (e.g., ME target), and three times resting metabolic rate to indicate the likely range of activity levels for the size, shape, and degree of insulation for Coelophysis.
Fig 16
Fig 16. Energetic costs of wind exposure for Plateosaurus.
Under low wind speeds Plateosaurus is moderately to notably heat stressed (cold/moderate and hot, respectively). Target ME is maintained in all microclimates for average winds, and in the hot microclimate with high winds. Plateosaurus becomes cold stressed with high winds in the cold microclimate. Red line = hot microclimate, blue line = cold microclimate, black line = moderate microclimate.
Fig 17
Fig 17. Summary of viable, conditional tolerance, and non-viable results.
The matrix provides a summary of viable combinations of resting metabolic rate (RMR) and core temperature range (CTR) within cold, moderate, and hot microclimates. Green = viable; black = non-viable; yellow = conditional tolerance (e.g., a possible but extreme endmember of viability).
Fig 18
Fig 18. Paleogeographic distribution of body fossils for members of Coelophysoidea and Plateosauridae.
Note the absence of Plateosauridae at tropical latitudes. Data from paleobiodb.org.
Fig 19
Fig 19. Track locations attributed to prosauropods and bones of Coelophysis in the late Triassic of the western USA.
Purple square = field localities from which proxy microclimate data used in this study were previously published [52]. Bones = localities with known coelophysoid body fossils.

References

    1. Bryant HN, Russell AP. The role of phylogenetic analysis in the inference of unpreserved attributes of extinct taxa. Phil Trans Royal Soc B. 1992; 337(1282): 405–418.
    1. Witmer LM. The extant phylogenetic bracket and the importance of reconstructing soft tissues in fossils. In: Thomason J, editor. Functional Morphology in Vertebrate Paleontology; 199519–33.
    1. Hunt G. Measuring rates of phenotypic evolution and the inseparability of tempo and mode. Paleobiology. 2012; 38(3): 351–373.
    1. Peters SE. Genus extinction, origination, and the durations of sedimentary hiatuses. Paleobiology. 2006; 32(3): 387–407.
    1. Barrett PM, McGowan AJ, Page V. Dinosaur diversity and the rock record. Proc. R. Soc. B Biol. Sci. 2009; 276: 2667–2674. - PMC - PubMed

LinkOut - more resources