

Automatic detection of break-over phase onset in horses using hoof-mounted inertial measurement unit sensors
- PMID: 32469939
- PMCID: PMC7259550
- DOI: 10.1371/journal.pone.0233649
Automatic detection of break-over phase onset in horses using hoof-mounted inertial measurement unit sensors
Erratum in
-
Correction: Automatic detection of break-over phase onset in horses using hoof-mounted inertial measurement unit sensors.PLoS One. 2020 Jul 9;15(7):e0236181. doi: 10.1371/journal.pone.0236181. eCollection 2020. PLoS One. 2020. PMID: 32645086 Free PMC article.
Abstract
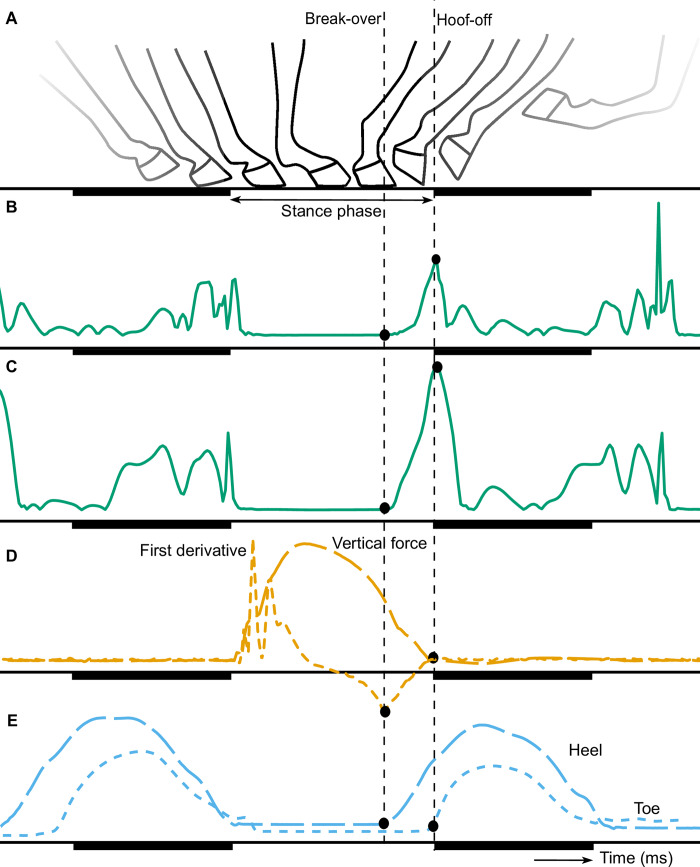
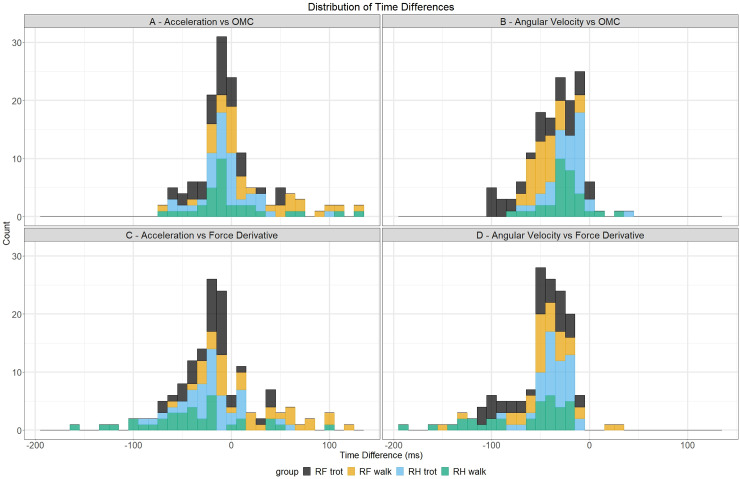
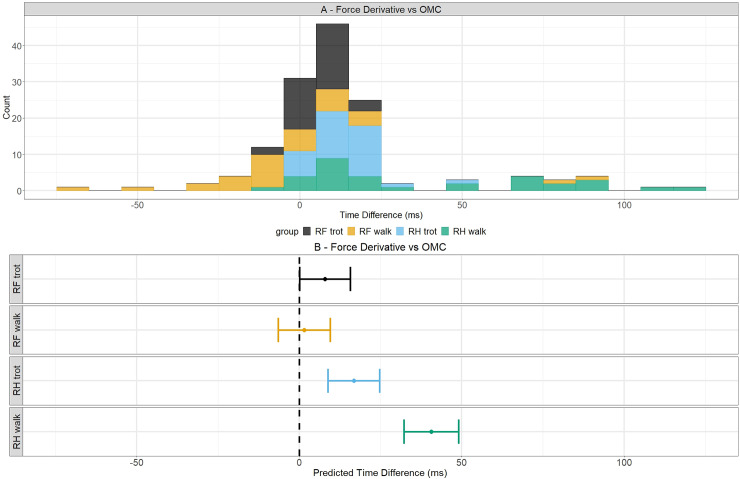
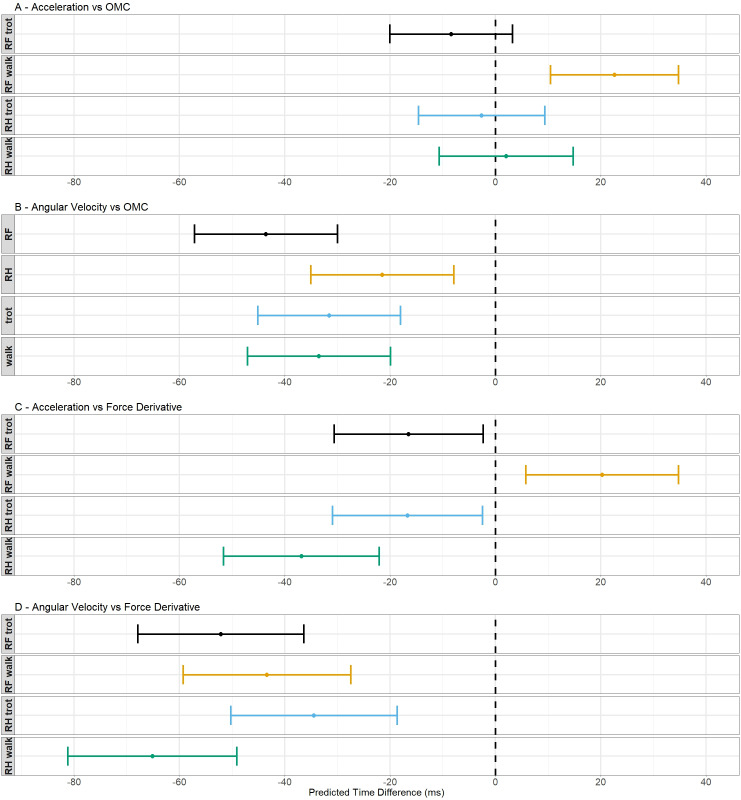
A prolonged break-over phase might be an indication of a variety of musculoskeletal disorders and can be measured with optical motion capture (OMC) systems, inertial measurement units (IMUs) and force plates. The aim of this study was to present two algorithms for automatic detection of the break-over phase onset from the acceleration and angular velocity signals measured by hoof-mounted IMUs in walk and trot on a hard surface. The performance of these algorithms was evaluated by internal validation with an OMC system and a force plate separately. Seven Warmblood horses were equipped with two wireless IMUs which were attached to the lateral wall of the right front (RF) and hind (RH) hooves. Horses were walked and trotted over a force plate for internal validation while simultaneously the 3D position of three reflective markers, attached to lateral heel, lateral toe and lateral coronet of each hoof, were measured by six infrared cameras of an OMC system. The performance of the algorithms was evaluated by linear mixed model analysis. The acceleration algorithm was the most accurate with an accuracy between -9 and 23 ms and a precision around 24 ms (against OMC system), and an accuracy between -37 and 20 ms and a precision around 29 ms (against force plate), depending on gait and hoof. This algorithm seems promising for quantification of the break-over phase onset although the applicability for clinical purposes, such as lameness detection and evaluation of trimming and shoeing techniques, should be investigated more in-depth.
Conflict of interest statement
The authors have read the journal's policy and the authors of this manuscript have the following competing interests: S. Bosch is a paid employee of Inertia-Technology B.V., the company that sells the inertial sensor system used for data collection, and has received salary support for his role in this study. J.P. Voskamp is founder of Rosmark Consultancy and has received salary support for his role in this study. Inertia-Technology B.V., Rosmark Consultancy and Utrecht University are partners in the EquiMoves® corporation. This does not alter our adherence to PLOS ONE policies on sharing data and materials.
Figures
Similar articles
-
Automatic hoof-on and -off detection in horses using hoof-mounted inertial measurement unit sensors.PLoS One. 2020 Jun 3;15(6):e0233266. doi: 10.1371/journal.pone.0233266. eCollection 2020. PLoS One. 2020. PMID: 32492034 Free PMC article.
-
Validation of distal limb mounted inertial measurement unit sensors for stride detection in Warmblood horses at walk and trot.Equine Vet J. 2017 Jul;49(4):545-551. doi: 10.1111/evj.12651. Epub 2016 Dec 13. Equine Vet J. 2017. PMID: 27862238 Free PMC article.
-
Accuracy and precision of gait events derived from motion capture in horses during walk and trot.J Biomech. 2014 Mar 21;47(5):1220-4. doi: 10.1016/j.jbiomech.2013.12.018. Epub 2014 Jan 22. J Biomech. 2014. PMID: 24529754
-
The use of high-speed treadmills for lameness and hoof balance evaluations in the horse.Vet Clin North Am Equine Pract. 1991 Aug;7(2):271-309. doi: 10.1016/s0749-0739(17)30501-1. Vet Clin North Am Equine Pract. 1991. PMID: 1933565 Review.
-
Inertial Sensor Technologies-Their Role in Equine Gait Analysis, a Review.Sensors (Basel). 2023 Jul 11;23(14):6301. doi: 10.3390/s23146301. Sensors (Basel). 2023. PMID: 37514599 Free PMC article. Review.
Cited by
-
Correction: Automatic detection of break-over phase onset in horses using hoof-mounted inertial measurement unit sensors.PLoS One. 2020 Jul 9;15(7):e0236181. doi: 10.1371/journal.pone.0236181. eCollection 2020. PLoS One. 2020. PMID: 32645086 Free PMC article.
-
Automatic hoof-on and -off detection in horses using hoof-mounted inertial measurement unit sensors.PLoS One. 2020 Jun 3;15(6):e0233266. doi: 10.1371/journal.pone.0233266. eCollection 2020. PLoS One. 2020. PMID: 32492034 Free PMC article.
-
Detection of Horse Locomotion Modifications Due to Training with Inertial Measurement Units: A Proof-of-Concept.Sensors (Basel). 2022 Jul 1;22(13):4981. doi: 10.3390/s22134981. Sensors (Basel). 2022. PMID: 35808476 Free PMC article.
-
Task-specific morphological and kinematic differences in Lipizzan horses.Front Vet Sci. 2025 Jun 17;12:1569067. doi: 10.3389/fvets.2025.1569067. eCollection 2025. Front Vet Sci. 2025. PMID: 40599329 Free PMC article.
-
Bilateral Change in Vertical Hoof Force Distribution in Horses with Unilateral Forelimb Lameness before and after Successful Diagnostic Anaesthesia.Animals (Basel). 2022 Sep 19;12(18):2485. doi: 10.3390/ani12182485. Animals (Basel). 2022. PMID: 36139345 Free PMC article.
References
-
- Thomason JJ, Peterson ML. Biomechanical and mechanical investigations of the hoof-track interface in racing horses. Vet Clin North Am Equine Pract. 2008;24(1):53–77. - PubMed
-
- Clayton HM. Comparison of the stride of trotting horses trimmmed with a normal and a broken-back hoof axis. Proceedings 7th American Association of Equine Practitioners1987; p. 289–98.
-
- Clayton HM, Sigafoos R, Curle RD. Effect of three shoe types on the duration of breakover in sound trotting horses. Journal of Equine Veterinary Science. 1990;11(2):129–32.
-
- Wilson A, Agass R, Vaux S, Sherlock E, Day P, Pfau T, et al. Foot placement of the equine forelimb: Relationship between foot conformation, foot placement and movement asymmetry. Equine Vet J. 2016;48(1):90–6. - PubMed
Publication types
MeSH terms
LinkOut - more resources
Full Text Sources
