. 2020 May 29;15(5):e0233651.
doi: 10.1371/journal.pone.0233651. eCollection 2020.

Association of microtubules and axonal RNA transferred from myelinating Schwann cells in rat sciatic nerve

Affiliations

Association of microtubules and axonal RNA transferred from myelinating Schwann cells in rat sciatic nerve

Lucía Canclini et al. PLoS One. .

Abstract

Transference of RNAs and ribosomes from Schwann cell-to-axon was demonstrated in normal and regenerating peripheral nerves. Previously, we have shown that RNAs transfer is dependent on F-actin cytoskeleton and Myosin Va. Here, we explored the contribution of microtubules to newly synthesized RNAs transport from Schwann cell nuclei up to nodal microvilli in sciatic nerves. Results using immunohistochemistry and quantitative confocal FRET analysis indicate that Schwann cell-derived RNAs co-localize with microtubules in Schwann cell cytoplasm. Additionally, transport of Schwann cell-derived RNAs is nocodazole and colchicine sensitive demonstrating its dependence on microtubule network integrity. Moreover, mRNAs codifying neuron-specific proteins are among Schwann cell newly synthesized RNAs population, and some of them are associated with KIF1B and KIF5B microtubules-based motors.


Conflict of interest statement

The authors declare that there is no conflict of interest regarding the publication of this article.

Figures

Fig 1
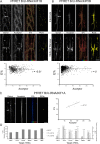
Fig 1. Confocal PFRET and APb-FRET analysis of co-localization between BrU-RNA and microtubules in proximal nerve stumps.
Representative single focal planes of sciatic nerve fibers at the internode and node of Ranvier are shown. Fibers were labeled to visualize newly synthesized RNA (BrU-RNA) as donor (A, B, J, K) and microtubules as acceptor (C, D, L, M). For APb-FRET analysis donor and acceptor channels are showed before (J and L, respectively) and after (K and M, respectively) photobleaching (Pb). FRET efficiency (E%, rainbow LUT 0% -black- to 100% -white) at each pixel is indicated (E, F, N). Position on Schwann cell internodal cytoplasm and axoplasm of ROIs having specific FRET signal is also depicted (G, H, O). E% versus acceptor level is plotted (I, P) for ROIs having specific FRET signal (r = 0.0002 for PFRET analysis–I- or R = -0.0084 for APb-FRET analysis). E% distribution obtained with BrU-RNA and microtubules PFRET and APb-FRET analysis are compared (Q) with those obtained for PFRET and/or APb-FRET analysis of positive FRET control (Vim/Vim) and negative FRET control (MAG/Vim). Dotted white line in (N) delineate the photobleached zone. Bar size: 20 μm. m: myelin. a: axon. Arrow: Cajal band.
Fig 2
Fig 2. Confocal PFRET and APb-FRET analysis of positive and negative controls.
Representative single focal planes of sciatic nerve fibers at the internode are shown. (A-J) Positive FRET analysis control: Fibers were labeled to visualize the same primary antibody (rabbit anti-vimentin) using both 488-Alexa conjugate as donor (A, Vim/donor) and 555-Alexa conjugated anti-rabbit antibody as acceptor (B, Vim/acceptor). After imaging for PFRET analysis (A, B), acceptor was bleached (G, Vim/acceptor after Pb) and a new donor image was taken (F, Vim/donor after Pb). Note that A and B images were used for PFRET analysis and for APb-FRET analysis as “donor and acceptor before Pb images”. FRET efficiency (E%, rainbow LUT 0% -black- to 100% -white) at each pixel is indicated (C, H). Position of ROIs having specific PFRET signal is also depicted (D, I). E% versus acceptor level is plotted (E, J) for ROIs having specific FRET signal (r = - 0.035 for PFRET analysis–E- or R = -0.275 for APb-FRET analysis–J-). (K-T) Negative FRET analysis control: Fibers were labeled to visualize MAG as donor (K, MAG/donor) and vimentin as acceptor (L, Vim/acceptor). After imaging for PFRET analysis (K, L), acceptor was bleached (Q, Vim/acceptor after Pb) and a new donor image was taken (P, MAG/donor after Pb). Note that K and L images were used for PFRET analysis and for APb-FRET analysis as “donor and acceptor before Pb images”. FRET efficiency (E%, rainbow LUT 0% -black- to 100% -white) at each pixel is indicated (M, R). Position of ROIs obtained after analysis is also depicted (N, S). E% versus acceptor level is plotted (O, T) showing random FRET signal (r = 0.474) for PFRET analysis and E% baseline distribution for APb-FRET analysis. Dotted white line in (H, R) delineate the photobleached zone. Bar size: 20 μm. m: myelin. a: axon. Arrow: Cajal band. Arrowhead: Schmidt-Lanterman Incisure.
Fig 3
Fig 3. Effect of nocodazole treatment on BrU-RNA levels in Schwann cell cytoplasm and axoplasm from proximal nerve stumps.
BrU-RNA fluorescence intensity was measured on single focal planes of fibers incubated in BrU and nocodazole containing media. Nocodazole was used at 0 μM (A, D), 0.4 μM or 4 μM (B, E). BrU-RNA signal is shown in green. DAPI DNA staining (white in A and B) maps the position of nuclei. Phalloidin F-actin staining (white in D and E) delineated the boundaries of Schwann cell and axon. Anti-β-tubulin staining (red) reveals the presence of microtubules in fibers. Bar: 10 μm. m: myelin. a: axon. Arrow: Abaxonal Schwann cell cytoplasm. C) BrU-RNA fluorescence intensity measured on Schwann cell cytoplasm was plotted every 2.5 μm from perinuclear region. F) BrU-RNA fluorescence intensity measured on axoplasm was plotted every 2.5 μm from node of Ranvier. Each value is mean ± SD from at least 10 fibers. P-value code: **** p<0.0001, ** p<0.01, * p<0.05.
Fig 4
Fig 4. Co-localization analysis between BrU-RNA and KIFs in proximal nerve stumps.
A) Representative single focal planes of sciatic nerve fibers at the internode and node of Ranvier are illustrated. Fibers were labeled to detect newly synthesized RNA (BrU-RNA) as donor and KIF1B as acceptor. FRET efficiency (E%, rainbow LUT 0% -black- to 100% -white) at each pixel is indicated. Position on Schwann cell internodal cytoplasm and axoplasm of ROIs having specific PFRET signal is also shown. E% versus acceptor level is plotted for ROIs having specific PFRET signal (r = -0.01). B) Representative single focal planes of sciatic nerve fibers at the internode and node of Ranvier are depicted. Fibers were labeled to visualize newly synthesized RNA (BrU-RNA) as donor and KIF5B as acceptor. FRET efficiency (E%, rainbow LUT 0% -black- to 100% -white) at each pixel is indicated. Position on Schwann cell internodal cytoplasm and axoplasm of ROIs having specific PFRET signal is also presented. E% versus acceptor level is plotted for ROIs having specific PFRET signal (r = 0). C) Representative single focal plane of sciatic nerve fibers at the node of Ranvier are shown. Fibers were labeled to visualize newly synthesized RNA (BrU-RNA) as donor and KIF1A as acceptor. FRET efficiency (E%, rainbow LUT 0% -black- to 100% -white) at each pixel is indicated. Position of ROIs obtained after PFRET analysis is also presented. E% versus acceptor level is plotted for those ROIs (r = 0.741). Bar size: 20 μm. NR: node of Ranvier. m: myelin. a: axon. Arrows: Cajal Bands. D) qPCR of mRNA isolated from proximal nerve stumps ribonucleoparticles (Input) or its immunoprecipitation using anti-KIF1B or anti-KIF5B antibodies. Relative abundance (log2) and relative enrichment (log2) of immunoprecipitations over the control condition of target mRNAs were plotted (mean ± SD) (see text). P-value code: **** p<0.0001, *** p<0.001, ** p<0.01, * p<0.05.

Similar articles

Cited by

References

    1. Costa CJ, Willis DE. To the end of the line: Axonal mRNA transport and local translation in health and neurodegenerative disease. Dev Neurobiol. 2018;78: 209–220. 10.1002/dneu.22555 - DOI - PMC - PubMed
    1. Koley S, Rozenbaum M, Fainzilber M, Terenzio M. Translating regeneration: Local protein synthesis in the neuronal injury response. Neurosci Res. 2018; 10.1016/j.neures.2018.10.003 - DOI - PubMed
    1. Sahoo PK, Smith DS, Perrone-Bizzozero N, Twiss JL. Axonal mRNA transport and translation at a glance. J Cell Sci. 2018;131: jcs196808 10.1242/jcs.196808 - DOI - PMC - PubMed
    1. Canclini L, Wallrabe H, Di Paolo A, Kun A, Calliari A, Sotelo-Silveira JR, et al. Association of Myosin Va and Schwann cells-derived RNA in mammal myelinated axons, analyzed by immunocytochemistry and confocal FRET microscopy. Methods. 2014;66 10.1016/j.ymeth.2013.06.007 - DOI - PubMed
    1. Sotelo JR, Canclini L, Kun A, Sotelo-Silveira JR, Xu L, Wallrabe H, et al. Myosin-Va-Dependent Cell-To-Cell Transfer of RNA from Schwann Cells to Axons. PLoS One. 2013;8 10.1371/journal.pone.0061905 - DOI - PMC - PubMed

Publication types