. 2020 May 29;15(5):e0233848.
doi: 10.1371/journal.pone.0233848. eCollection 2020.

Environmental influences on evolvable robots

Affiliations

Environmental influences on evolvable robots

Karine Miras et al. PLoS One. .

Abstract

The field of Evolutionary Robotics addresses the challenge of automatically designing robotic systems. Furthermore, the field can also support biological investigations related to evolution. In this paper, we evolve (simulated) modular robots under diverse environmental conditions and analyze the influences that these conditions have on the evolved morphologies, controllers, and behavior. To this end, we introduce a set of morphological, controller, and behavioral descriptors that together span a multi-dimensional trait space. Using these descriptors, we demonstrate how changes in environmental conditions induce different levels of differentiation in this trait space. Our main goal is to gain deeper insights into the effect of the environment on a robotic evolutionary process.


Conflict of interest statement

The authors have declared that no competing interests exist.

Figures

Fig 1
Fig 1. On the left, the robot modules: Core-component with controller board (C).
Which is the head of the robot; Structural brick (B); Active hinges with servo motor joints in the vertical (A1) and horizontal (A2) axes; and Touch sensor (T). Modules C and B have attachment slots on their four lateral faces, and A1 and A2 have slots on their two opposite lateral faces; T has a single slot which can be attached to any slot of C or B. On the right, an example of simulated robot.
Fig 2
Fig 2. Fluxogram of the late-development process.
From the left to right of the string, each symbol of the early-developed phenotype (string) goes thorough this process, being interpreted and developed (or not expressed).
Fig 3
Fig 3. Illustration of command move_ref_I(ti; di), having ti = 1 and di = 1. The procedure of the command move_ref_N(tn; dn) is analogous to this.
Fig 4
Fig 4. Process of decoding an early-developed phenotype into a late-developed phenotype with morphology and controller.
From the left to right of the string, symbols are interpreted and developed, making incremental changes to the phenotype. An arrow going from the genotype to the phenotype should be interpreted as the process leading to the creation of the phenotype component pointed at by the arrow after the interpretation of the genotype component at the starting end of the arrow.
Fig 5
Fig 5. a) and b) are examples of reproduction operators, and c) is an example of initialization using only 1 group of symbols for all cases of rules.
Fig 6
Fig 6. The Flat and Tilted environments.
Fig 7
Fig 7. Morphology (a) is disproportional and (b) is proportional.
Fig 8
Fig 8. Morphology (a) has four modules that could be extremities (considering the limit determined by the size of the morphology), but only the two indicated by green arrows are; (b) has the maximum number of extremities it could have.
Fig 9
Fig 9. Although both morphologies have two joints, in (b) the second joint is not effective, and would be only if the module indicated by the green arrow was switched with the one indicated by the orange arrow.
Fig 10
Fig 10. Morphology (a) has the modules indicated by green arrows horizontally reflected by the modules indicated by orange arrows; (b) has no modules reflected; (c) has the module indicated by the orange arrow vertically reflected by the modules indicated by the green arrow, but no reflection for the module indicated by the pink arrow.
Fig 11
Fig 11. Example of controller.
Fig 12
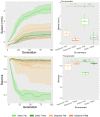
Fig 12. Comparison of behavioral properties in different environmental conditions.
Line plots show the progression of the mean of the population (quartiles over all runs), while boxplots show the mean of the population in the final generation. Significance levels for the Wilcoxon tests in the boxplots are * < 0.05, ** < 0.01, *** < 0.001.
Fig 13
Fig 13. Density maps for pairs of morphological descriptors in the final populations (all runs).
Fig 14
Fig 14. Best robot of each experiment repetition in the different environmental conditions.
Fig 15
Fig 15. Comparison of morphological properties in different environmental conditions.
Line plots show the progression of the mean of the population (quartiles over all runs), while boxplots show the mean of the population in the final generation. Significance levels for the Wilcoxon tests in the boxplots are * < 0.05, ** < 0.01, *** < 0.001. Note that because phenotypic properties are the same in both environments for Seasonal, it is displayed only once in each chart.

References

    1. Eiben AE, Smith JE. Introduction to Evolutionary Computing. 2nd ed Springer; 2015.
    1. Eiben AE, Smith J. From evolutionary computation to the evolution of things. Nature. 2015;521(7553):476–482. 10.1038/nature14544 - DOI - PubMed
    1. Howard D, Eiben AE, Kennedy DF, Mouret JB, Valencia P, Winkler D. Evolving embodied intelligence from materials to machines. Nature Machine Intelligence. 2019;1(1):12–19. 10.1038/s42256-018-0009-9 - DOI
    1. Vargas PA, Paolo EAD, Harvey I, Husbands P, editors. The Horizons of Evolutionary Robotics. MIT Press; 2014.
    1. Darwin C. On the origin of species, 1859. Routledge; 2004.