. 2020 Aug 5;28(8):1887-1901.
doi: 10.1016/j.ymthe.2020.05.011. Epub 2020 May 15.

AAV9-Mediated Expression of SMN Restricted to Neurons Does Not Rescue the Spinal Muscular Atrophy Phenotype in Mice

Affiliations

AAV9-Mediated Expression of SMN Restricted to Neurons Does Not Rescue the Spinal Muscular Atrophy Phenotype in Mice

Aurore Besse et al. Mol Ther. .

Abstract

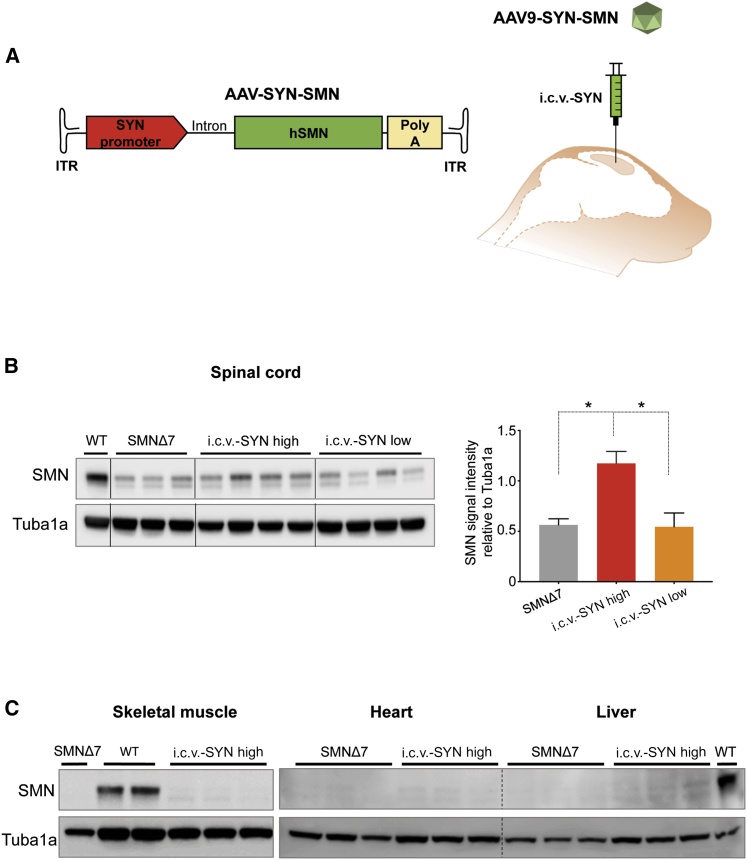
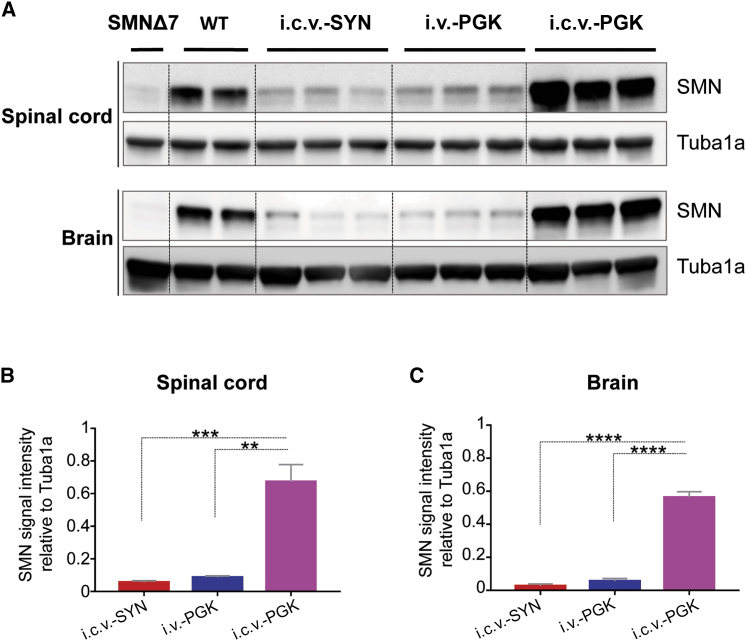
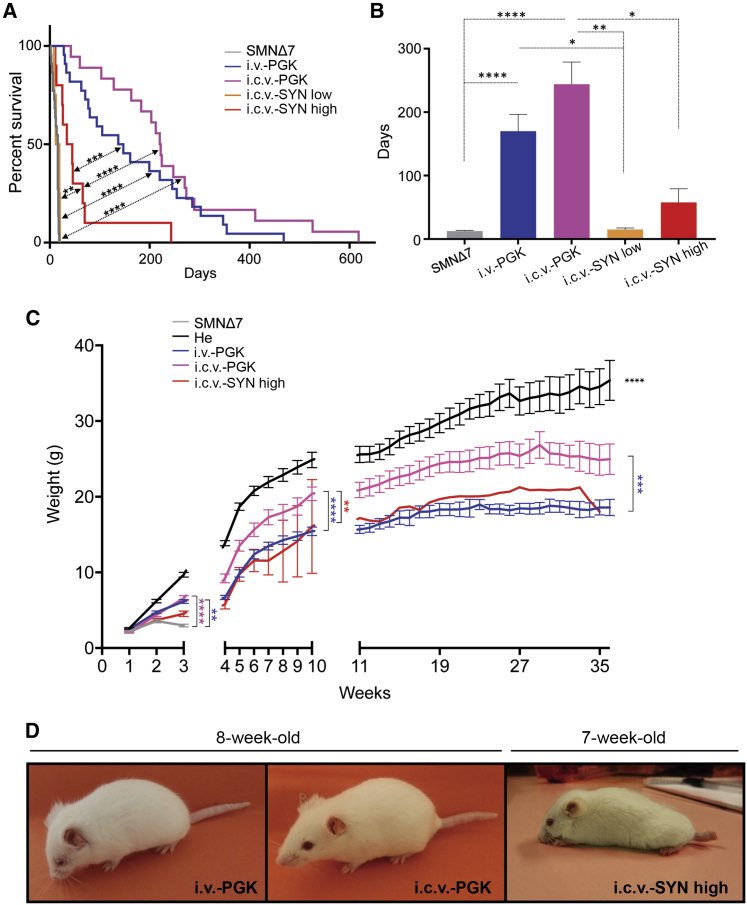
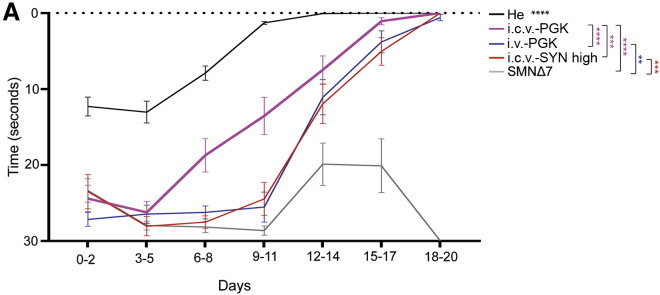
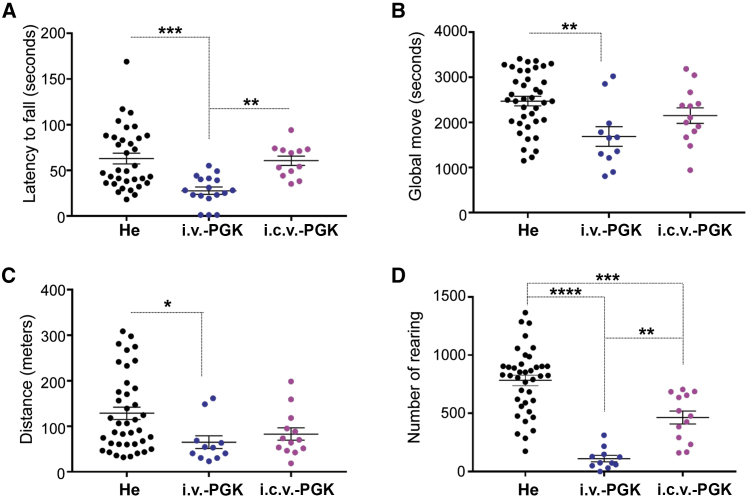
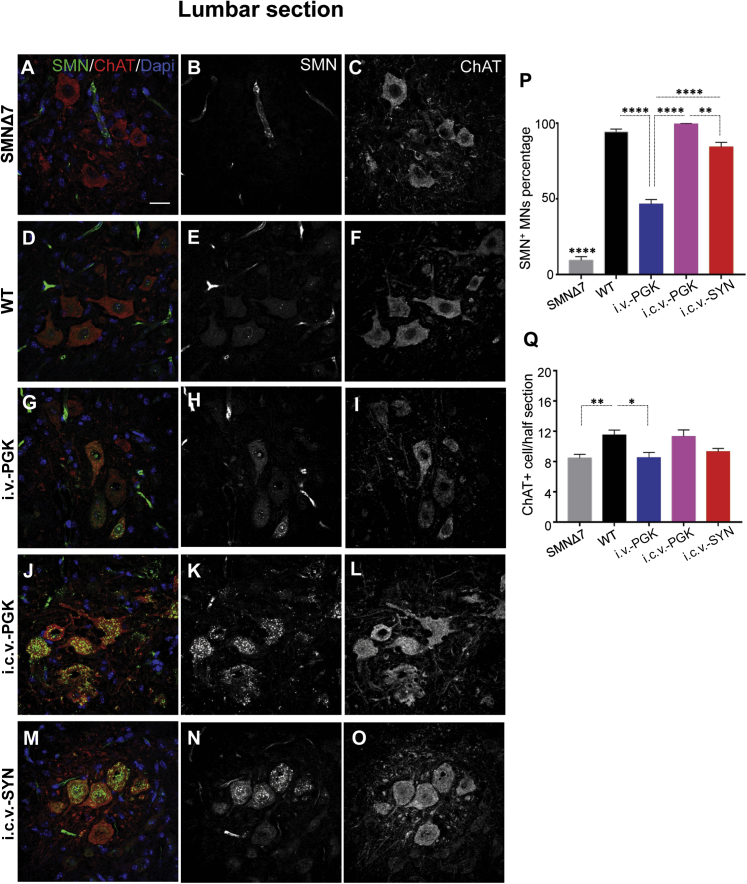
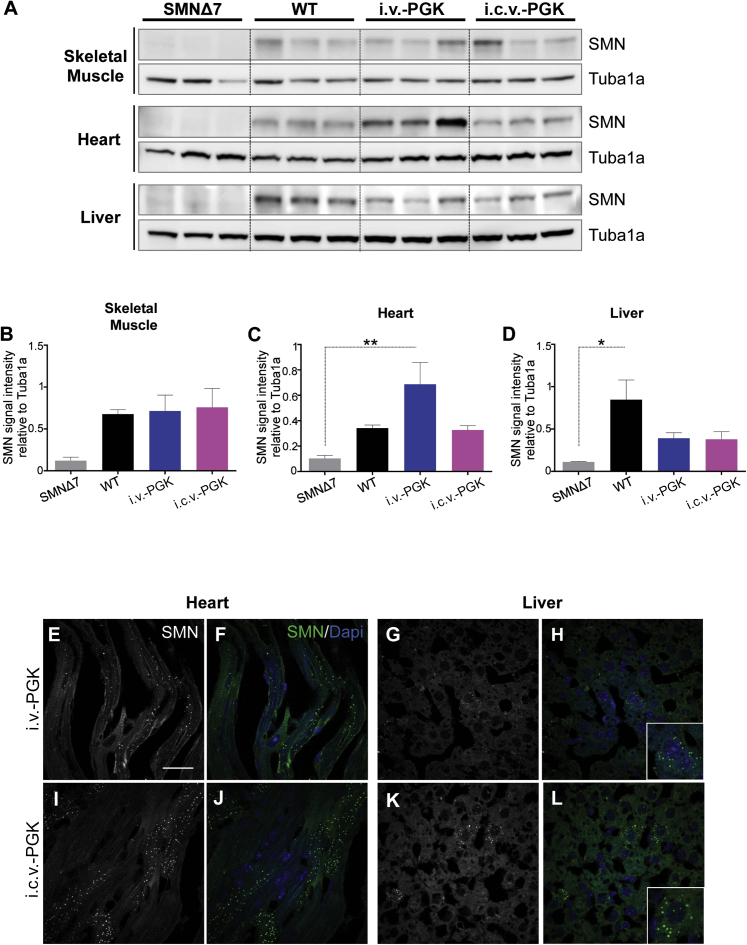
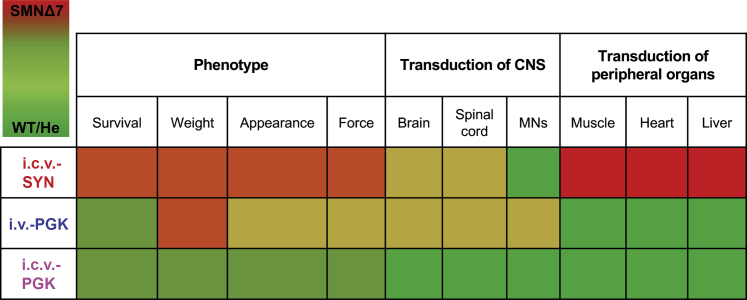
Spinal muscular atrophy (SMA) is a neuromuscular disease mainly caused by mutations or deletions in the survival of motor neuron 1 (SMN1) gene and characterized by the degeneration of motor neurons and progressive muscle weakness. A viable therapeutic approach for SMA patients is a gene replacement strategy that restores functional SMN expression using adeno-associated virus serotype 9 (AAV9) vectors. Currently, systemic or intra-cerebrospinal fluid (CSF) delivery of AAV9-SMN is being explored in clinical trials. In this study, we show that the postnatal delivery of an AAV9 that expresses SMN under the control of the neuron-specific promoter synapsin selectively targets neurons without inducing re-expression in the peripheral organs of SMA mice. However, this approach is less efficient in restoring the survival and neuromuscular functions of SMA mice than the systemic or intra-CSF delivery of an AAV9 in which SMN is placed under the control of a ubiquitous promoter. This study suggests that further efforts are needed to understand the extent to which SMN is required in neurons and peripheral organs for a successful therapeutic effect.

Keywords: AAV; SMA; SMN; gene therapy; neurons; peripheral organs; spinal muscular atrophy; synapsin promoter; ubiquitous promoter.


Figures

None
Graphical abstract
Figure 1
Figure 1
i.c.v. Injection of the High Dose of AAV9-SYN-SMN Transduces the Spinal Cords of SMNΔ7 Mice, but Not Peripheral Organs (A) Schematic representation of the AAV construct expressing SMN under the control of the neuron-specific human synapsin promoter (AAV9-SYN-SMN) (left) and schematic representation of its delivery into the lateral ventricles of SMNΔ7 mice (intracerebroventricular [i.c.v.] injection) (right). The optimized sequence of human SMN1 (hSMN) cDNA (green box) is expressed under control of the SYN promoter (red box). The chimeric intron (Intron) is placed between the promoter and the SMN cDNA and the polyadenylation (poly(A) signal of SV40 (yellow box) downstream of the SMN cDNA. The entire cassette is inserted between the two self-complementary inverted terminal repeats (ITRs) of an AAV2 genome. (B) Left: western blot analyses of SMN expression (37 kDa) in the spinal cords of 14-day-old SMNΔ7 mice after i.c.v. injection of AAV9-SYN-SMN at 1.2 × 1011 vg/mouse (i.c.v.-SYN-SMN high, number of animals, n = 4) and 4.5 × 1010 vg/mouse (i.c.v.-SYN-SMN low, n = 4). Protein lysates from age-matched wild-type (WT) mice (n = 1) and untreated SMNΔ7 mice (n = 3) were used as the reference for SMN expression. α-Tubulin (Tuba1a, 50 kDa) was used as the loading control. Right: densitometric analysis of the western blot signal in the spinal cords of injected SMNΔ7 mice. Statistical analysis was performed on SMNΔ7 (n = 3), i.c.v.-SYN high (n = 4), and i.c.v.-SYN low (n = 4) mice. There was no statistical difference in SMN expression between untreated SMNΔ7 mice and those injected i.c.v. with AAV9-SYN-SMN, whereas i.c.v. injection of the high dose of AAV9-SYN-SMN resulted in a significant increase of SMN expression. Values are expressed as the SMN mean signal intensity relative to that of Tuba1a ± SEM, and the differences between groups were analyzed by one-way ANOVA followed by Tukey’s post hoc test (∗p < 0.05). (C) Western blot analyses of SMN expression (37 kDa) in skeletal muscle, heart, and liver of 14-day-old SMNΔ7 mice injected i.c.v. with AAV9-SYN-SMN at a dose of 1.2 × 1011 vg/mouse (i.c.v.-SYN high), showing a weak SMN signal. Age-matched non-injected SMNΔ7 mice (n = 1 for muscle and n = 3 for heart and liver) and WT mice (n = 2 for muscle and n = 1 for liver) were used as references for SMN expression. Tuba1a (50 kDa) was used as a loading control.
Figure 2
Figure 2
i.c.v. Injection of AAV9-SYN-SMN and i.v. Injection of AAV9-PGK-SMN Restores SMN Expression to Similar Levels in the Spinal Cord and Brain of SMNΔ7 Mice (A) Western blot analyses of SMN expression (37 kDa) in the spinal cords (upper panels) and brains (lower panels) of 14-day-old SMNΔ7 mice after i.c.v. injection of AAV9-SYN-SMN (i.c.v.-SYN, n = 3) at a dose of 1.2 × 1011 vg/mouse or i.v. (i.v.-PGK, n = 3) or i.c.v. injection (i.c.v.-PGK, n = 3) of AAV9-PGK-SMN at a dose of 4.5 × 1010 vg/mouse. Protein lysates from an age-matched non-injected SMNΔ7 mouse (n = 1) and WT mice (n = 2) were used as references for SMN expression. Tuba1a (50 kDa) was used as a loading control. (B and C) Densitometric analysis of western blot signals in the spinal cords (B) and brains (C) of injected SMNΔ7 mice. Statistical analysis was performed on n = 3 mice for each group of injected mice. Significant differences in SMN expression were observed between i.c.v. injection of AAV9-PGK-SMN and either i.v. injection of the same vector or i.c.v. injection of AAV9-SYN-SMN. Values are expressed as the SMN mean intensity relative to that of Tuba1a ± SEM, and the differences between groups were analyzed by one-way ANOVA followed by Tukey’s post hoc test (∗∗p < 0.01, ∗∗∗p < 0.001, ∗∗∗∗p < 0.0001).
Figure 3
Figure 3
i.c.v. Delivery of AAV9-SYN-SMN Results in the Limited Rescue of Survival and Phenotypic Improvement of SMA Mice Relative to i.v. or i.c.v. Injection of AAV9-PGK-SMN (A) Kaplan-Meier survival curves of SMNΔ7 mice injected i.c.v. with AAV9-SYN-SMN at a dose of 4.5 × 1010 vg/mouse (i.c.v.-SYN low, orange, n = 4) or 1.2 × 1011 vg/mouse (i.c.v.-SYN high, red, n = 10) or injected i.v. with AAV9-PGK-SMN at a dose of 4.5 × 1010 vg/mouse (i.v.-PGK, blue, n = 22) or injected i.c.v. (i.c.v.-PGK, pink, n = 18) compared to the survival curve of untreated SMNΔ7 mice (gray, n = 22). All injection methods, except i.c.v.-SYN low, significantly enhanced the lifespan of SMNΔ7 mice. The greatest lifespan was observed with the AAV9-PGK-SMN vector. No statistical difference was observed with this vector between the i.v. and i.c.v. delivery routes. The AAV9-SYN-SMN vector injected i.c.v. only offered a modest extension of lifespan when delivered at the high dose. Values are expressed as the percentage of survival, and differences between groups were analyzed using the log rank Mantel-Cox test (∗∗p < 0.01, ∗∗∗p < 0.001, ∗∗∗∗p < 0.0001). (B) Bar graph showing a significant difference between the mean survival of SMNΔ7 mice (gray, n = 22) and both i.v.- and i.c.v.-injected AAV9-PGK-SMN mice at a dose of 4.5 × 1010 vg/mouse (i.v.-PGK, blue, n = 22; i.c.v.-PGK, pink, n = 18). The mean survival of i.c.v.-SYN-treated mice at either the low dose (4.5 × 1010 vg/mouse, i.c.v.-SYN low, orange, n = 4) or high dose (1.2 × 1011 vg/mouse, i.c.v.-SYN high, red, n = 10) was not significantly different from that of untreated mice, but was significantly shorter than the mean survival obtained after i.c.v. injection of AAV9-PGK-SMN. The mean survival of i.c.v.-SYN-treated mice was significantly lower than that of i.v.-injected mice with AAV9-PGK-SMN only at the low dose. No statistical difference was observed for either delivery route with AAV9-PGK-SMN. Results are expressed as the mean ± SEM, and differences between groups were analyzed using the Kruskal-Wallis test followed by Dunn’s post hoc test (∗p < 0.05, ∗∗p < 0.01, ∗∗∗∗p < 0.0001). (C) Body weight curves of SMNΔ7 mice injected i.c.v. with AAV9-SYN-SMN at a dose of 1.2 × 1011 vg/mouse (i.c.v.-SYN high, red, n = 10) and injected i.v. or i.c.v. with AAV9-PGK-SMN at 4.5 × 1010 vg/mouse (i.v.-PGK, blue, n = 22; i.c.v.-PGK, pink, n = 18) compared to the body weight curves of untreated (gray, n = 22) and heterozygous (He) mice (black, n = 28). Due to early mortality in mice from the SMNΔ7, i.c.v.-SYN low, and i.c.v.-SYN high groups, the group comparisons were treated separately for three time periods: 1–3 weeks, 4–10 weeks, and 11–36 weeks. All groups were sex balanced. Data are expressed as the mean ± SEM, and differences between the curves of the i.v.-PGK, i.c.v.-PGK, i.c.v.-SYN high, and He mice were compared by two-way mixed-model ANOVA followed by Tukey’s post hoc test (treatment and time). At 1–3 weeks (comparison between all groups), significant differences were observed between the i.c.v. and i.v. injections of AAV9-PGK-SMN but not between either i.c.v.-SYN low or i.c.v.-SYN high and the untreated SMNΔ7 mice. The He group was significantly different than all other groups. At 4–10 weeks (comparison between He, i.c.v.-PGK, i.v.-PGK, and i.c.v.-SYN high), significant differences were observed between the He mice and all injection groups and between i.c.v.-PGK and both i.v.-PGK and i.c.v.-SYN high. No difference was observed between i.v.-PGK and i.c.v.-SYN high. At 11–36 weeks (comparison between He, i.c.v.-PGK, and i.v.-PGK), significant differences were observed between all tested groups (∗∗p < 0.01, ∗∗∗p < 0.001, ∗∗∗∗p < 0.0001). (D) Representative images showing the phenotype of SMNΔ7 mice injected i.v. or i.c.v. with AAV9-PGK-SMN at 8 weeks of age (left and middle, respectively) and injected i.c.v. with AAV9-SYN-SMN at 7 weeks of age (right). The SMNΔ7 mouse treated with AAV9-PGK-SMN i.v. showed reduced self-grooming, a shorter tail, and ear necrosis. The mouse injected with AAV9-PGK-SMN i.c.v. showed solely a shorter tail and ear necrosis. The i.c.v.-SYN-injected mouse showed signs of kyphosis, as well as pronounced tail necrosis.
Figure 4
Figure 4
Injection of Either AAV9-PGK-SMN or AAV9-SYN-SMN Restores the Righting Reflex in SMNΔ7 Juvenile Mice (A) The righting reflex was assessed daily in SMNΔ7 mice injected i.v. (i.v.-PGK, blue, n = 14) or i.c.v. (i.c.v.-PGK, pink, n = 12) with AAV9-PGK-SMN at a dose of 4.5 × 1010 vg/mouse or in i.c.v.-SYN-injected (i.c.v.-SYN high, n = 10) SMNΔ7 mice and compared to that of untreated SMNΔ7 mice (gray, n = 22) and He mice (black, n = 35) from birth to postnatal day 20. Data are expressed as the mean every 3 days ± SEM. Significant statistical differences were observed between all compared groups except for the comparison between i.v.-PGK- and i.c.v.-SYN high-injected mice. Differences between the curves were analyzed by two-way mixed model ANOVA followed by Tukey’s post hoc test (treatment and time) (∗∗p < 0.01, ∗∗∗p < 0.001, ∗∗∗∗p < 0.0001).
Figure 5
Figure 5
i.c.v. Injection of SMNΔ7 Mice with AAV9-PGK-SMN Provides Better and Sustained Protection of Locomotor Functions than Does Systemic Delivery (A) The rotarod performance of SMNΔ7 mice injected i.v. (i.v.-PGK, blue dots, n = 17) or i.c.v. (i.c.v.-PGK, pink dots, n = 12) with AAV9-PGK-SMN at a dose of 4.5 × 1010 vg/mouse and He mice (black dots, n = 34) was assessed daily from 10 weeks of age. Mice were trained for 10 days and the rotarod performance was recorded during the next 10 days. Data are expressed as the mean ± SEM. Differences between groups were analyzed by the Kruskal-Wallis test followed by Dunn’s post hoc test (∗∗p < 0.01, ∗∗∗p < 0.001). (B–D) Spontaneous motor activity monitored during 1 h using an actimeter for SMNΔ7 mice injected i.v. (i.v.-PGK, blue dots, n = 11) or i.c.v. (i.c.v.-PGK, pink dots, n = 13) with AAV9-PGK-SMN and He controls (black dots, n = 39) at 12 weeks of age. Overall time spent moving (B), the covered distance (C), and the number of rearings (D) were recorded. Data are expressed as the mean ± SEM. Differences between groups were analyzed by one-way ANOVA followed by Tukey’s post hoc test (∗p < 0.05, ∗∗p < 0.01, ∗∗∗p < 0.001, ∗∗∗∗p < 0.0001).
Figure 6
Figure 6
SMN Transduction in MNs of the Lumbar Spinal Cord Is Higher in i.c.v.-SYN Mice Than in Systemically Treated SMNΔ7 Mice (A–O) Representative transverse sections of the ventral horn of the lumbar spinal cord from SMNΔ7 mice injected i.v. (i.v.-PGK, G–I) or i.c.v. (i.c.v.-PGK, J–L) with AAV9-PGK-SMN at a dose of 4.5 × 1010 vg/mouse; SMNΔ7 mice injected i.c.v. with AAV9-SYN-SMN at 1.2 × 1011 vg/mouse (i.c.v.-SYN, M–O); untreated SMNΔ7 mice (A–C); and WT mice (D–F). Sections were processed for ChAT/SMN double immunofluorescence (green, SMN+ cells, red, ChAT+ cells) at 14 days of age. Nuclei were stained with DAPI (blue). Single SMN staining (gray) is presented in (B), (E), (H), (K) and (N). Single ChAT staining (gray) is presented in (C), (F), (I), (L), and (O). Scale bar, 25 μm. (P) Percentage of SMN+ MNs per section of 14-day-old SMNΔ7 mice injected i.v. (i.v.-PGK, blue, n = 3) or i.c.v. (i.c.v.-PGK, pink, n = 3) with AAV9-PGK-SMN at a dose of 4.5 × 1010 vg/mouse and SMNΔ7 mice injected i.c.v. with AAV9-SYN-SMN at a dose of 1.2 × 1011 vg/mouse (i.c.v.-SYN, red, n = 3). Age-matched non-injected SMNΔ7 mice (gray, n = 3) and WT mice (black, n = 4) were used as references. Data are expressed as mean percentage ± SEM and differences between groups were analyzed by one-way ANOVA followed by Tukey’s post hoc test (∗∗p < 0.01, ∗∗∗∗p < 0.0001). (Q) Quantitative analysis of the number of ChAT+ MNs of 14-day-old SMNΔ7 mice injected i.v. (i.v.-PGK, blue, n = 3) or i.c.v. (i.c.v.-PGK, pink, n = 3) with AAV9-PGK-SMN at a dose of 4.5 × 1010 vg/mouse and SMNΔ7 mice injected i.c.v. with AAV9-SYN-SMN at a dose of 1.2 × 1011 vg/mouse (i.c.v.-SYN, red, n = 3). Age-matched non-injected SMNΔ7 mice (gray, n = 6) and WT mice (black, n = 6) were used as references. Approximately 25 sections per mouse were scored. Data are expressed as the mean ± SEM. Differences between groups were analyzed by one-way ANOVA followed by Tukey’s post hoc test (∗p < 0.05, ∗∗p < 0.01).
Figure 7
Figure 7
i.v. or i.c.v. Injection of AAV9-PGK-SMN Restores SMN Expression in Peripheral Organs to Similar Levels (A) Western blot analyses of SMN expression (37 kDa) in skeletal muscle (upper panel), heart (middle panel), and liver (lower panel) of 14-day-old SMNΔ7 mice injected i.v. (i.v.-PGK, n = 3) or i.c.v. (i.c.v.-PGK, n = 3) with AAV9-PGK-SMN at 4.5 × 1010 vg/mouse. Age-matched non-injected SMNΔ7 mice (n = 3) and WT mice (n = 3) were used as references for SMN expression. Tuba1a (50 kDa) was used as a loading control. (B–D) Densitometry analysis of western blot results of skeletal muscle (B), heart (C), and liver (D), showing levels of SMN in i.v.- or i.c.v.-injected mice and similar to those of WT animals. Values are expressed as the SMN mean signal intensity relative to that of Tuba1a ± SEM. The differences between groups were analyzed by one-way ANOVA followed by Tukey’s post hoc test (∗p < 0.05, ∗∗p < 0.01). (E–L) Representative sections of heart (E, F, I, and J) and liver (G, H, K, and L) from SMNΔ7 mice after i.v. (E–H) or i.c.v. (I–L) injection of AAV9-PGK-SMN processed for immunofluorescence at 14 days of age using an anti-SMN antibody (green). Nuclei were stained by DAPI (blue). SMN-positive staining is presented alone (gray, E, G, I, and K) or combined with DAPI (green and blue, respectively; F, H, J, and L). Scale bar, 25 μm. A 2-fold magnification of liver cells is shown in the lower right corner of (H) and (L).
Figure 8
Figure 8
Graphical Summary of the Main Findings of the Study The effects of each treatment (i.c.v.-SYN, i.v.-PGK, and i.c.v.-PGK) on the phenotype (survival, body weight, general appearance, and neuromuscular functions) are classified according to a color code, in which brilliant red and brilliant green correspond to SMNΔ7 and WT/He mice, respectively. The effects on the phenotype are compared to transduction of CNS (brain, spinal cord, and MNs) and peripheral organs (skeletal muscle, heart, and liver). SMN expression restricted to neurons (i.c.v.-SYN) mediates a modest improvement of the SMNΔ7 mouse phenotype. SMN expression in the peripheral organs contributes to a better rescue of the phenotype (i.v.-PGK and i.c.v.-PGK). High expression of SMN in both CNS tissues and peripheral organs results in the best rescue of SMA mice (i.c.v.-PGK), which are still not comparable to WT or He mice. This work highlights the importance of SMN expression in the CNS and peripheral organs for complete rescue of the SMNΔ7 phenotype.

References

    1. Pearn J. Incidence, prevalence, and gene frequency studies of chronic childhood spinal muscular atrophy. J. Med. Genet. 1978;15:409–413. - PMC - PubMed
    1. Prior T.W. Perspectives and diagnostic considerations in spinal muscular atrophy. Genet. Med. 2010;12:145–152. - PubMed
    1. Prior T.W., Snyder P.J., Rink B.D., Pearl D.K., Pyatt R.E., Mihal D.C., Conlan T., Schmalz B., Montgomery L., Ziegler K. Newborn and carrier screening for spinal muscular atrophy. Am. J. Med. Genet. A. 2010;152A:1608–1616. - PubMed
    1. Crawford T.O., Pardo C.A. The neurobiology of childhood spinal muscular atrophy. Neurobiol. Dis. 1996;3:97–110. - PubMed
    1. Kolb S.J., Kissel J.T. Spinal muscular atrophy. Neurol. Clin. 2015;33:831–846. - PMC - PubMed

Publication types

MeSH terms

Substances