

doi: 10.1053/j.gastro.2020.05.057.
Epub 2020 May 27.
Mortality From Coronavirus Disease 2019 Increases With Unsaturated Fat and May Be Reduced by Early Calcium and Albumin Supplementation
Collaborators,
Affiliations
- PMID: 32470338
- PMCID: PMC7250771
- DOI: 10.1053/j.gastro.2020.05.057
Item in Clipboard
Mortality From Coronavirus Disease 2019 Increases With Unsaturated Fat and May Be Reduced by Early Calcium and Albumin Supplementation
Gastroenterology.
2020 Sep.
No abstract available
Keywords: Coronavirus; Fatty Acid; Lipotoxicity; Unsaturated.
Figures
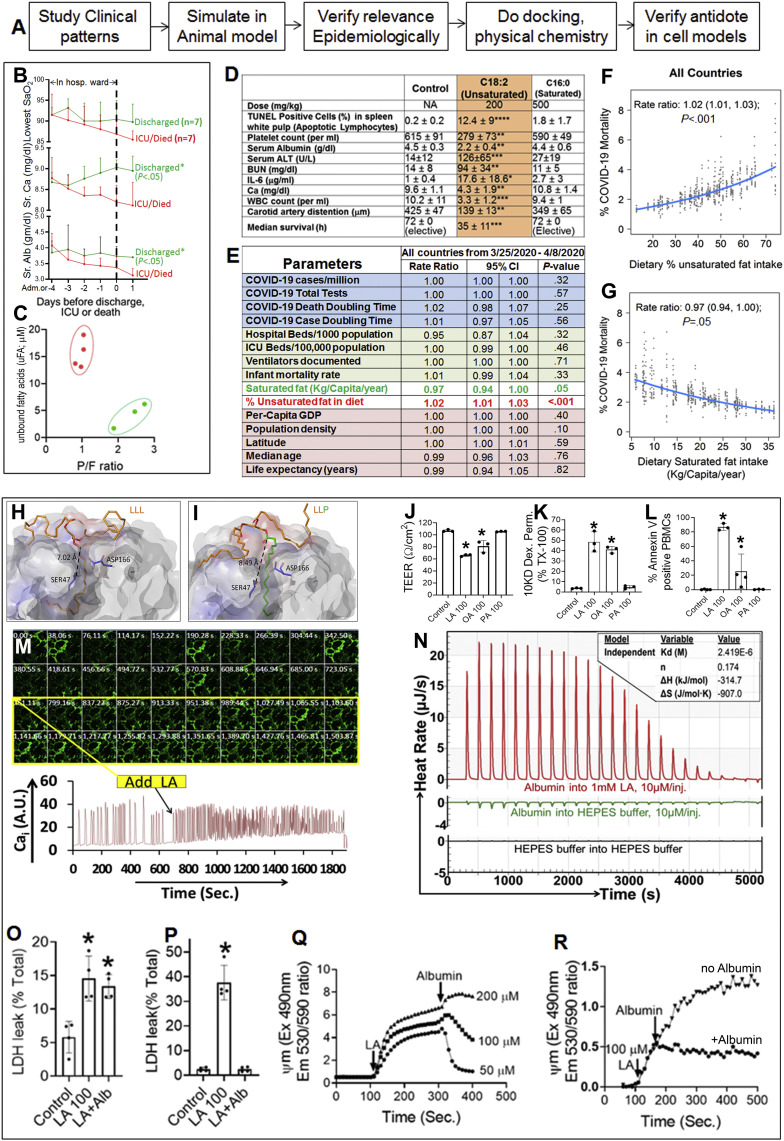
(A) Schematic summarizing the study’s approach. (B) Time course starting at the day of admission or –4 days (which ever came first) leading to the event on day 0, which is the day of discharge, death, or ICU admission. The green lines show the trends of those who were discharged to home, and the red lines show those who were transferred to the ICU or died. The AM laboratory test results collected on the day of dismissal are shown as day 1 to allow comparison of the trend. The upper panel shows the lowest oxygen saturation measured on pulse oximetry (Sao 2) in those admitted to the ICU. Also shown are total serum calcium (middle panel), and serum albumin (lower panel). ∗Significant (P < .05) difference for the whole time course matched for each day when comparing red and green values on t test. ǂSignificant difference from admission or day –4. (C) Relationship of peak unbound fatty acids in ICU patients vs the ratio of partial pressure of oxygen to the percentage of oxygen being delivered (P/F ratio). (D) Parameters in mice given LA (C18:2), or palmitic acid (C16:0) at the mentioned doses. ∗P < .05, ∗∗P < .01, ∗∗∗P < .001, ∗∗∗∗P < .0001 on 1-way analysis of variance compared to controls. There were 8 mice per group. The terminal deoxynucleotidyl transferase–mediated deoxyuridine triphosphate nick-end labeling staining was done on paraffin sections of the spleen, and the percentage of positive cells in the white pulp was quantified. A drop in carotid artery distention supports hypotension and, when extreme, shock. Mice in the control and C16:0 groups were electively killed at 72 hours. (E) Univariate analysis of risk factors to percent mortality from COVID-19: each row mentions the parameter analyzed on the extreme left. The columns show the rate ratios, along with the 95% confidence intervals and P values for all countries with >1000 COVID cases reported between March 25, 2020, and April 8, 2020. (F, G) Graphical presentation (marginal plots) of countries showing the association between percent mortality from COVID-19 and (F) percent dietary unsaturated fat intake and (G) dietary saturated fat intake. The blue line is the expected value of the mortality change with respect to the value of saturated fat or percent UFA. The dots are the daily data. (H, I) Images of the induced-fit docking simulations of the (H) LA (C18:2) triglyceride of LLL and (I) 1,2-dilinoleoyl-3-palmitoyl-rac-glycerol (LLP) docked into the catalytic pocket (dark gray) of ATGL by using Schrodinger Maestro. The dashed line shows the distance of the triglyceride’s primary carbonyl group in angstroms from the catalytic serine (SER47). (J, K) Bar graphs with standard deviation from HUV-EC-C cell monolayers exposed for 2 hours to 100 μmol/L of the fatty acid below the respective bar showing (J) transendothelial cell electrical resistance and (K) leakage of 10-kD dextran from the upper chamber into the lower chamber. The leakage induced by 1% Triton-X 100 was taken as 100%. ∗P < .05 vs control in t test. Each point for a condition represents a separate experiment. (L) Percentage of peripheral blood mononuclear cells staining positive for Annexin V after a 60-minute treatment with 100 μmol/L of the fatty acid below the respective bar. (M) Time series (images above, graph below), of Fluo-4AM-loaded cardiomyocytes showing the change in florescence signal after the addition of 150 μmol/L LA (C18:2; yellow rectangle in images ). (N) Representative thermograms showing the heat rate of albumin interacting with C18:2 (red lines) with thermodynamic parameters in the inset box. Also shown are thermograms of albumin injection into HEPES buffer (green line) and buffer injection into buffer (black line). (O) The effect of adding 160 μmol/L albumin 30 minutes after adding 100 μmol/L LA on lactate dehydrogenase (LDH) leakage from J774 A.1 cells. (P) The effect of preincubating HEK293 cells with 160 μmol/L albumin and 2 mmol/L calcium (LA + Alb) on 100 μmol/L LA-induced injury (LA 100). (Q, R) Representative curves showing the effect of adding 160 μmol/L albumin 300 seconds (Q) after inducing ψm by different concentrations of LA in HEK293 cells or (R) after 150 seconds in pancreatic acinar cells. CI, confidence interval; Em, emission; Ex, excitation; ICU, intensive care unit; M, mol/L; OA, oleic acid; PA, palmitic acid; PBMC, peripheral blood mononuclear cells; Sec., seconds; TEER, transendothelial cell electrical resistance.
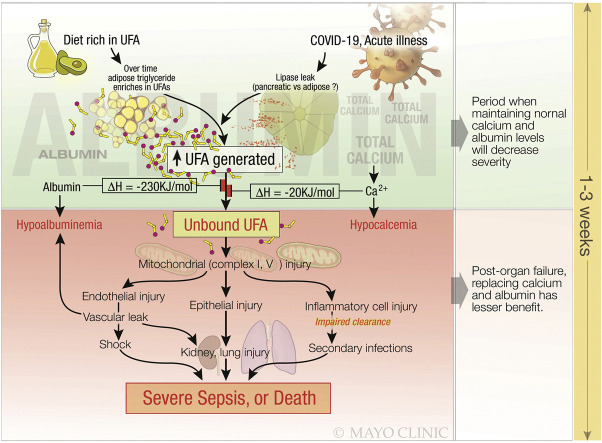
Schematic describing how a diet rich in unsaturated fat, makes adipocyte triglyceride unsaturated, which predisposes to severe COVID-19, resulting in severe sepsis or death, and how this can be prevented earlier in the disease. The early phase of the disease (green background) is before organ failure has set in. At this time neutralization of the UFAs by albumin and calcium can reduce toxicity from the unbound form of UFAs. However, once the UFAs have cause mitochondrial complex I and V to be injured in the multiple vital cell types (red background), organ failure sets in. At this time supplementing albumin and/ or calcium is ineffective, since the fatty acids have already caused mitochondrial damage and organ failure. Therefore early supplementation of calcium and albumin may prevent the progression of COVID-19 to a severe disease.
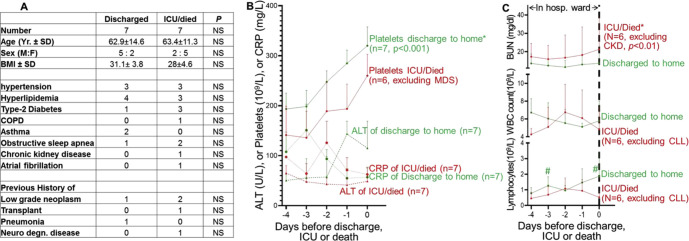
(A) Table comparing the demographics and comorbidities of patients with COVID-19 who were discharged home vs those who were admitted to the ICU or died (ICU/died). (B) Time course starting at the day of admission or –4 days (whichever came first) leading to the event on day 0, which is the day of discharge; death; or ICU admission. The green lines show the trends of those who were discharged to home, and the red lines show those who were transferred to the ICU or died. From top to bottom, these are morning (AM) laboratory values for platelet counts, serum alanine aminotransferase, and C -reactive protein. ∗Significant (P < .05) difference for the whole time course matched for each day when comparing red and green values on t test. One patient who died had myelodysplastic syndrome and was excluded. (C) The patterns for BUN, total WBC counts, and absolute lymphocyte counts. The patients excluded are mentioned, along with the underlying comorbidity. #Significant difference between red and green values for the day. ALT, alanine aminotransferase; BMI, body mass index; BUN, blood urea nitrogen; CKD, chronic kidney disease; CLL, chronic lymphocytic leukemia; CRP, C-reactive protein; COPD, chronic obstructive pulmonary disease; degn., degenerative; F, female; hosp., hospital; M, male; SD, standard deviation; WBC, white blood cell; Yr., years.
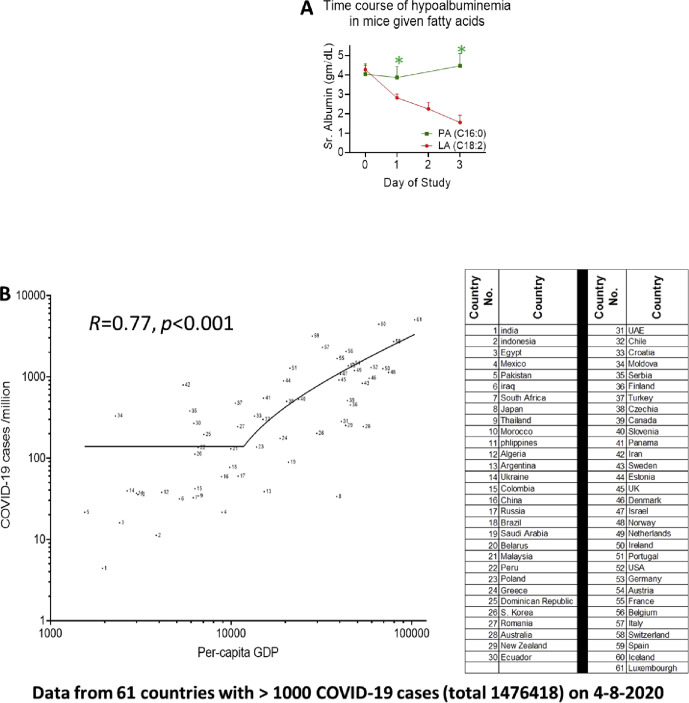
(A) Time course of serum albumin levels in mice given the UFA LA (C18:2, red line) vs those give palmitic acid (C16:0, green line). There were 8 mice per group. ∗P < .0001 vs for same-day values measured in the 2 groups of mice. (B) Nonlinear correlation of the number of COVID-19 cases diagnosed/million population of a country and its per capita GDP as of April 8, 2020, which was the last day of the study. Note that the inflection point for increase in testing is noted at approximately US$15,000. The table on the right gives the name of the country corresponding to the number shown. PA, palmitic acid; Sr., serum; UAE, United Arab Emirates.
Comment in
-
Lipotoxicity and Cytokine Storm in Severe Acute Pancreatitis and COVID-19.Gastroenterology. 2020 Sep;159(3):824-827. doi: 10.1053/j.gastro.2020.07.014. Epub 2020 Jul 17. Gastroenterology. 2020. PMID: 32682765 Free PMC article. No abstract available.
References
-
- Lighter J. Clin Infect Dis. 2020
Supplementary References
Publication types
MeSH terms
Substances
Grants and funding
LinkOut - more resources
Full Text Sources
Medical
