

Non-parametric Polygenic Risk Prediction via Partitioned GWAS Summary Statistics
- PMID: 32470373
- PMCID: PMC7332650
- DOI: 10.1016/j.ajhg.2020.05.004
Non-parametric Polygenic Risk Prediction via Partitioned GWAS Summary Statistics
Abstract
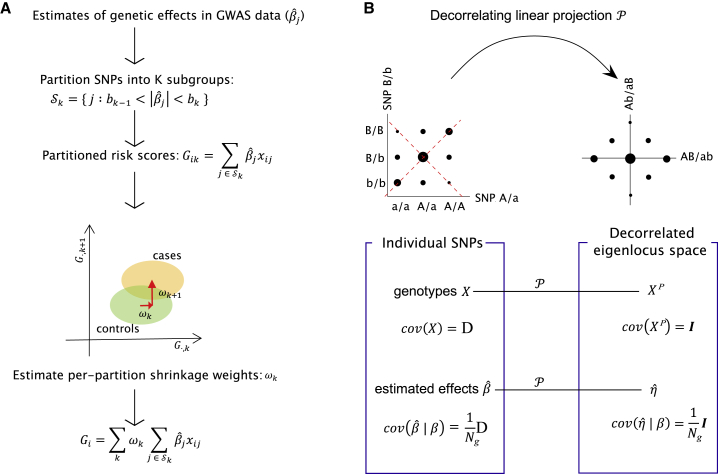
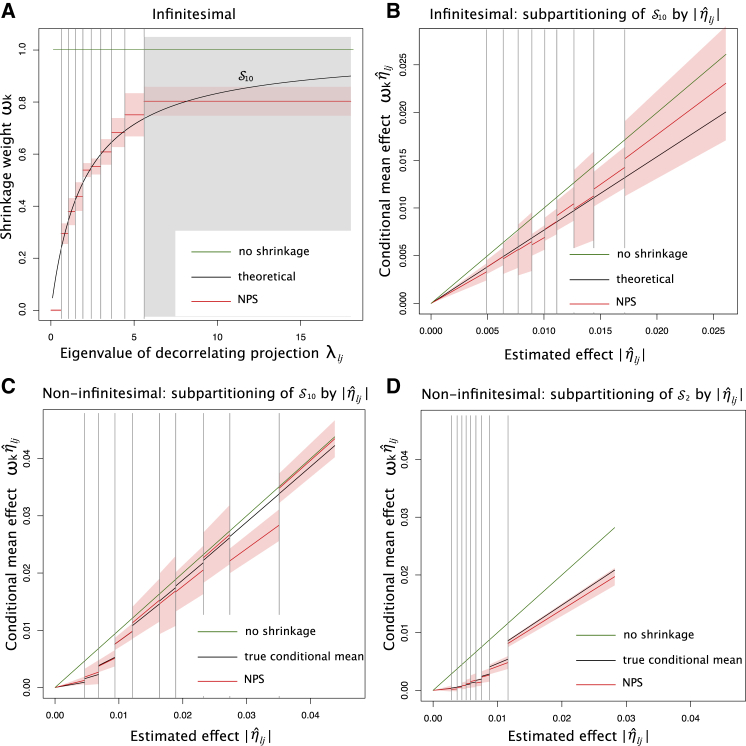
In complex trait genetics, the ability to predict phenotype from genotype is the ultimate measure of our understanding of genetic architecture underlying the heritability of a trait. A complete understanding of the genetic basis of a trait should allow for predictive methods with accuracies approaching the trait's heritability. The highly polygenic nature of quantitative traits and most common phenotypes has motivated the development of statistical strategies focused on combining myriad individually non-significant genetic effects. Now that predictive accuracies are improving, there is a growing interest in the practical utility of such methods for predicting risk of common diseases responsive to early therapeutic intervention. However, existing methods require individual-level genotypes or depend on accurately specifying the genetic architecture underlying each disease to be predicted. Here, we propose a polygenic risk prediction method that does not require explicitly modeling any underlying genetic architecture. We start with summary statistics in the form of SNP effect sizes from a large GWAS cohort. We then remove the correlation structure across summary statistics arising due to linkage disequilibrium and apply a piecewise linear interpolation on conditional mean effects. In both simulated and real datasets, this new non-parametric shrinkage (NPS) method can reliably allow for linkage disequilibrium in summary statistics of 5 million dense genome-wide markers and consistently improves prediction accuracy. We show that NPS improves the identification of groups at high risk for breast cancer, type 2 diabetes, inflammatory bowel disease, and coronary heart disease, all of which have available early intervention or prevention treatments.
Keywords: genome-wide association study; linkage disequilibrium; non-parametric prediction; phenotype prediction; polygenic score; prognosis; summary statistics.
Copyright © 2020 American Society of Human Genetics. Published by Elsevier Inc. All rights reserved.
Conflict of interest statement
S.K. is a co-founder, chief executive officer, and a board member of Verve Therapeutics.
Figures
References
-
- Grundy S.M., Stone N.J., Bailey A.L., Beam C., Birtcher K.K., Blumenthal R.S., Braun L.T., de Ferranti S., Faiella-Tommasino J., Forman D.E. 2018 AHA/ACC/AACVPR/AAPA/ABC/ACPM/ADA/AGS/APhA/ASPC/NLA/PCNA Guideline on the Management of Blood Cholesterol: A Report of the American College of Cardiology/American Heart Association Task Force on Clinical Practice Guidelines. Circulation. 2018;139:e1082–e1143. - PMC - PubMed
-
- Goddard M.E., Hayes B.J. Mapping genes for complex traits in domestic animals and their use in breeding programmes. Nat. Rev. Genet. 2009;10:381–391. - PubMed
-
- Falke K.C., Glander S., He F., Hu J., de Meaux J., Schmitz G. The spectrum of mutations controlling complex traits and the genetics of fitness in plants. Curr. Opin. Genet. Dev. 2013;23:665–671. - PubMed
Publication types
MeSH terms
Grants and funding
LinkOut - more resources
Full Text Sources
