. 2020 Jun 8;37(6):867-882.e12.
doi: 10.1016/j.ccell.2020.04.015. Epub 2020 May 28.

Extensive Remodeling of the Immune Microenvironment in B Cell Acute Lymphoblastic Leukemia

Affiliations

Extensive Remodeling of the Immune Microenvironment in B Cell Acute Lymphoblastic Leukemia

Matthew T Witkowski et al. Cancer Cell. .

Abstract

A subset of B cell acute lymphoblastic leukemia (B-ALL) patients will relapse and succumb to therapy-resistant disease. The bone marrow microenvironment may support B-ALL progression and treatment evasion. Utilizing single-cell approaches, we demonstrate B-ALL bone marrow immune microenvironment remodeling upon disease initiation and subsequent re-emergence during conventional chemotherapy. We uncover a role for non-classical monocytes in B-ALL survival, and demonstrate monocyte abundance at B-ALL diagnosis is predictive of pediatric and adult B-ALL patient survival. We show that human B-ALL blasts alter a vascularized microenvironment promoting monocytic differentiation, while depleting leukemia-associated monocytes in B-ALL animal models prolongs disease remission in vivo. Our profiling of the B-ALL immune microenvironment identifies extrinsic regulators of B-ALL survival supporting new immune-based therapeutic approaches for high-risk B-ALL treatment.

Keywords: acute lymphoblastic leukemia; chemotherapy; immune microenvironment; monocytes; relapse; single cell.


Conflict of interest statement

Declaration of Interests The authors declare no competing interests.

Figures
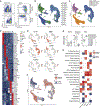
Figure 1.
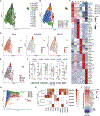
Figure 1.. B-ALL Remodels the Healthy Bone Marrow Immune Microenvironment.
A, Representative flow cytometry of primary healthy and CD19+CD10+ B-ALL diagnosis bone marrow. B, UMAP visualization of 53,447 individual cells from eleven individual primary thawed mononuclear bone marrow samples taken from healthy donors (n = 4), as well as ETV6/RUNX1 (ETV, n = 5) and Ph+ (PH, n = 2) B-ALL patients. C, Marker-based cell type identification analysis allowed prediction of six broad immune cell types across all profiled single cells. D, Gene expression heatmap of top-10 cell type-specific marker genes as measured by Wilcoxon rank-sum test. E, Expression levels of lineage-specific genes overlaid on the UMAP representation. F, Heatmap showing pair-wise distribution density ratio of the UMAP projections of diagnosis and healthy bone marrow cells. G, Boxplot showing fraction of HSPC, Myeloid and T/NK cells in the non-B cell, non-erythrocytic fraction of individual patients. Wilcoxon rank-sum test performed to measure differences in representation between healthy (H) and diagnosis (D) groups, with p value indicated on plots. Horizontal lines in the boxplots represent the median, the lower and upper hinges correspond to the first and third quartiles, and the whiskers extend from the hinge up to 1.5 times the interquartile range from the hinge. H, Significantly-enriched MSigDB Hallmark gene sets in healthy versus diagnosis cells within each of the immune cell types. Normalized enrichment score (NES) denoted by shade of color highlighted in legend.
Figure 2.
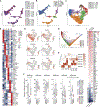
Figure 2.. Bone Marrow-resident Myeloid Cells are Altered in the Presence of Leukemia.
A, UMAP visualization of 7,122 individual Myeloid cells from eleven individual primary thawed mononuclear bone marrow samples taken from healthy donors and B-ALL patients. B, Six transcriptionally distinct Myeloid cell clusters overlaid on the UMAP representation. Cluster abbreviations, for example, HD-M1 is based on Healthy/Diagnosis Myeloid cluster L C, Relative expression of top Myeloid cluster-specific marker genes. D, Expression levels of CD14, FCGR3A and CSF1R in the Myeloid cells overlaid on the UMAP representation. E, Heatmap showing pair-wise distribution density ratio of the UMAP projections of diagnosis and healthy Myeloid cells. F, Boxplot showing fraction of Myeloid clusters in the Myeloid fraction of individual patients. Wilcoxon rank-sum test performed to measure differences in representation between healthy (H) and diagnosis (D) groups, with p value indicated on plots. Horizontal lines in the boxplots represent the median, the lower and upper hinges correspond to the first and third quartiles, and the whiskers extend from the hinge up to 1.5 times the interquartile range from the hinge. G, Diffusion map of Myeloid cells, highlighting putative cluster cell type identity. H, GSVA gene set enrichment scores of myeloid cluster expression profiles based on established human blood monocyte and dendritic cell gene signatures (Villani et al., 2017). I. Heatmap of select differentially-expressed genes (based on KEGG pathways for leukocyte migration, chemotaxis, cytokines, antigen processing) distinguishing diagnosis and healthy non-classical monocytes (HD-M5).
Figure 3.
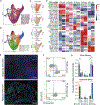
Figure 3.. Bone Marrow Immune B-ALL Microenvironment Throughout Conventional Chemotherapy.
A, UMAP visualization of 97,456 individual cells from seven individual B-ALL patients with matched diagnosis and relapse bone marrow samples-ETV6/RUNX1 B-ALL (ETV, n = 5) and Ph+ B-ALL (PH, n = 2)-as well as matched remission samples in all patients except ETV001. B, Marker-based cell type identification of six broad immune cell types across all profiled cells. C, Six transcriptionally-distinct Myeloid cell clusters overlaid on the UMAP representation. Cluster abbreviations, for example, DRR-M1 is based on Diagnosis/Remission/Relapse Myeloid cluster L D, Gene expression heatmap of top Myeloid cluster-specific marker genes. E, Expression levels of CD14, CSF1R, FCGR3A, CD1C, CDKN1C and FLT3 in the Myeloid cells overlaid on the UMAP representation. F, Boxplot showing fraction of Myeloid clusters in the Myeloid fraction of individual patients. Wilcoxon rank-sum test performed to measure pair-wise differences in representation between diagnosis, remission and relapse groups, with p value indicated on plots. Horizontal lines in the boxplots represent the median, the lower and upper hinges correspond to the first and third quartiles, and the whiskers extend from the hinge up to 1.5 times the interquartile range from the hinge. G, Diffusion map of Myeloid cells, highlighting putative cluster cell type identity. H, GSVA gene set enrichment scores of myeloid cluster expression profiles (Villani et al., 2017). I, Heatmap of select differentially-expressed genes (based on KEGG pathways) distinguishing leukemic (diagnosis or relapse) and remission non-classical monocytes (DRR-M1).
Figure 4.
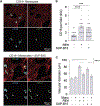
Figure 4.. Protein-based Approaches Confirms Presence of Distinct Leukemia-associated Non-classical Monocytes.
A, UMAP visualization of 10,480 individual Myeloid cells of four primary B-ALL patients with mononuclear bone marrow samples taken at diagnosis, remission and relapse B-ALL samples. B, Five transcriptionally distinct Myeloid cell clusters overlaid on the UMAP representation. C, Expression levels of CD14/CD14 and FCGR3A/CD16 across Myeloid cells overlaid on the UMAP representation, and based on mRNA and CITE-Seq antibody measurements. D, Heatmap showing select CITE-Seq antibodies and their corresponding mRNA allowing cell type subpopulation identification, scaled independently. E, Representative immunofluorescence microscopy analysis of primary bone marrow sections from independent B-ALL patients at disease diagnosis and relapse, with scale bars and fluorescent markers indicated for all sections. F, Representative flow cytometry of CD45CD19CD3CD56’ CX3CR1+ gate comparing CD 14 and CD 16 expression of primary healthy and B-ALL diagnosis bone marrow. G, Quantification of fraction of classical (CD14+CD16dim), intermediate (CD14+ CD16+) and non-classical monocytes (CD14dimCD16+) within the CD45+CD19CD3CD56 gate of bone marrow (top) and peripheral blood (bottom) of healthy donors and individual B-ALL patients at diagnosis or relapse. Diagnosis and relapse samples are not matched, and relapse samples were not analyzed for peripheral blood. Gating strategy adapted from (Cassetta et al., 2019). Statistical analysis performed using unpaired t-test. Error bars represent mean ± SEM, *P< 0.05, ***P< 0.001.
Figure 5.
Figure 5.. Non-classical Monocyte Abundance Predicts Inferior Overall Survival in Pediatric B-ALL Cases.
A-B, Kaplan-Meier analysis of newly-diagnosed pediatric B-ALL patient (A) overall survival (OS) and (B) relapse-free survival (RFS). Patients were separated on the basis of absolute monocytosis at disease presentation, with two cohorts absolute monocyte counts (AMC) >1000 cells/μL and AMC ≤ 1000 cells/μL. Number of patients indicated (n). Log-rank tests of equality were used to compare the differences in survival rates. C-D, Kaplan-Meier analysis of adolescent/young adult (AYA) human B-ALL patient (C) overall survival and (D) relapse-free survival with cohorts separated by monocyte enrichment within the bulk RNA-Seq of individual patients from St. Jude Children’s Research Hospital and COG trials (Gu et al., 2019). Monocyte High patients represent the upper-quartile of monocyte scores, and Monocyte Low represents the lower-quartile. Number of patients indicated (n).
Figure 6.
Figure 6.. B-ALL Enhances Human Non-classical Monocyte Emergence Ex Vivo.
A, Confocal microscopy of vascular endothelium (CD31) and monocyte markers (CD14 and CD16) from 3D organotypic devices seeded with HUVEC and human CD14+ Monocytes ex vivo, and either with or without seeding of human Ph-like B-ALL cell line, SUP-B15. B, Quantification of CD16-expressing cells in monocyte-seeded devices, and C, vascular endothelial diameter under different co-culture conditions described. Indicated p value derived from one-way ANOVA test. Error bars represent mean ± SEM, ****p. <0.0001.
Figure 7.
Figure 7.. Leukemia-associated Monocyte Targeting Enhances TKI Responsiveness In Vivo.
A, Marker-based cell type identification analysis allowed prediction of six broad murine immune cell types across 27,162 profiled single cells from both bone marrow and peripheral blood of leukemia-bearing B-ALL recipients and healthy littermates. B, Heatmap of select differentially-expressed genes (based on KEGG pathways) distinguishing B-ALL recipient and healthy littermate non-classical monocytes. C, Csf1r mRNA expression overlaid on UMAP representation split into bone marrow or peripheral blood, and healthy or B-ALL conditions. D, Kaplan-Meier analysis of Ph+GFP+ B-ALL transplant recipient survival following TKI and mAb treatment. Treatment regimen and number of recipients per condition are indicated. Three primary B-ALL were each transplanted into n > 4 recipient mice per condition. *P< 0.05, ****p < 0.0001, log-rank test.

References

    1. Alva JA, Zovein AC, Monvoisin A, Murphy T, Salazar A, Harvey NL, Carmeliet P, and Iruela-Arispe ML (2006). VE-Cadherin-Cre-recombinase transgenic mouse: a tool for lineage analysis and gene deletion in endothelial cells. Dev Dyn 235, 759–767. - PubMed
    1. Andersson AK, Ma J, Wang J, Chen X, Gedman AL, Dang J, Nakitandwe J, Holmfeldt L, Parker M, Easton J, et al. (2015). The landscape of somatic mutations in infant MLL-rearranged acute lymphoblastic leukemias. Nat Genet 47, 330–337. - PMC - PubMed
    1. Angerer P, Haghverdi L, Büttner M, Theis FJ, Marr C, and Buettner F. (2016). destiny: diffusion maps for large-scale single-cell data in R. Bioinformatics 32, 1241–1243. - PubMed
    1. Aran D, Looney AP, Liu L, Wu E, Fong V, Hsu A, Chak S, Naikawadi RP, Wolters PJ, Abate AR, et al. (2019). Reference-based analysis of lung single-cell sequencing reveals a transitional profibrotic macrophage. Nat Immunol 20, 163–172. - PMC - PubMed
    1. Azizi E, Carr AJ, Plitas G, Cornish AE, Konopacki C, Prabhakaran S, Nainys J, Wu K, Kiseliovas V, Setty M, et al. (2018). Single-Cell Map of Diverse Immune Phenotypes in the Breast Tumor Microenvironment. Cell 174, 1293–1308 el236. - PMC - PubMed

Publication types

MeSH terms