. 2020 Jul 13;38(1):97-114.e7.
doi: 10.1016/j.ccell.2020.04.016. Epub 2020 May 28.

MAX Functions as a Tumor Suppressor and Rewires Metabolism in Small Cell Lung Cancer

Affiliations

MAX Functions as a Tumor Suppressor and Rewires Metabolism in Small Cell Lung Cancer

Arnaud Augert et al. Cancer Cell. .

Abstract

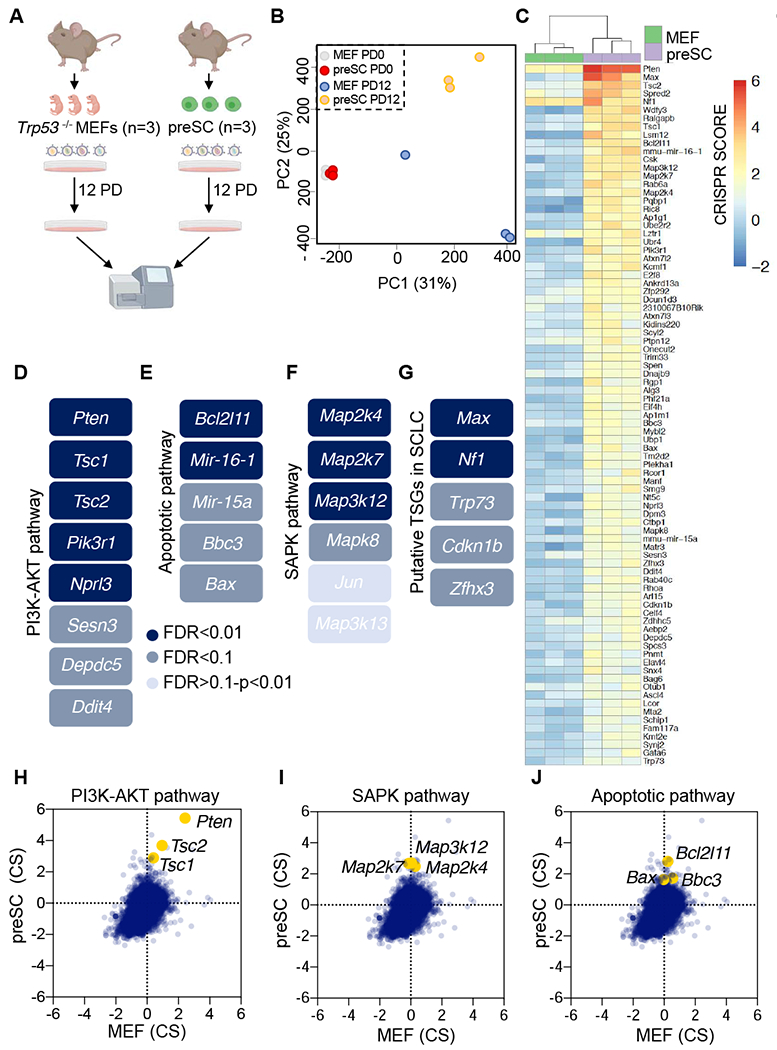
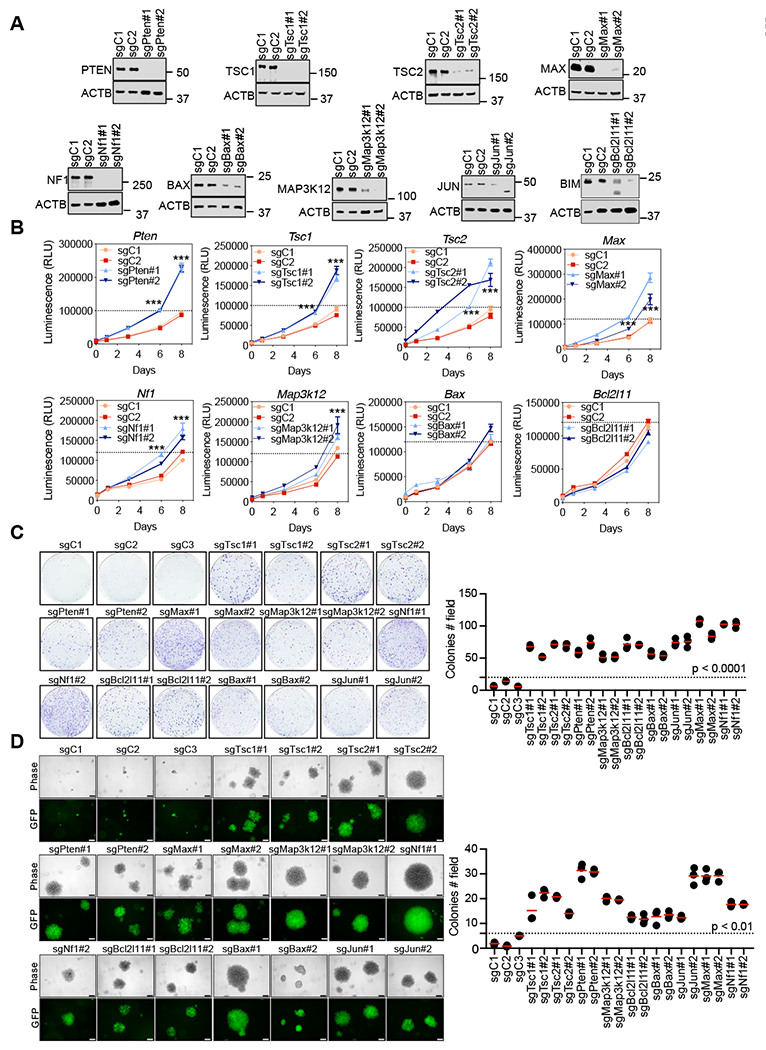
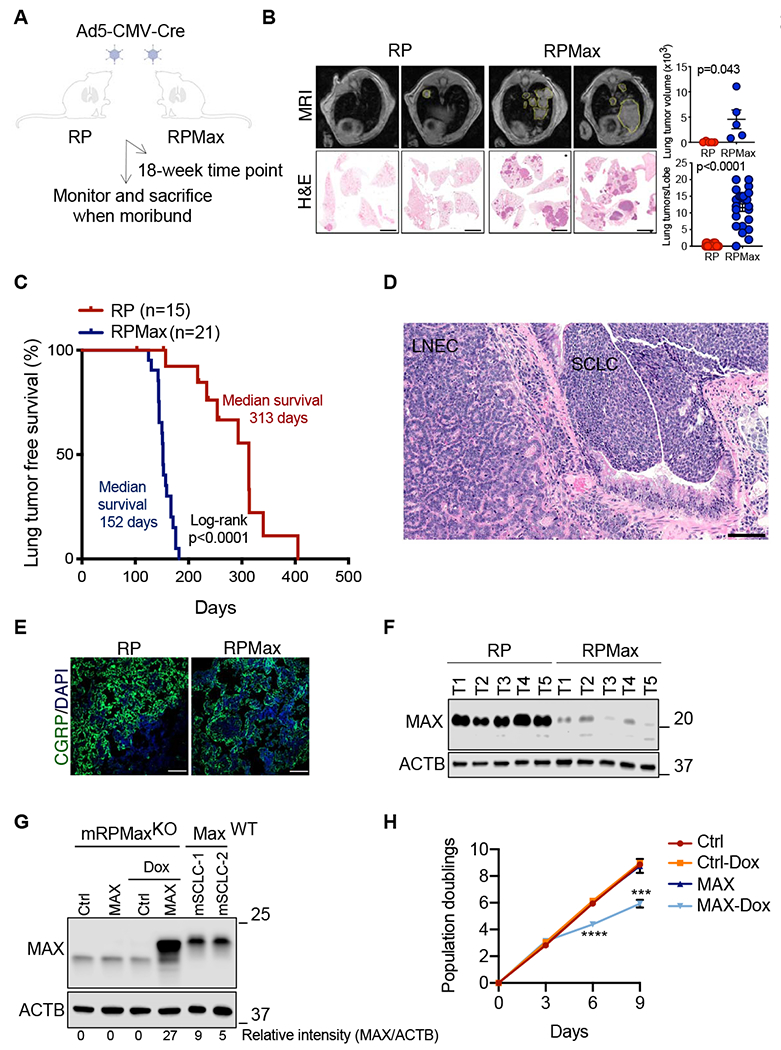
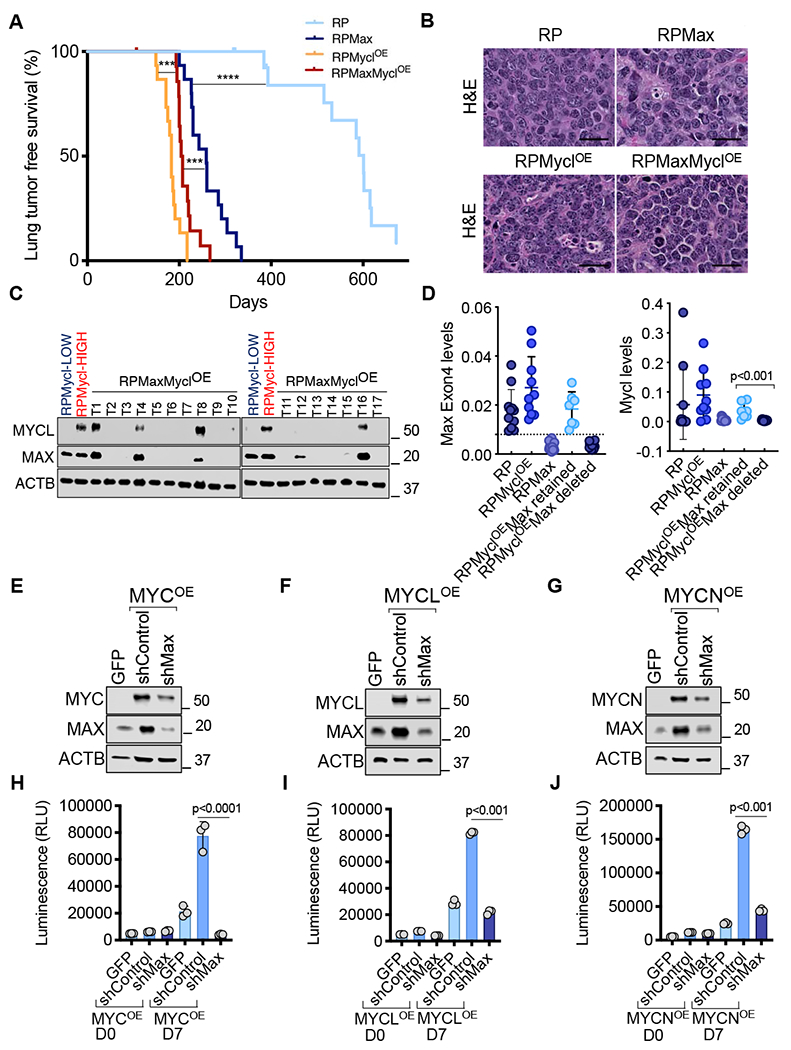
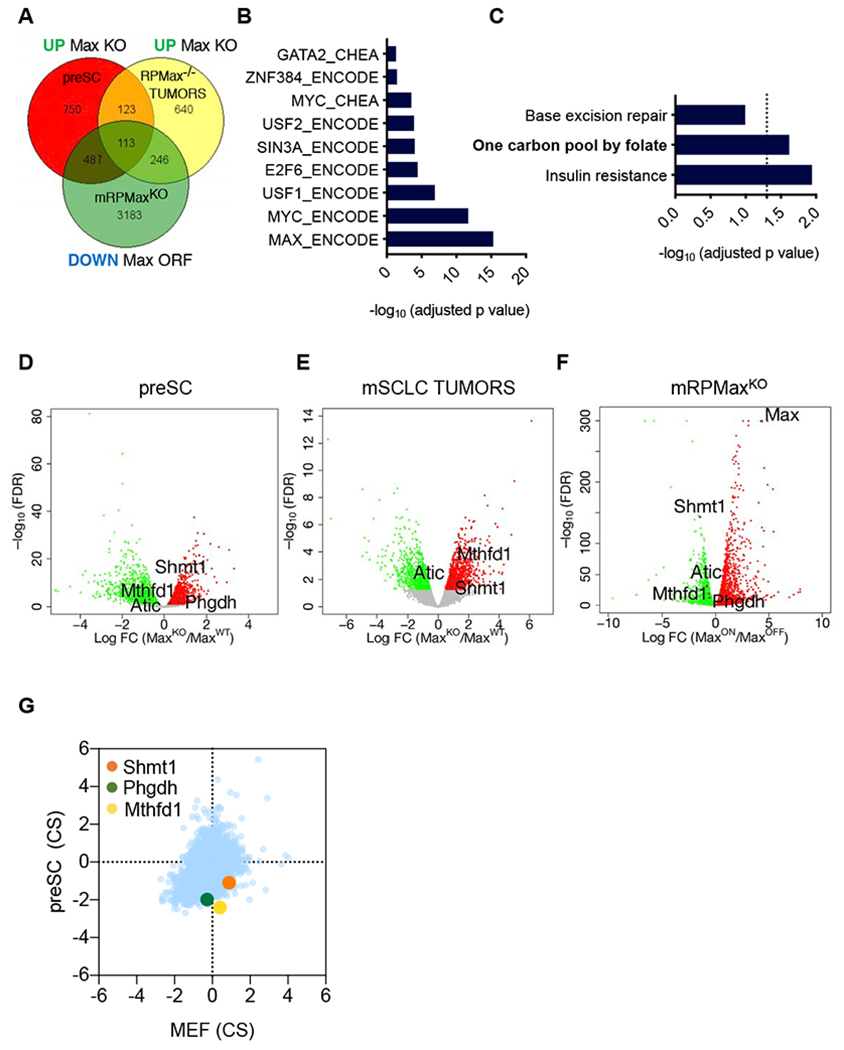
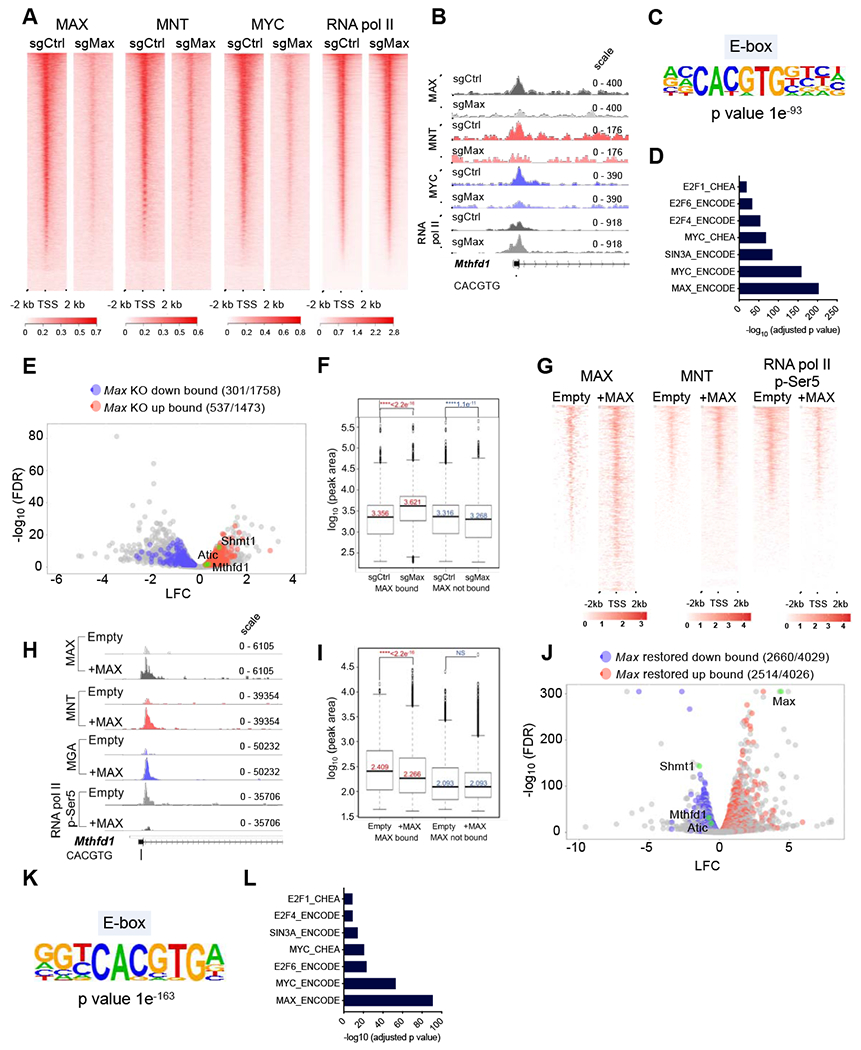
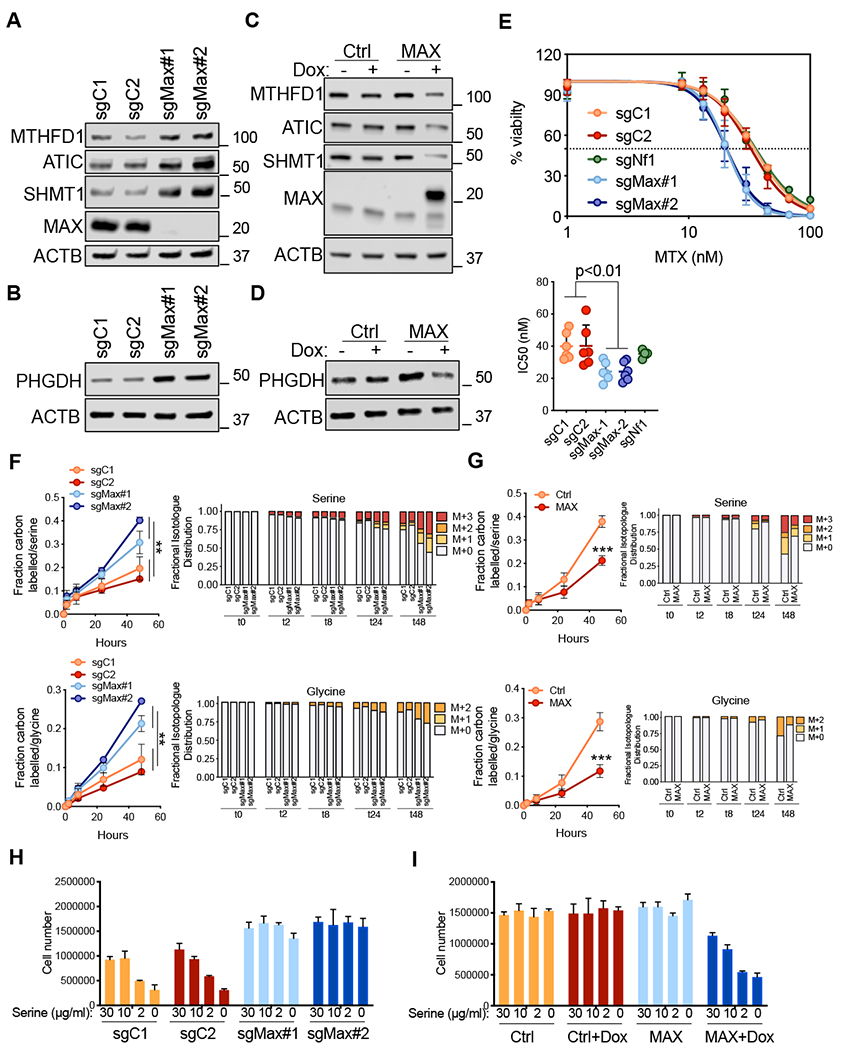
Small cell lung cancer (SCLC) is a highly aggressive and lethal neoplasm. To identify candidate tumor suppressors we applied CRISPR/Cas9 gene inactivation screens to a cellular model of early-stage SCLC. Among the top hits was MAX, the obligate heterodimerization partner for MYC family proteins that is mutated in human SCLC. Max deletion increases growth and transformation in cells and dramatically accelerates SCLC progression in an Rb1/Trp53-deleted mouse model. In contrast, deletion of Max abrogates tumorigenesis in MYCL-overexpressing SCLC. Max deletion in SCLC resulted in derepression of metabolic genes involved in serine and one-carbon metabolism. By increasing serine biosynthesis, Max-deleted cells exhibit resistance to serine depletion. Thus, Max loss results in metabolic rewiring and context-specific tumor suppression.

Keywords: CRISPR-Cas9 genetic screens; MAX; MYC; SCLC; Transcriptional regulation; cancer; mouse model; serine and one-carbon metabolism; small cell lung cancer; tumor suppressor genes.


Conflict of interest statement

Declaration of Interests R.N.E. is a member of the Scientific Advisory Boards of Kronos Bio, Inc., and Shenogen Beijing.

Figures

Figure 1
Figure 1. A whole genome CRISPR screen identifies candidate SCLC tumor suppressor genes and pathways
A, Schematic of CRISPR screening strategy. B, Principal component analysis (PCA) of the individual libraries generated from each replicate (PD0 and PD12) for MEFs and preSCs. C, Heat map of the top screen hits (MAGeCK FDR<0.1) enriched in preSCs as compared to MEFs. CRISPR scores are shown. D-G, Schematic of the PI3K-AKT pathway (D), the apoptotic pathway (E), the SAPK pathway (F) and putative tumor suppressor genes (G) identified in preSCs. FDR values are indicated and color coded. H-J, Scatter plot using CRISPR scores for the selected genes in the PI3K-AKT pathway (H), SAPK pathway (I) and the apoptotic pathway (J). For D-G, FDR values were calculated using MAGeCK VISPR. See also Figures S1 and S2 and Tables S1 and S2.
Figure 2
Figure 2. Validation of candidate tumor suppressor genes in SCLC
A, Immunoblotting results following lentiviral sgRNA expression for the indicated genes in preSCs. ACTB was used as a loading control. B, CellTiter-Glo viability assay for the indicated genes. Two sgRNAs were used for each gene. Representative experiments from at least 2 independent experiments are shown. Error bars represent mean ± SD (n=3) ***p<0.001, unpaired Student’s t test. RLU, relative luminescence units. C, Colony formation assays by crystal violet staining after 2 weeks expansion of cells (6 well plates) were performed for the indicated genes. The number of colonies per field were counted. Error bars represent the mean (n= 3 independent experiments), p<0.0001, unpaired Student’s t test. D, Anchorage-independent assay upon the inactivation for the genes of interest in soft agar. n = 3 independent experiments. Error bars represent mean ± SD, p<0.01, unpaired Student’s t test. Scale bar: 100 μM.
Figure 3
Figure 3. Max inactivation accelerates SCLC
A, Schematic of the strategy to follow effects of Max deletion in a mouse model of SCLC. B, Magnetic resonance imaging (MRI) and Hematoxylin and Eosin (H&E) stains for the indicated genotypes 18 weeks post Ad5-CMV-Cre infections. Representative images of mice are shown. Error bars represent mean ± SD (n=5 mice per genotype). Unpaired Student’s t test was performed and p values are shown. Scale bar: 2 mm. C, Kaplan-Meier tumor-free survival curves of Rb1/Trp53 mutant (red, n=15) and Rb1/Trp53/Max mutant (blue, n=21) mice from autochthonous model infected with Ad5-CMV-Cre (Day 0). Statistical significance for the overall survival of the cohorts was calculated using log-rank (Mantel-Cox) test. D, Representative H&E stained section of SCLC and LNEC from the Rb1/Trp53/Max cohort. Scale bar: 100 mM. E, Representative immunofluorescence for the SCLC marker CGRP in each cohort (Rb1/Trp53 vs. Rb1/Trp53/Max). DAPI was used as a nuclear stain. Scale bar: 50 mM. F, Representative immunoblotting results of MAX protein levels in 5 lung tumor tissues from each cohort (Rb1/Trp53 vs. Rb1/Trp53/Max). ACTB was used as a loading control. G, Representative immunoblotting of MAX protein levels upon doxycycline-inducible Max restoration in a mRPMaxKO (Rb1/Trp53/Max-deleted) mSCLC cell line. ACTB was used as a loading control and two RP mSCLCs expressing endogenous MAX levels were used as internal controls. Protein levels were quantified using the LI-COR software. H, Growth curve analysis of a mRPMaxKO cells upon Max restoration at the indicated times following doxycycline addition. Error bars represent mean ± SD (n=3 independent experiments). ***, p<0.005; ****, p<0.0001, unpaired Student’s t test. See also Figure S3.
Figure 4
Figure 4. MAX is required for SCLC that is driven by MYC family members
A, Kaplan-Meier tumor-free survival of RP (n=15), RPMax (n=15), RPMyc1OE (n=15) and RPMaxMyc1OE cohorts (n=15) from autochthonous model infected with Ad-CGRP-Cre (Day 0). Statistical significance for the overall survival of the different cohorts was calculated using log-rank (Mantel-Cox) test. ***, p<0.001; ****p<0.0001. B, Representative H&E stained section of SCLC for the indicated cohorts. Scale bar: 50 μM. C, Immunoblotting of MYC and MAX protein levels. ACTB was used as a loading control. D, Quantitative PCR analyses of Max (Exon 4) and Mycl levels relative to Gapdh as a loading control. Error bars represent mean ± SD (n≥7 tumors per group). Unpaired Student’s t test was used. E-G, Immunoblotting of MYC (E), MYCL (F), MYCN (G) and MAX protein levels upon Max knockdown in MYC (E), MYCL (F) and MYCN (G) over-expressing preSCs. ACTB was used as a loading control. H-J, CellTiter-Glo viability assay upon Max knockdown in MYC (H), MYCL (I) and MYCN (J) overexpressing preSCs. Error bars represent mean ± SD (n=3 independent experiments); p values are indicated, unpaired Student’s t test. RLU, relative luminescence units. See also Figure S4.
Figure 5
Figure 5. Transcriptional analyses of MAX altered SCLCs
A, Venn diagram of the upregulated genes upon Max loss in preSCs and mSCLCs tumors and downregulated upon Max restoration in the mRPMaxKO Max-null mSCLC line. The list of genes used to generate the Venn diagram were selected from EdgeR analysis with a cut off of FDR<0.05. B, ENCODE or CHEA binding analysis for the 113 significant genes from (A) shared across the 3 models, upregulated upon Max loss and downregulated upon Max restoration. An adjusted p value of p<0.05 was considered significant. C, KEGG pathway analysis for the 113 genes from (A) shared across the 3 models, upregulated upon Max loss and downregulated upon Max restoration. An adjusted p value of p<0.05 was considered significant. D-F, Volcano plots from the Max-KO vs Max-WT preSC cell comparison (D), Max deleted vs Max control mSCLC tumors (E) and inducible MAX restoration in mRPMaxKO cell line (F) are shown. Significant genes upregulated upon Max perturbation are in red or downregulated in green. An FDR<0.05 was considered significant. Individual genes of interest are depicted. G, CRISPR score plot of the metabolic hits of interest showing increased depletion of guide RNAs targeting these genes in preSCs as compared to MEFs following 12 population doublings. See also Figure S5.
Figure 6
Figure 6. Genomic occupancy of MAX altered SCLC
A, Heat maps depicting promoter enrichment (+/− 2 kb of TSS) of MAX, MNT, MYC and RNA pol II in control and Max-deleted preSCs. B, Representative tracks for MAX, MNT, MYC and pol II binding at the Mthfd1 promoter in preSCs. C, Enriched de novo motifs from HOMER analysis on MAX-bound sequences in preSCs. D, ENCODE and CHEA analysis on MAX-bound genes in preSCs. E, Volcano plot depicting overlap between expression and genomic occupancy analyses (one carbon genes highlighted in green). F, Box plots of RNA pol II occupancy at TSS +/− 2 kb at MAX bound vs. non-bound genes in Max-null and control preSCs. Box boundaries indicate 1st and 3rd quartiles, whiskers represent 1.5 times the interquartile range, and dots indicate datapoints that fall outside that region. Genes considered MAX-bound if peak occurred −5 kb to TSS. p values computed using Wilcox test (p < 0.01 considered significant). G, Heatmap of MAX, MNT and RNA pol II phospho-Ser5 binding in Max-null and MAX restored mRPMaxKO SCLC cells. H, Representative peaks for MAX, MNT, MGA and pol II phospho-Ser5 binding at the Mthfd1 promoter in mRPMaxKO SCLC cells. I, Box plots depicting RNA pol II phospho-Ser5 occupancy levels at MAX bound vs. unbound genes in MAX restored and Max-null mRPMaxKO SCLC cells. Box boundaries mark 1st and 3rd quartiles, whiskers indicate 1.5 times the interquartile range, and dots represent data points that fall outside that region. Genes considered MAX-bound if peak occurs at TSS to −5 kb. p values computed using Wilcox test. J, Volcano plot showing overlap between expression and CUT&RUN analyses in MAX restored mRPMaxKO cells (one carbon genes and Max highlighted in green). K, HOMER analysis showing significant de novo motifs identified from MAX bound sequences in mRPMaxKO SCLC cells. L, ENCODE and CHEA analysis on MAX bound genes in MAX restored mRPMaxKO cells. See also Figure S6.
Figure 7
Figure 7. Max deletion results in increased serine and one carbon metabolism
A and B, Immunoblotting for MTHFD1, SHMT1, ATIC (A) and PHGDH (B) proteins upon Max loss in preSCs. ACTB was used as a loading control. C and D, Immunoblotting for MTHFD1, SHMT1, ATIC (C) and PHGDH (D) upon MAX restoration in mRPMaxKO cells. ACTB was used as a loading control. E, Dose-response curves of preSCs treated with methotrexate for 96 h. Viability was assessed with the CellTiter-Glo assay and calculated relative to the vehicle control. Data are mean ± SEM from at least n = 3 biological replicates. IC50s are shown for each genotype and each single data point represents an independent experiment. ** p<0.01, unpaired student’s t-test. F, U-13C glucose tracing experiments in preSCs upon Max loss followed across the indicated time points. Fraction carbon labelled and isotopologues for both serine and glycine are shown. ** p<0.01, unpaired student’s t-test. G, U-13C glucose tracing experiments in mRPMaxKO cell upon MAX restoration followed across the indicated time points. Fraction carbon labelled and isotopologues for both serine and glycine are shown. *** p<0.001, unpaired student’s t-test. H-I, Growth in serine depleted media for preSCs upon Max loss (H) and for mRPMaxKO upon MAX restoration (I). Error bars represent mean ± SD (n=3). See also Figure S7.

References

    1. Amati B, Brooks MW, Levy N, Littlewood TD, Evan GI, and Land H (1993). Oncogenic activity of the c-Myc protein requires dimerization with Max. Cell 72, 233–245. - PubMed
    1. Anders S, Pyl PT, and Huber W (2015). HTSeq--a Python framework to work with high-throughput sequencing data. Bioinformatics 31, 166–169. - PMC - PubMed
    1. Augert A, Zhang Q, Bates B, Cui M, Wang X, Wildey G, Dowlati A, and MacPherson D (2017). Small Cell Lung Cancer Exhibits Frequent Inactivating Mutations in the Histone Methyltransferase KMT2D/MLL2: CALGB 151111 (Alliance). J Thorac Oncol 12, 704–713. - PMC - PubMed
    1. Ayer DE, Lawrence QA, and Eisenman RN (1995). Mad-Max transcriptional repression is mediated by ternary complex formation with mammalian homologs of yeast repressor Sin3. Cell 80, 767–776. - PubMed
    1. Bar-Peled L, Chantranupong L, Cherniack AD, Chen WW, Ottina KA, Grabiner BC, Spear ED, Carter SL, Meyerson M, and Sabatini DM (2013). A Tumor suppressor complex with GAP activity for the Rag GTPases that signal amino acid sufficiency to mTORC1. Science 340, 1100–1106. - PMC - PubMed

Publication types

MeSH terms

Substances