. 2020 Jun 25;181(7):1643-1660.e17.
doi: 10.1016/j.cell.2020.05.007. Epub 2020 May 28.

Interrogation of the Microenvironmental Landscape in Brain Tumors Reveals Disease-Specific Alterations of Immune Cells

Affiliations

Interrogation of the Microenvironmental Landscape in Brain Tumors Reveals Disease-Specific Alterations of Immune Cells

Florian Klemm et al. Cell. .

Abstract

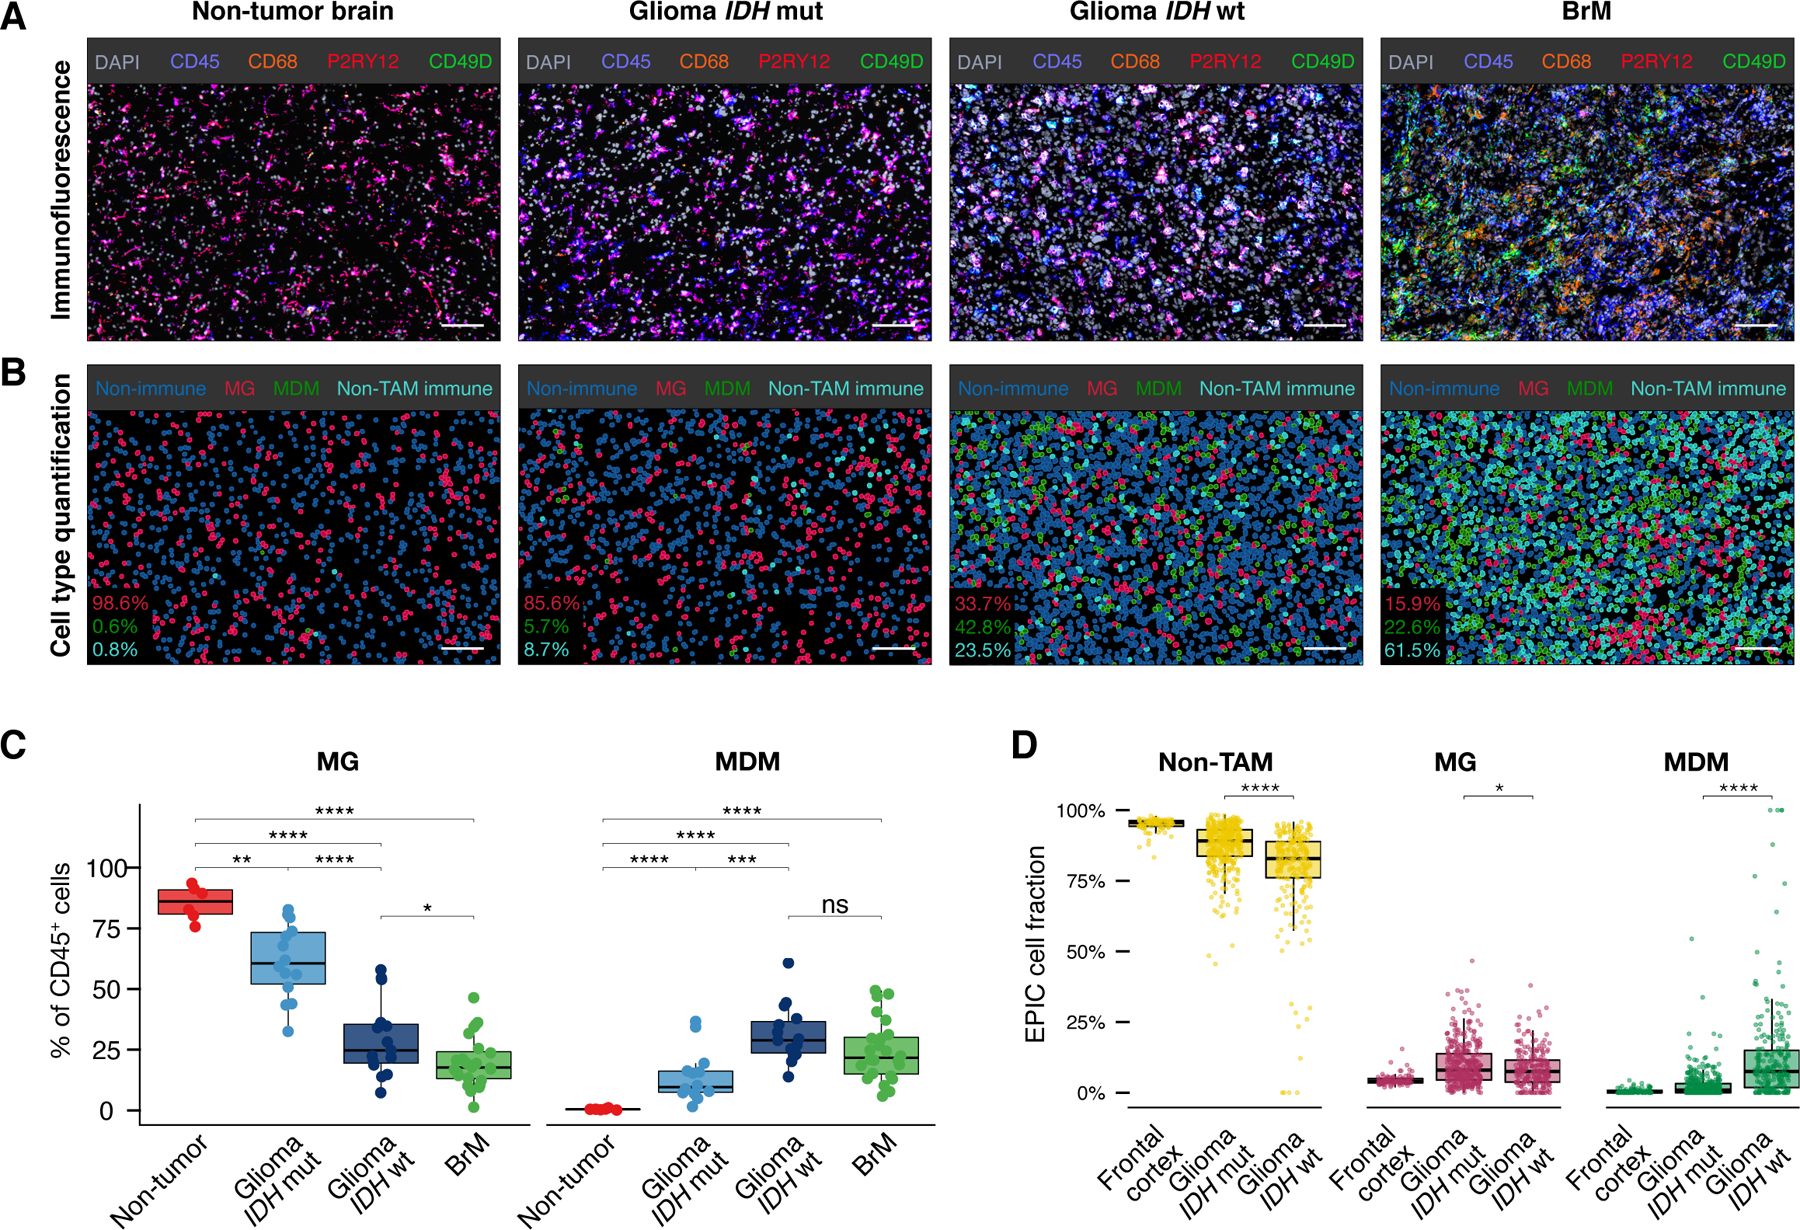
Brain malignancies encompass a range of primary and metastatic cancers, including low-grade and high-grade gliomas and brain metastases (BrMs) originating from diverse extracranial tumors. Our understanding of the brain tumor microenvironment (TME) remains limited, and it is unknown whether it is sculpted differentially by primary versus metastatic disease. We therefore comprehensively analyzed the brain TME landscape via flow cytometry, RNA sequencing, protein arrays, culture assays, and spatial tissue characterization. This revealed disease-specific enrichment of immune cells with pronounced differences in proportional abundance of tissue-resident microglia, infiltrating monocyte-derived macrophages, neutrophils, and T cells. These integrated analyses also uncovered multifaceted immune cell activation within brain malignancies entailing converging transcriptional trajectories while maintaining disease- and cell-type-specific programs. Given the interest in developing TME-targeted therapies for brain malignancies, this comprehensive resource of the immune landscape offers insights into possible strategies to overcome tumor-supporting TME properties and instead harness the TME to fight cancer.

Keywords: T cells; brain metastasis; cancer immunology; glioblastoma; glioma; microglia; monocyte-derived macrophages; neutrophils; tumor microenvironment; tumor-associated macrophages.


Conflict of interest statement

Declaration of Interests The authors declare no competing interests.

Figures

Figure 1.
Figure 1.. The immune cell composition of brain malignancies.
(A) Quantification of immunofluorescence (IF) staining of non-immune (CD45−) and immune cells (CD45+) in sections of non-tumor brain tissue (n=6), gliomas (nIDHmut=16, nIDHwt=16), and brain metastases (BrM, nbreast=12, nlung=5, nmelanoma=7). (B) Flow cytometry (FCM) quantification of non-immune cells (CD45−), myeloid cells (CD45+, CD11B+) and lymphocytes (CD45+, CD11B−) in non-tumor tissue (n=6), gliomas (nIDHmut=17, nIDHwt=40) and BrM (nbreast=13, nlung=16, nmelanoma=8). (C) Gene set variation analysis (GSVA) normalized enrichment score (NES) of MG and MDM ontogeny-specific core gene signatures in CD49Dlow MG and CD49Dhigh MDM from non-tumor and tumor tissues. (D) Heatmap of immune cell proportions in relation to all CD45+ cells (MG=microglia, MDM=monocyte-derived macrophages, CD14low/CD16+=CD14low/CD16+ monocytes, CD14+/CD16+=CD14+/CD16+ monocytes, CD16− Gran.=CD16− granulocytes, iMC=immature myeloid cells, DC=dendritic cells, Treg=regulatory T cells, DNT=double negative T cells) across the cohort (nnon-tumor=6, nglioma=57, nBrM=37). Cluster assignment, disease type, IDH mutation status, and BrM primary tumor annotated per column (clinical information, Table S1). (E) Principal component (PC) biplot of FCM data with sample scores and top 5 loadings of the first two PCs (n=100 clinical samples, proportion of variance shown on PC axes). (F) Mean of immune cell populations in non-tumor tissue (n=6), gliomas (nIDHmut=17, nIDHwt=40), and BrMs (nbreast=13, nlung=16, nmelanoma=8) as percentage of CD45+ cells. See also Figure S1 and Table S1 and S2.
Figure 2.
Figure 2.. Analysis of MG and MDM abundance.
(A) Representative IF images and (B) corresponding cell type identification of MG (CD45+, P2RY12+/CD68+, CD49D−), MDM (CD45+, P2RY12+/CD68+, CD49D+), non-immune (CD45−) and non-TAM-immune cells (CD45+, P2RY12−/CD68−, CD49D−/+) in non-tumor brain tissue, IDH mut, IDH wt gliomas and BrMs. Scale bars = 100µm, insets show quantification per field of view (FOV). (C) IF quantification of MG and MDM abundance in non-tumor brain tissue (n=6), IDH mut (n=16), IDH wt (n=16) gliomas, and BrMs (n=24). (D) EPIC deconvolution of merged GTEX and TCGA glioma datasets showing relative abundance of MG, MDM and non-TAMs (“other cells”) in healthy frontal cortex, IDH mut and IDH wt gliomas. Wilcoxon rank-sum test used for statistical analysis: *p < 0.05, **p < 0.01, ***p < 0.001, ****p < 0.0001. See also Figure S2.
Figure 3.
Figure 3.. MG and MDM exhibit a multifaceted polarization phenotype in brain malignancies.
(A) PC biplot of MG and MDM transcriptome data from non-tumor brain tissue, IDH mut and IDH wt gliomas, and BrMs (clinical information, Table S3A, reference = in vitro generated MDMs, proportion of variance shown on PC axes). (B) Visualization of intersects of the conserved sets of significantly upregulated genes in MG and MDM. Intersects between sets are shown in the combination matrix. ngenes found uniquely in a gene set or intersect indicated above individual bars. (C) Stimulus-specific macrophage gene expression modules overrepresented (within conserved differentially expressed genes (DEGs) vs. respective references) in tumor associated-MG (T-MG) and -MDM (T-MDM). Bar heights and color indicate significance level. (GC = glucocorticoid, IFNγ = interferon gamma, LA = lauric acid, LiA = linoleic acid, OA = oleic acid, PA = palmitic acid, PGE2 = prostaglandin E2, sLPS = standard lipopolysaccharide, TNFα = tumor necrosis factor alpha, TPP = TNFα+PGE2+Pam3CysSerLys4, IL10 = interleukin 10). (D) Heatmap of gene ontology overrepresentation analysis of leading edge metagenes (LEM) in MG and MDM from gliomas and BrMs. Tile fill indicates significance (hypergeometric test,-log10(adjusted p value), terms were filtered by significance). (E) IF quantification of proportion of proliferating Ki67+ MG and MDM in non-tumor tissue (n=5), IDH mut (n=10) and IDH wt gliomas (n=9) and BrMs (n=8). Means compared with one-tailed t test: *p < 0.05. (F) qRT-PCR of Type I IFN-LEM marker genes from Group 2 (see Figure S3F) in in vitro generated MDMs stimulated with the indicated tumor microenvironment culture-conditioned media (TME-CM). Fold-changes calculated relative to colony stimulating factor-1 (CSF-1)-treated MDM baseline (one-way ANOVA p value < 0.1, nMDM = 4–11). See also Figure S3 and Table S4.
Figure 4.
Figure 4.. IDH mutation status shapes TAM activation in gliomas.
(A) Number of MG and MDM per mm2 inside the perivascular niche (PVN) or distant from the PVN (non-PVN) within IDH wt gliomas by IF staining. Means compared with Wilcoxon signed-rank test: ***p < 0.001. (B) Distance of MG and MDM to nearest vessel in IDH wt gliomas (nsamples=14, nMG=88781 and nMDM=92969 cells counted). (C) Box plot of HLA-DR geometric mean fluorescence intensity measured by FCM in MG and MDM in IDH mut and IDH wt gliomas. MG and MDM from the same samples are connected by lines (nIDHmut=17, nIDHwt=39, Wilcoxon signed-rank test: ***p < 0.001, ****p < 0.0001). (D) GSVA of antigen-processing and -presentation pathways from Molecular Signatures Database (MSigDB) “Canonical Pathways” collection with significant differential enrichment between MG and MDM in IDH wt tumors, and in MG and MDM across IDH mut and IDH wt samples. Columns ordered by IDH mutation status and cell type, rows (z-score) hierarchically clustered. (E) Expression heatmap of T-MG and (F) T-MDM DEGs (compared to T-MG in IDH mut gliomas) in IDH mut and IDH wt glioma samples. Columns and rows (z-score) hierarchically clustered. (G) Normalized counts of selected genes in MG and MDM in gliomas stratified by IDH status. (H) Relative expression in CD45−, MG and MDM cells of ligands and receptors upregulated in CD45− cells in IDH wt vs. IDH mut samples and their matching counterparts. Variance-stabilized expression values were scaled to the expression range. (I) Kaplan-Meier estimator of survival in TCGA glioma cohort based on enrichment for MDM IDH wt signature assessed by GSVA in IDH mut and IDH wt gliomas from combined TCGA cohort. GSVA scores were separated into tertiles across combined IDH mut and IDH wt sample set. Pairwise p values calculated using log-rank test. (J) Hazard ratios of multivariate cox proportional hazards model with transcriptomic subtype (TCGA annotation), IDH status (TCGA annotation) and T-MDM IDH wt GSVA score as covariates for overall survival within TCGA glioma cohort (PN = proneural, NE = neural, CL = classical, and ME = mesenchymal subtype). See also Figure S4 and Table S5.
Figure 5.
Figure 5.. The immune contexture influences the tumor microenvironment on a global level.
(A) Inflammation-associated bulk tissue protein concentration heatmap, subset on 55 proteins with significantly different concentrations between non-tumor brain, gliomas and BrMs in an ANOVA (p value < 0.1, nnon-tumor=3, nglioma=14, nBrM=12, concentrations were log10 transformed and z-scored). Rows and columns are hierarchically clustered. Clinical data is annotated per row, column annotation reflects the major protein clusters (further information in Table S3B). (B) Self-organizing map (SOM) of RNA expression data of major cell populations in glioma and BrM samples. SOM-spots are highlighted, numbered with roman numerals and annotated with their cell-type association. (C) Overlap of individual proteins and SOM spot metagenes, tile color fill reflects protein cluster membership from Figure 5A. (D) RNA-seq counts (normalized, scaled to expression range) of proteins from Figure 5A across major cell types in IDH mut and IDH wt gliomas and BrMs. SOM spot membership of individual genes indicated per row. See also Figure S5.
Figure 6.
Figure 6.. Myeloid cells show distinct transcriptional changes in BrMs.
(A) Normalized counts of indicated genes in MG and MDM in non-tumor/reference, IDH wt gliomas and BrM. (B) Expression heatmap of ECM-associated genes differentially expressed between MG and MDM in BrMs. Rows z-scored and manually sorted, columns ordered by cell type. (C) Expression of indicated BrM-specific genes in neutrophils from unmatched healthy blood, IDH wt gliomas and BrMs. See also Figure S6 and Table S6.
Figure 7.
Figure 7.. TAMs exert a wide range of immunomodulatory functions in BrMs.
(A) Representative IF images and corresponding cell type identification of non-immune cells (CD45−), MG (CD45+, P2RY12/CD68+, CD49D−), MDM (CD45+, P2RY12/CD68+, CD49D+), CD3+ (CD45+, P2RY12/CD68−, CD49D−/+, CD3+) and CD45+ other cells (CD45+, P2RY12/CD68−, CD49D−/+, CD3−) in IDH wt gliomas and BrMs. Scale bars = 50µm, insets show quantifications per FOV. (B) Neighborhood analyses of IDH wt glioma and BrM IF tissue sections. Rows show mean proportion of each neighboring cell type per frequency of observed nneighbors within the vicinity of either MG or MDM (nIDHwt=9, nBrM=13). (C) Gene set enrichment analysis (GSEA) of a T cell anergy gene set in CD4+ T cells and (D) a T cell exhaustion gene set in CD8+ T cells from the MSigDB “C2” collection. (E) Gene expression heatmap of antigen presenting cell (APC) and T-cell activating and inhibitory signaling mediators (left panels, scaled to expression range of variance-stabilized counts across all cell types in IDH wt glioma and BrMs) and corresponding fold changes (right panels, BrMs vs. non-tumor/reference and IDH wt glioma vs BrMs, absolute log2(fc) > 1, p.adj < 0.05) in CD45−, MG, MDM, CD4+ and CD8+ T cells in IDH wt gliomas and BrMs. Grey tiles indicate expression below threshold (normalized counts < 10), white tiles correspond to non-significant fold change. (F) Scatter plot of module membership (correlation of expression to module eigengene) and gene significance (correlation of expression to CD4+ T cell abundance) of genes from the BrM MDM-related gene co-expression network. Highly connected genes with immunomodulatory functions are annotated. (G) Expression of indicated genes in matched bulk primary breast cancer and BrM tissues using Vareslija et al., 2019 dataset (Wilcoxon signed-rank test: ***p < 0.001, ****p < 0.0001). See also Figure S7.

Comment in

References

    1. Afik R, Zigmond E, Vugman M, Klepfish M, Shimshoni E, Pasmanik-Chor M, Shenoy A, Bassat E, Halpern Z, Geiger T, et al. (2016). Tumor macrophages are pivotal constructors of tumor collagenous matrix. J Exp Med 213, 2315–2331. - PMC - PubMed
    1. Aldape K, Brindle KM, Chesler L, Chopra R, Gajjar A, Gilbert MR, Gottardo N, Gutmann DH, Hargrave D, Holland EC, et al. (2019). Challenges to curing primary brain tumours. Nature Reviews Clinical Oncology 16, 509–520. - PMC - PubMed
    1. Baddeley AD, Eysenck MW, and Anderson MC (2015). Spatial Point Patterns: Methodology and Applications with R (London: Chapman and Hall/CRC Press; ).
    1. Barletta KE, Ley K, and Mehrad B (2012). Regulation of neutrophil function by adenosine. Arterioscler Thromb Vasc Biol 32, 856–864. - PMC - PubMed
    1. Bates D, Machler M, Bolker BM, and Walker SC (2015). Fitting Linear Mixed-Effects Models Using lme4. Journal of Statistical Software 67, 1–48.

Publication types