. 2020 May 28;181(5):1112-1130.e16.
doi: 10.1016/j.cell.2020.04.043.

Molecular Choreography of Acute Exercise

Affiliations

Molecular Choreography of Acute Exercise

Kévin Contrepois et al. Cell. .

Abstract

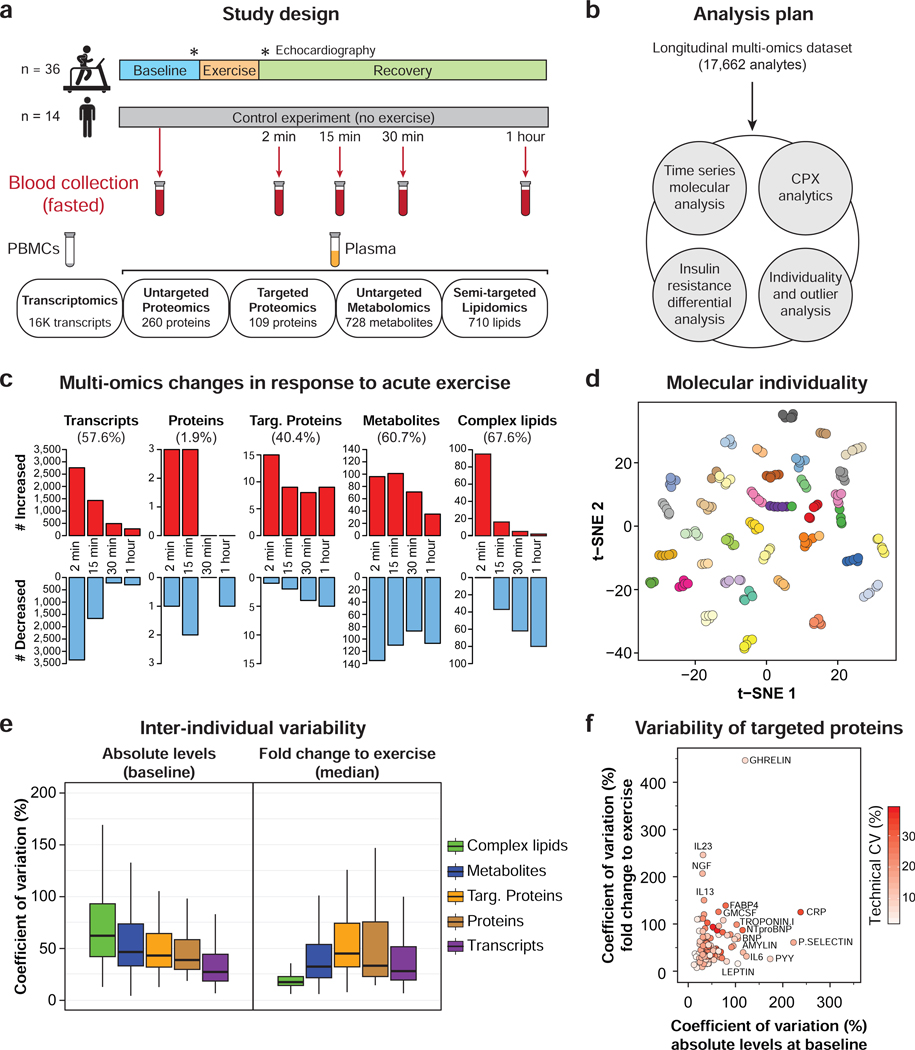
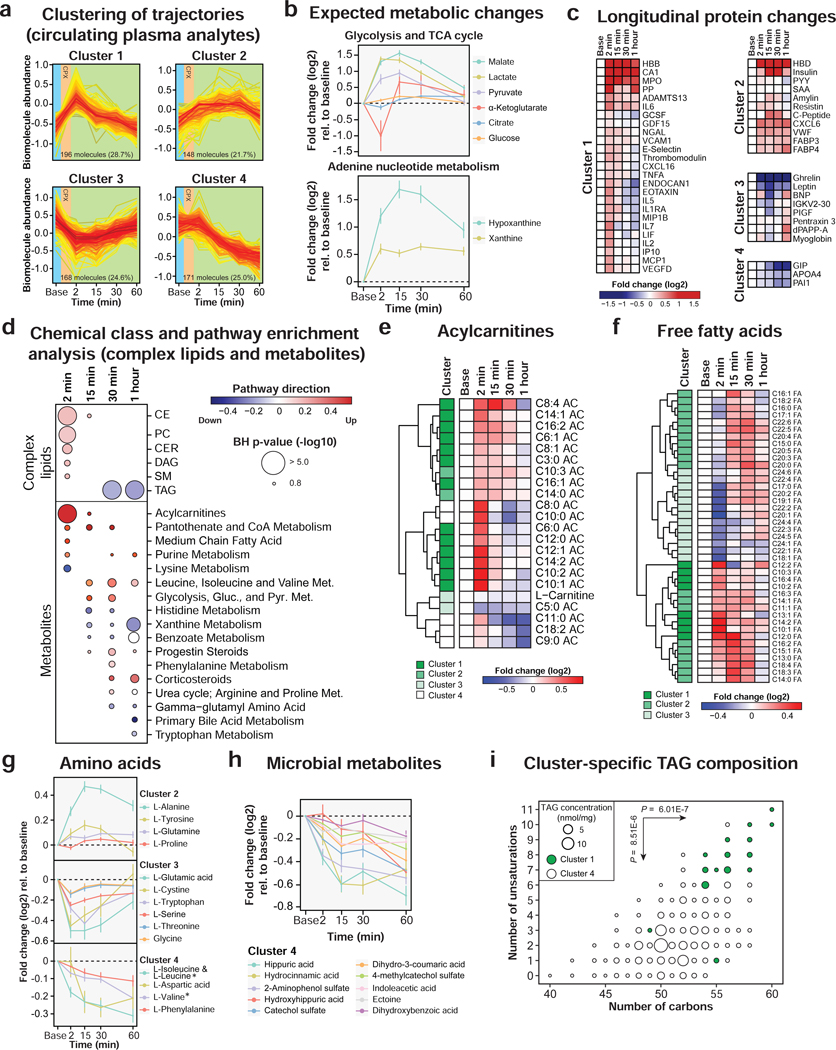
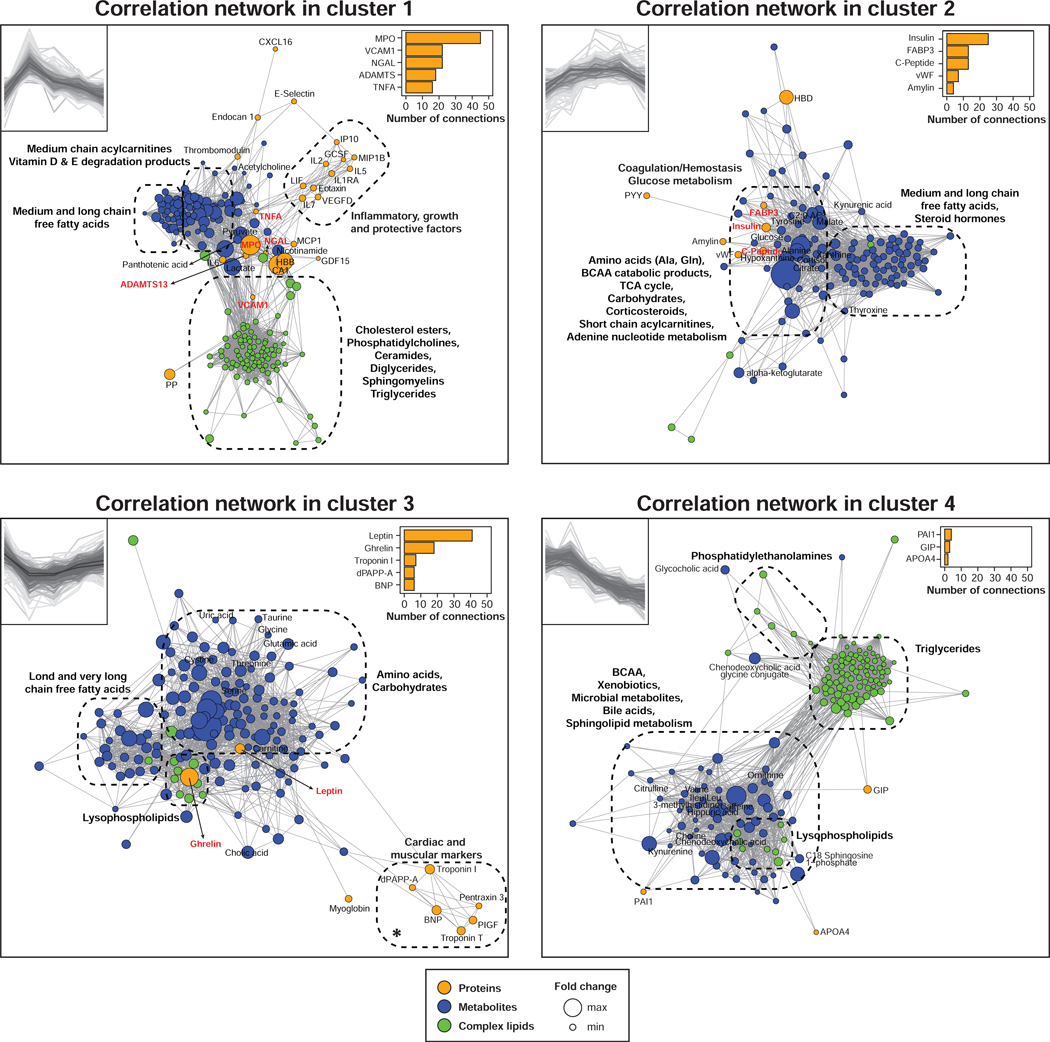
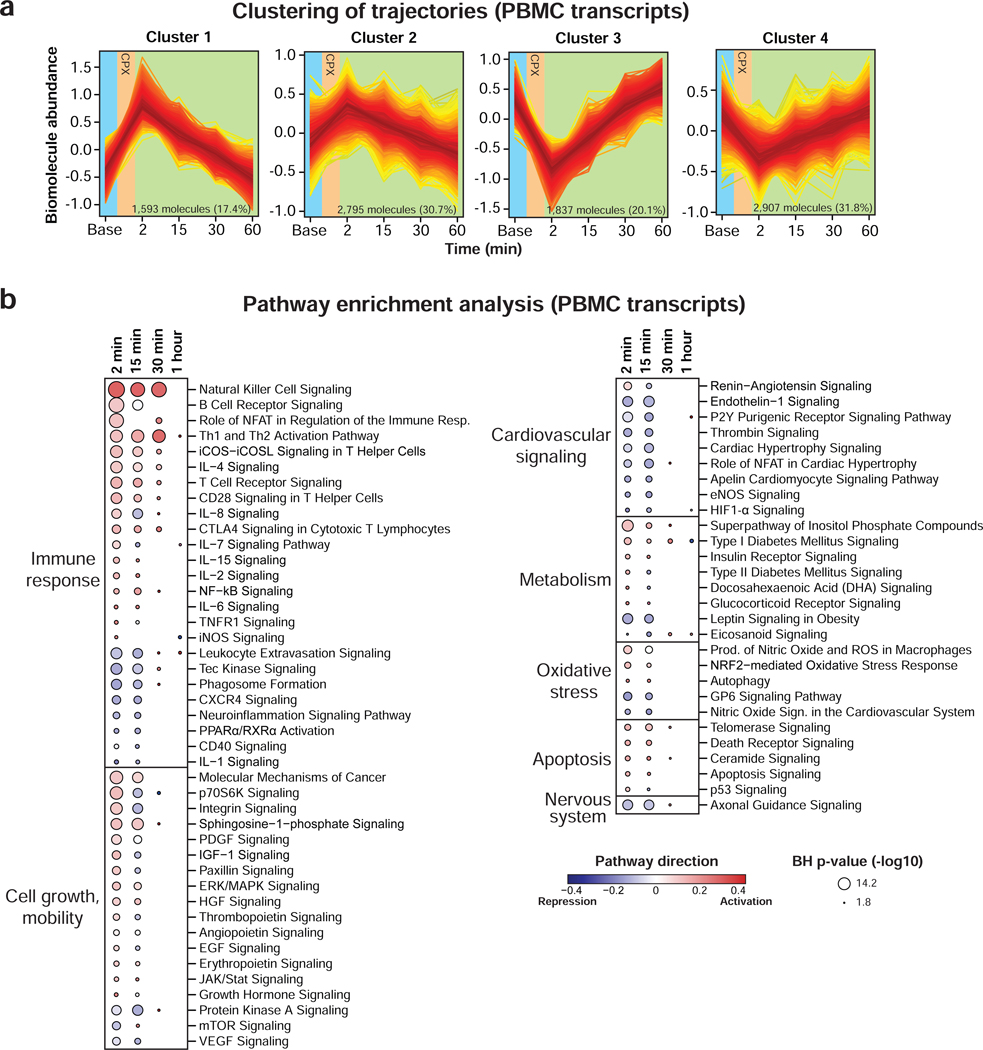
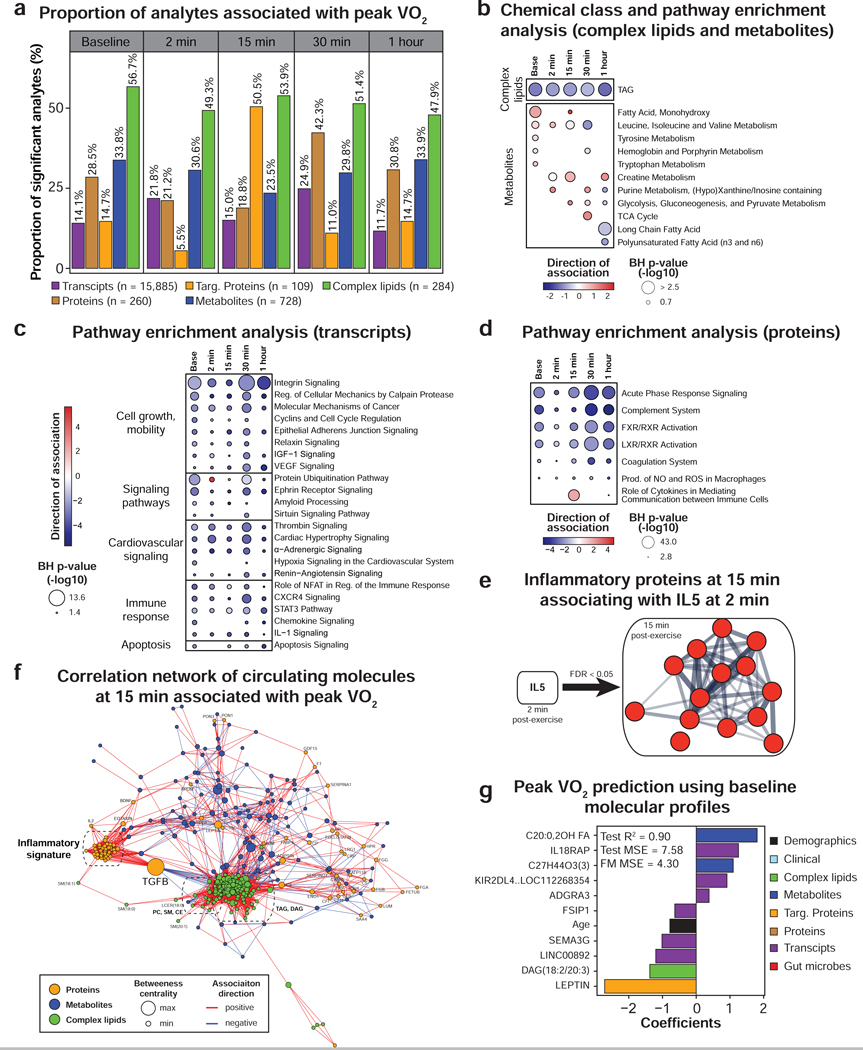
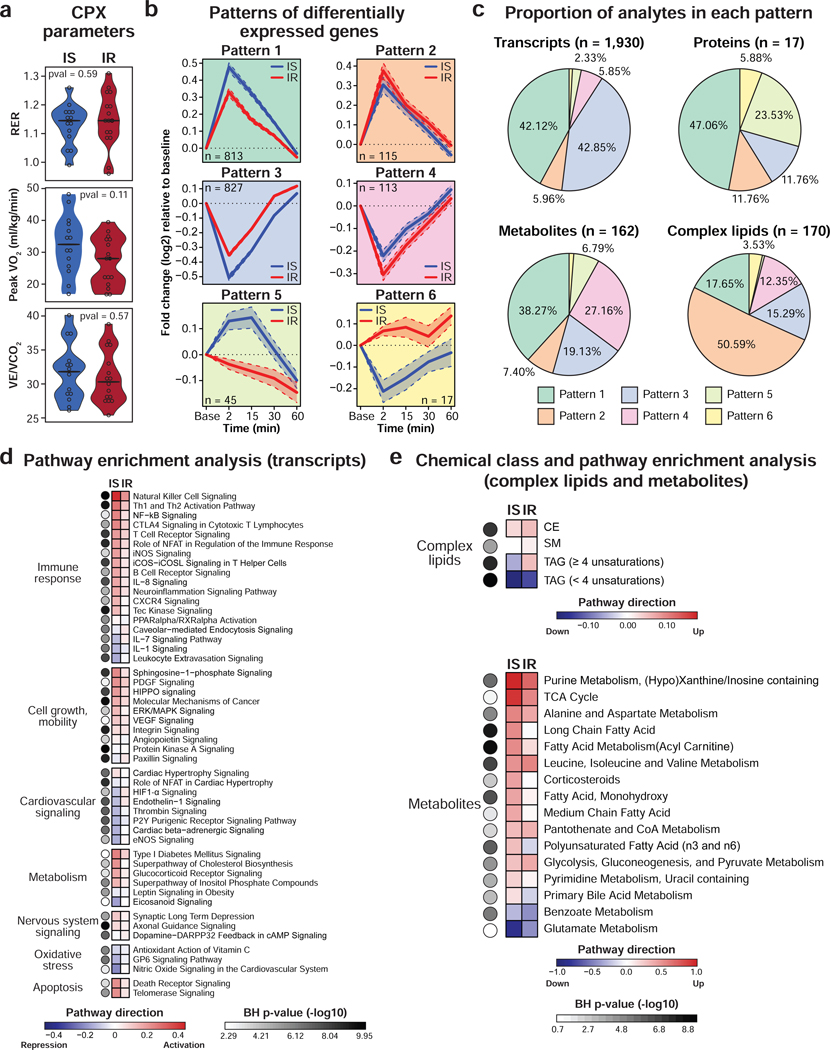
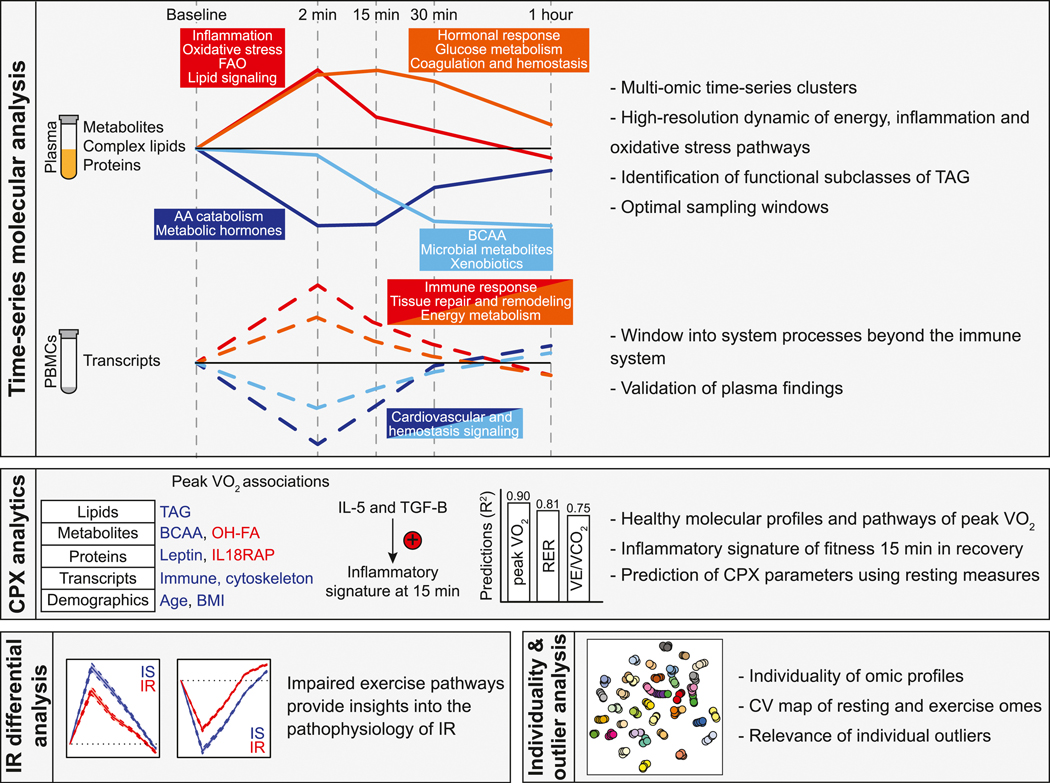
Acute physical activity leads to several changes in metabolic, cardiovascular, and immune pathways. Although studies have examined selected changes in these pathways, the system-wide molecular response to an acute bout of exercise has not been fully characterized. We performed longitudinal multi-omic profiling of plasma and peripheral blood mononuclear cells including metabolome, lipidome, immunome, proteome, and transcriptome from 36 well-characterized volunteers, before and after a controlled bout of symptom-limited exercise. Time-series analysis revealed thousands of molecular changes and an orchestrated choreography of biological processes involving energy metabolism, oxidative stress, inflammation, tissue repair, and growth factor response, as well as regulatory pathways. Most of these processes were dampened and some were reversed in insulin-resistant participants. Finally, we discovered biological pathways involved in cardiopulmonary exercise response and developed prediction models revealing potential resting blood-based biomarkers of peak oxygen consumption.

Keywords: cardiopulmonary exercise testing; fitness; insulin resistance; multi-omics; outlier analysis; peak VO(2); physical activity; predictive analytics; systems biology; time-series analysis.


Conflict of interest statement

Declaration of Interests M.P.S. is a cofounder and on the advisory board of Personalis, SensOmics, January, Filtricine, Qbio, Protos, and Mirive. M.P.S. is on the advisory board of Genapsys and Tailai. M.P.S. is an inventor on provisional patent number 62/897,908 “Surrogate of VO2 MAX Test”. K.C. and F.H. are also listed as inventors. E.A.A. is a cofounder of Personalis, Deepcell, and SVEXA and on the advisory board of Apple, SequenceBio, and Foresite Labs.

Figures

Figure 1.
Figure 1.. Study design, molecular response to exercise and inter-individual variability.
(a) Overview of the study design including an acute bout of exercise (symptom-limited cardiopulmonary exercise, CPX), cardiovascular phenotyping and longitudinal multi-omic profiling from blood specimens. PBMCs: peripheral blood mononuclear cells. (b) Analysis plan. (c) Multi-omic changes in response to acute exercise. (d) 2D visualization of all multi-omic analytes using t-distributed stochastic neighbor embedding (tSNE) technique. Each dot represents a single sample colored by participants. (e) Inter-individual variability at baseline (absolute levels) and in response to exercise (median of fold change to exercise) across molecule types. (f) Inter- individual variability of targeted proteins (technical, at baseline and in response to exercise). See also Figures S1S3 and Tables S1S3.
Figure 2.
Figure 2.. Multi-omic changes in response to acute exercise.
(a) Clustering of longitudinal trajectories using significant circulating plasma analytes (FDR < 0.05). (b) Expected metabolic changes in response to exercise including glycolysis, TCA cycle and adenine nucleotide metabolism. The dots represent the mean log2 fold change relative to baseline and the bars the standard error of the mean (SEM). (c) Heatmap of significant proteins representing the median log2 fold change relative to baseline in the cohort. Proteins were grouped by clusters. (d) Pathway/chemical class enrichment analysis of circulating plasma metabolites and complex lipids. Pathway direction is the median log2 fold change relative to baseline of significant molecules in each pathway (blue: downregulated, red: upregulated). The dot size represents pathway significance. Heatmaps representing the median log2 fold change relative to baseline for acylcarnitines (e) and free fatty acids (f). The clusters are indicated on the left side of the heatmaps. Longitudinal trajectories of significant amino acids (g) and microbial metabolites (h) in response to exercise. The dots represent the mean log2 fold change relative to baseline and the bars the standard error of the mean (SEM). * Branched chain amino acids. (i) Triacylglycerol (TAG) fatty acid composition in clusters 1 and 4. Two-sided Welsh t-tests were used to calculate differential enrichment in TAG composition. See also Figures S4S5 and Table S2.
Figure 3.
Figure 3.. Integrative multi-omic analysis of circulating analytes.
Pairwise spearman correlation networks of multi-omic measures belonging to each cluster as defined in Figure 2a. Nodes were color-coded by molecule type and their size represent the median fold change relative to baseline. The top 5 proteins with the greatest number of first order connections in each correlation network were displayed. Proteins with more than 10 connections are in bold and red. * Cardiac and muscular markers belong to cluster 3 but the decrease is not significant. See also Figures S4 and Table S2.
Figure 4.
Figure 4.. PBMC gene expression changes in response to acute exercise.
(a) Clustering of longitudinal gene expression trajectories (FDR < 0.05). (b) Pathway analysis using PBMC transcripts significantly changing in response to exercise. Pathway direction is the median log2 fold change relative to baseline of significant transcripts in each pathway (blue: downregulated, red: upregulated). The dot size represents pathway significance. See also Figures S5 and Table S2.
Figure 5.
Figure 5.. Multi-omic analysis of peak VO2.
(a) Proportion of analytes associated with peak VO2 (scaled by body weight) as determined by linear regression analysis. Only the molecules significant in three regression models adjusting for BMI or fat mass or percent fat were presented. Pathway/chemical class enrichment analysis of metabolites and complex lipids (b) as well as pathway analysis using PBMC gene expression (c) and circulating proteins (d). Pathway direction is the median beta coefficient of significant molecules in the pathway (blue: negative association, red: positive association). The dot size represents pathway significance. (e) Functional association network using the proteins from the “inflammatory fitness signature” at 15 min in recovery significantly associated with IL-5 at 2 min post-exercise (spearman correlation, FDR < 0.05). This analysis was performed using the web tool STRING. Line thickness indicates the strength of data support. Proteins are colored in red to signify a positive association with IL-5. (f) Pairwise spearman correlation networks of multi-omic measures significantly associated with peak VO2 at 15 min post-exercise. Nodes were color-coded by molecule type, their size represent the betweenness centrality and the edges were color-coded by association direction. (g) Molecules selected in the multi-omic peak VO2 prediction model and associated coefficients. MSE: mean square error, FM: full model. See also Figure S6 and Table S4.
Figure 6.
Figure 6.. Differential response to acute exercise in insulin resistant participants.
(a) Violin plots showing CPX parameters in insulin sensitive (IS) and resistant (IR) participants as defined by the modified insulin suppression test (IR: steady-state plasma glucose (SSPG) ≥ 150 mg/dl). A two-sided Student t-test (normal distribution) or a Wilcoxon rank sum test was used for differential analysis. (b) Patterns of differentially expressed genes in IS and IR participants. The solid line represents the mean and the dashed line represents the 95% confidence interval. (c) Pie charts depicting the proportion of significant transcripts (FDR < 0.05), proteins (FDR < 0.20), metabolites (FDR < 0.10) and complex lipids (FDR < 0.20) in each of the six patterns as defined in (b). Pathway analysis using PBMC gene expression (d) and pathway/chemical class enrichment analysis of metabolites and complex lipids (e). Pathway direction is the median of max/min fold change relative to baseline of significant molecules in the pathway (blue: downregulated, red: upregulated). The color of the dots represents pathway significance. See also Figure S7 and Table S5.
Figure 7.
Figure 7.. Summary of the main discoveries.
Discoveries were classified in four categories: time-series molecular analysis, cardiopulmonary exercise (CPX) analytics, insulin resistance (IR) differential analysis, individuality and outlier analysis.

References

    1. Agudelo LZ, Femenia T, Orhan F, Porsmyr-Palmertz M, Goiny M, Martinez-Redondo V, Correia JC, Izadi M, Bhat M, Schuppe-Koistinen I, et al. (2014). Skeletal muscle PGC-1alpha1 modulates kynurenine metabolism and mediates resilience to stress-induced depression. Cell 159, 33–45. - PubMed
    1. Albouaini K, Egred M, Alahmar A, and Wright DJ (2007). Cardiopulmonary exercise testing and its application. Heart 93, 1285–1292. - PMC - PubMed
    1. Arena R, Myers J, Aslam SS, Varughese EB, and Peberdy MA (2003). Technical considerations related to the minute ventilation/carbon dioxide output slope in patients with heart failure. Chest 124, 720–727. - PubMed
    1. Arena R, Myers J, Aslam SS, Varughese EB, and Peberdy MA (2004). Peak VO2 and VE/VCO2 slope in patients with heart failure: a prognostic comparison. Am Heart J 147, 354–360. - PubMed
    1. Arena R, and Sietsema KE (2011). Cardiopulmonary exercise testing in the clinical evaluation of patients with heart and lung disease. Circulation 123, 668–680. - PubMed

Publication types