

COVID-19: How to make between-country comparisons
- PMID: 32470605
- PMCID: PMC7250090
- DOI: 10.1016/j.ijid.2020.05.066
COVID-19: How to make between-country comparisons
Abstract
Background: Different countries have adopted different containment and testing strategies for SARS-CoV-2. The difference in testing makes it difficult to compare the effect of different containment strategies. This study proposes methods to allow a direct comparison and presents the results.
Design: Publicly available data on the numbers of reported COVID-19-related deaths between 01 January and 17 April 2020 were compared between countries.
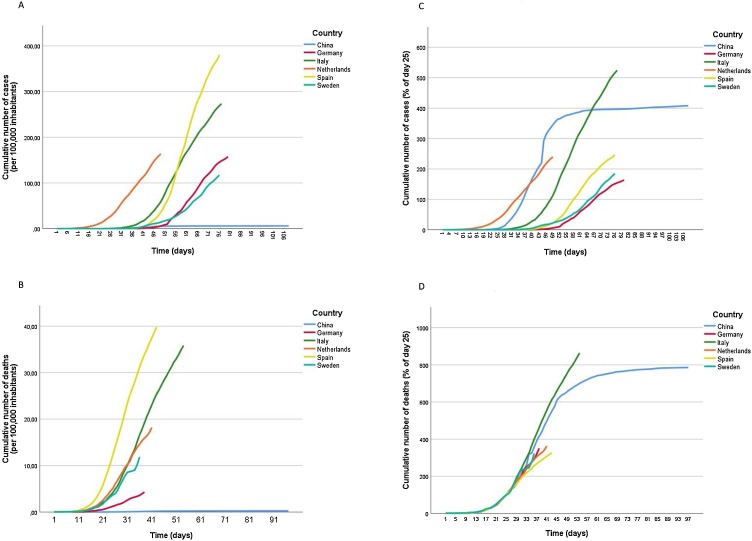
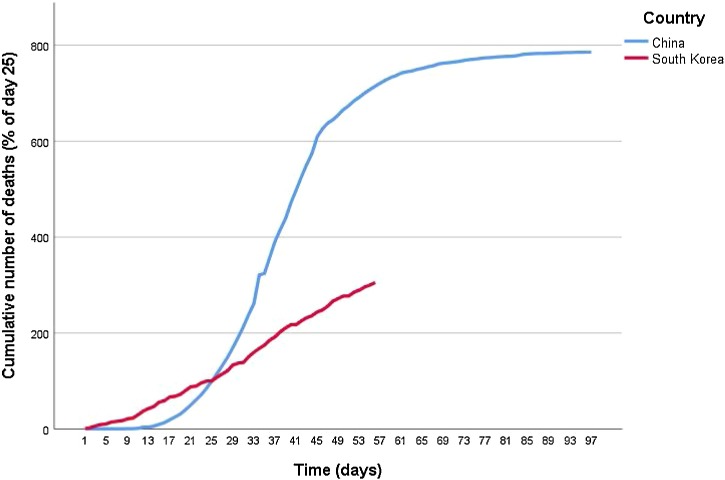
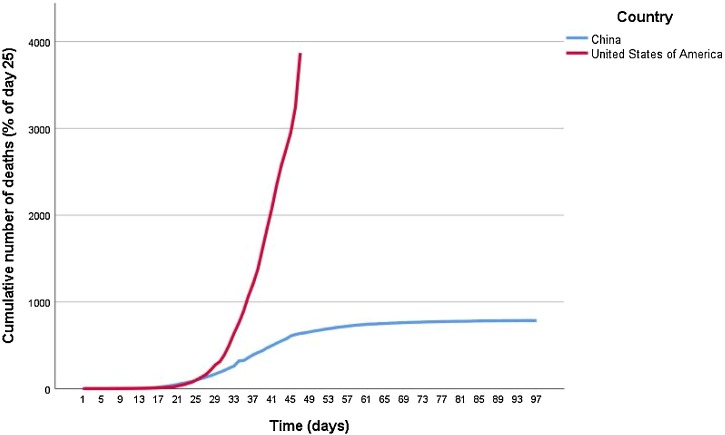
Results: The numbers of cases or deaths per 100,000 inhabitants gave severely biased comparisons between countries. Only the number of deaths expressed as a percentage of the number of deaths on day 25 after the first reported COVID-19-related death allowed a direct comparison between countries. From this comparison clear differences were observed between countries, associated with the timing of the implementation of containment measures.
Conclusions: Comparisons between countries are only possible when simultaneously taking into account that the virus does not arrive in all countries simultaneously, absolute numbers are incomparable due to different population sizes, rates per 100,000 of the population are incomparable because not all countries are affected homogeneously, susceptibility to death by COVID-19 can differ between populations, and a death is only reported as a COVID-19-related death if the patient was diagnosed with SARS-CoV-2 infection. With the current methods, all these factors were accounted for and an unbiased direct comparison between countries was established. This comparison confirmed that early adoption of containment strategies is key in flattening the curve of the epidemic.
Keywords: COVID-19; Forecast; Mortality; Prevention.
Copyright © 2020 The Author(s). Published by Elsevier Ltd.. All rights reserved.
Figures
References
-
- Dyer O. Covid-19: hospitals brace for disaster as US surpasses China in number of cases. BMJ. 2020;368:m1278. - PubMed
-
- EU . 2020. EU Open Data Portal: COVID-19 cases worldwide.https://www.ecdc.europa.eu/sites/default/files/documents/COVID-19-geogra...
MeSH terms
LinkOut - more resources
Full Text Sources
Miscellaneous
