

Neosaxitoxin Inhibits the Expression of Inflammation Markers of the M1 Phenotype in Macrophages
- PMID: 32471037
- PMCID: PMC7345530
- DOI: 10.3390/md18060283
Neosaxitoxin Inhibits the Expression of Inflammation Markers of the M1 Phenotype in Macrophages
Abstract
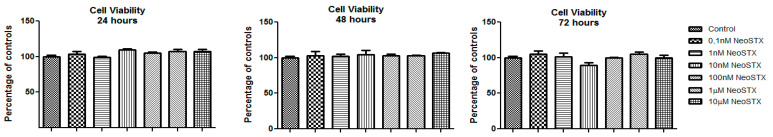
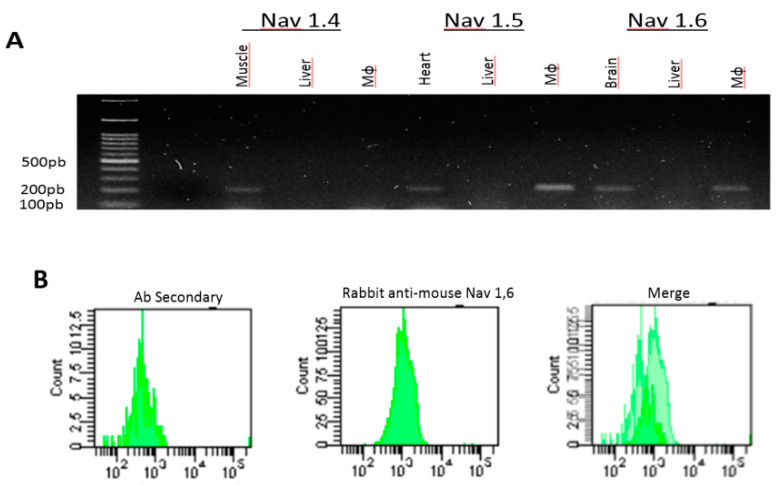
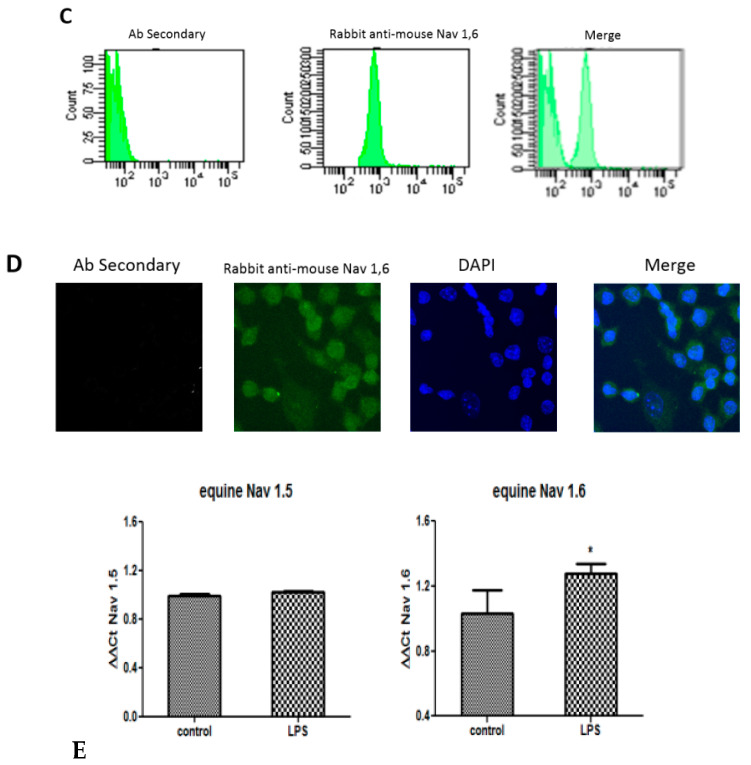
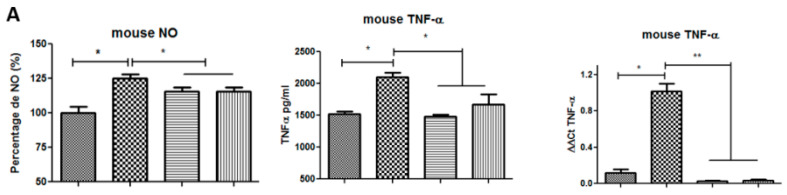
(1) Background: Neosaxitoxin (NeoSTX) has been used as a local anesthetic, but its anti-inflammatory effects have not been well defined. In the present study, we investigate the effects of NeoSTX on lipopolysaccharide (LPS)-activated macrophages. (2) Methods: Raw 264.7 and equine PBMC cells were incubated with or without 100 ng/mL LPS in the presence or absence of NeoSTX (1µM). The expression of inflammatory mediators was assessed: nitric oxide (NO) content using the Griess assay, TNF-α content using the ELISA assay, and mRNA of inducible nitric oxide synthase (iNOS), interleukin-1β (IL-1β), and tumor necrosis factor-α (TNF-α) using a real-time polymerase chain reaction. (3) Results: NeoSTX (1 μM) significantly inhibited the release of NO, TNF-α, and expression of iNOS, IL-1β, and TNF-α in LPS-activated macrophages of both species studied. Furthermore, our study shows that the LPS-induced release of inflammatory mediators was suppressed by NeoSTX. Additionally, NeoSTX deactivated polarized macrophages to M1 by LPS without compromising its polarization towards M2. (4) Conclusions: NeoSTX inhibits LPS-induced release of inflammatory mediators from macrophages, and these effects may be mediated by the blockade of voltage-gated sodium channels (VGSC).
Keywords: Nav channels; inflammation; macrophages; neosaxitoxin.
Conflict of interest statement
The authors declare no conflict of interest.
Figures
Similar articles
-
Toxoplasma ROP16I/III ameliorated inflammatory bowel diseases via inducing M2 phenotype of macrophages.World J Gastroenterol. 2019 Dec 7;25(45):6634-6652. doi: 10.3748/wjg.v25.i45.6634. World J Gastroenterol. 2019. PMID: 31832003 Free PMC article.
-
Effects of compounds from bi-qi capsule on the expression of inflammatory mediators in lipopolysaccharide-stimulated RAW 264.7 macrophages.J Ethnopharmacol. 2011 Jul 14;136(3):480-7. doi: 10.1016/j.jep.2010.06.008. Epub 2010 Jun 15. J Ethnopharmacol. 2011. PMID: 20558268
-
α-Solanine Isolated From Solanum Tuberosum L. cv Jayoung Abrogates LPS-Induced Inflammatory Responses Via NF-κB Inactivation in RAW 264.7 Macrophages and Endotoxin-Induced Shock Model in Mice.J Cell Biochem. 2016 Oct;117(10):2327-39. doi: 10.1002/jcb.25530. Epub 2016 Mar 11. J Cell Biochem. 2016. PMID: 26931732
-
Ethanol extract from a Chinese herbal formula, "Zuojin Pill", inhibit the expression of inflammatory mediators in lipopolysaccharide-stimulated RAW 264.7 mouse macrophages.J Ethnopharmacol. 2012 May 7;141(1):377-85. doi: 10.1016/j.jep.2012.02.049. Epub 2012 Mar 6. J Ethnopharmacol. 2012. PMID: 22414473
-
Pinus densiflora needle supercritical fluid extract suppresses the expression of pro-inflammatory mediators iNOS, IL-6 and IL-1β, and activation of inflammatory STAT1 and STAT3 signaling proteins in bacterial lipopolysaccharide-challenged murine macrophages.Daru. 2017 Aug 4;25(1):18. doi: 10.1186/s40199-017-0184-y. Daru. 2017. PMID: 28778215 Free PMC article.
Cited by
-
The Chemistry of Phytoplankton.Chem Rev. 2024 Dec 11;124(23):13099-13177. doi: 10.1021/acs.chemrev.4c00177. Epub 2024 Nov 21. Chem Rev. 2024. PMID: 39571071 Free PMC article. Review.
-
The contribution of ion channels to shaping macrophage behaviour.Front Pharmacol. 2022 Sep 7;13:970234. doi: 10.3389/fphar.2022.970234. eCollection 2022. Front Pharmacol. 2022. PMID: 36160429 Free PMC article. Review.
-
Marine Toxins as Pharmaceutical Treasure Troves: A Focus on Saxitoxin Derivatives from a Computational Point of View.Molecules. 2024 Jan 4;29(1):275. doi: 10.3390/molecules29010275. Molecules. 2024. PMID: 38202857 Free PMC article.
-
Equine peripheral blood CD14+ monocyte-derived macrophage in-vitro characteristics after GM-CSF pretreatment and LPS+IFN-γ or IL-4+IL-10 differentiation.Vet Immunol Immunopathol. 2023 Jan;255:110534. doi: 10.1016/j.vetimm.2022.110534. Epub 2022 Dec 7. Vet Immunol Immunopathol. 2023. PMID: 36502640 Free PMC article.
-
Effects of marine biotoxins on drug-metabolizing cytochrome P450 enzymes and their regulation in mammalian cells.Arch Toxicol. 2024 May;98(5):1311-1322. doi: 10.1007/s00204-024-03694-6. Epub 2024 Feb 28. Arch Toxicol. 2024. PMID: 38416141 Free PMC article. Review.
References
MeSH terms
Substances
LinkOut - more resources
Full Text Sources
