. 2020 May 27;21(11):3794.
doi: 10.3390/ijms21113794.

Leptin Signaling Affects Survival and Chemoresistance of Estrogen Receptor Negative Breast Cancer

Affiliations

Leptin Signaling Affects Survival and Chemoresistance of Estrogen Receptor Negative Breast Cancer

Crystal C Lipsey et al. Int J Mol Sci. .

Abstract

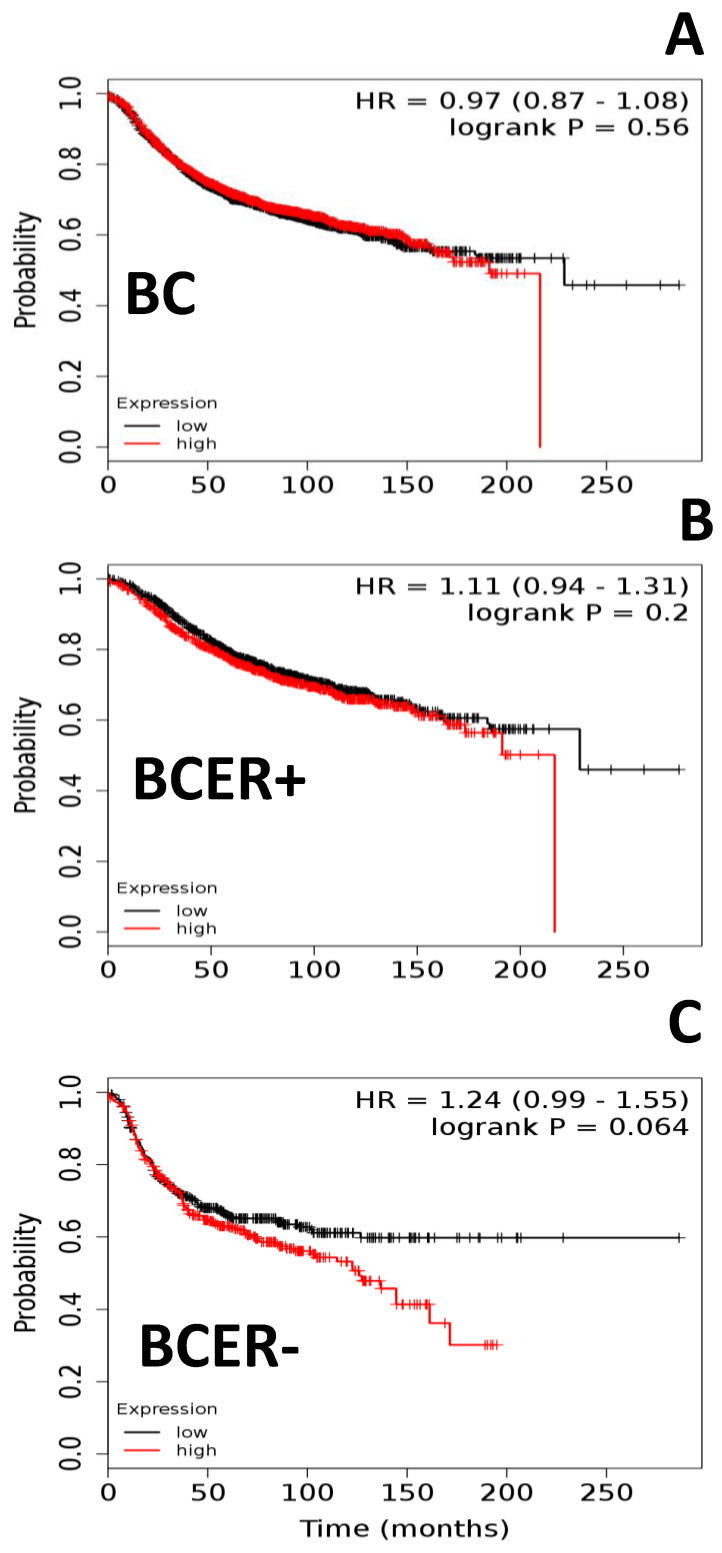
Estrogen-receptor-negative breast cancer (BCER-) is mainly treated with chemotherapeutics. Leptin signaling can influence BCER- progression, but its effects on patient survival and chemoresistance are not well understood. We hypothesize that leptin signaling decreases the survival of BCER- patients by, in part, inducing the expression of chemoresistance-related genes. The correlation of expression of leptin receptor (OBR), leptin-targeted genes (CDK8, NANOG, and RBP-Jk), and breast cancer (BC) patient survival was determined from The Cancer Genome Atlas (TCGA) mRNA data. Leptin-induced expression of proliferation and chemoresistance-related molecules was investigated in triple-negative BC (TNBC) cells that respond differently to chemotherapeutics. Leptin-induced gene expression in TNBC was analyzed by RNA-Seq. The specificity of leptin effects was assessed using OBR inhibitors (shRNA and peptides). The results show that OBR and leptin-targeted gene expression are associated with lower survival of BCER- patients. Importantly, the co-expression of these genes was also associated with chemotherapy failure. Leptin signaling increased the expression of tumorigenesis and chemoresistance-related genes (ABCB1, WNT4, ADHFE1, TBC1D3, LL22NC03, RDH5, and ITGB3) and impaired chemotherapeutic effects in TNBC cells. OBR inhibition re-sensitized TNBC to chemotherapeutics. In conclusion, the co-expression of OBR and leptin-targeted genes may be used as a predictor of survival and drug resistance of BCER- patients. Targeting OBR signaling could improve chemotherapeutic efficacy.

Keywords: chemoresistance; estrogen receptor negative breast cancer survival; leptin; leptin antagonist; obesity-related cancer.


Conflict of interest statement

The authors declare that there is no conflict of interest regarding the publication of this paper.

Figures

Figure 1
Figure 1
Leptin receptor (OBR) mRNA expression and survival of breast cancer (BC) patients. (A) Survival curves of patients (all breast cancer sub-types; n = 3951). (B) Survival curves of patients stratified by estrogen-receptor-positive BC (BCER+; n = 2061) and (C) estrogen-receptor-negative BC (BCER−; n = 801) subtypes. Kaplan–Meier survival plots were calculated for BC patients expressing low versus high levels of OBR mRNA according to data from the Cancer Genome Atlas (TCGA) [18,19,20,21]. Graphs depict relapse-free survival. Patients surviving beyond the timeline threshold (20 years and 10 months) were censored instead of excluded. Hazard ratio (HR) range and p-values (logrank P) were obtained for the BC subtypes using Kmplot.com software [18].
Figure 2
Figure 2
Expression of leptin-targeted gene mRNA reduces survival of ER-negative breast cancer patients (BCER−). Survival curves of patients (n = 801) with low and high expression of (A) CDK8, (B) NANOG, and (C) RBP-Jk. Kaplan–Meier survival plots were calculated using data from the Cancer Genome Atlas (TCGA) [18,19,20,21]. Graphs depict relapse-free survival. Patients surviving beyond the timeline threshold (20 years and 10 months) were censored instead of excluded. Hazard ratio (HR) range and p-values (logrank P) were obtained for the BCER− patients using Kmplot.com software [18].
Figure 3
Figure 3
Co-expression of OBR and targeted genes decreases survival of ER-negative breast cancer patients (BCER−). Survival curves of patients (n = 801) with low and high expression of (A) CDK8-OBR, (B) NANOG-OBR, and (C) RBPJk-OBR. Kaplan–Meier survival plots were calculated using data from the Cancer Genome Atlas (TCGA) [18,19,20,21]. Graphs depict relapse-free survival. Patients surviving beyond the timeline threshold (20 years and 10 months) were censored instead of excluded. Hazard ratio (HR) range and p-values (logrank P) were obtained for the BCER− patients using Kmplot.com software [18].
Figure 4
Figure 4
Co-expression of OBR and targeted genes and survival of ER-negative (BCER−) and -positive (BCER+) breast cancer patients treated with chemotherapeutics. (A) Survival curves of BCER− patients (n = 315) with low and high co-expression of CDK8–NANOG–RBPJk–OBR. (B) Survival curves of BCER+ patients (n = 331) with low and high co-expression of CDK8–NANOG–RBPJk–OBR. Kaplan–Meier survival plots were calculated using data from the Cancer Genome Atlas (TCGA) [18,19,20,21]. Graphs depict relapse-free survival. Patients surviving beyond the timeline threshold (20 years and 10 months) were censored instead of excluded. Hazard ratio (HR) range and p-values (logrank P) were obtained for the BC patients using Kmplot.com software [18].
Figure 5
Figure 5
Leptin treatment increases survival of triple-negative breast cancer cells treated with paclitaxel. Paclitaxel dose–response effects on breast cancer cell survival: (A) MDA-MB468 and (B) MDA-MB231. Cells were treated with paclitaxel (P, 10−4–102 μM); P + Leptin (L, 2.5 nM) and P + L + C6 and mC6 leptin antagonists (2.5 nM) for 72 h. CellTiter-Glo Assay was used to determine relative cell survival; “a”: p ≤ 0.05 compared to P; “b”: p ≤ 0.05 compared to P + L.
Figure 6
Figure 6
Leptin increases survival of chemoresistant triple-negative breast cancer cells treated with paclitaxel and cisplatin. (A) Paclitaxel and (B) cisplatin dose–response effects on survival of MDA-MB231 VBL-100 breast cancer cells. Cells were treated with paclitaxel (P, 10−4–102 μM) or cisplatin (C, 10−4–102 μM); P or C + Leptin (L, 2.5 nM) and P or C + L + C6 and mC6 leptin antagonists (2.5 nM) for 72 h. CellTiter-Glo Assay was used to determine relative cell survival; “a”: p ≤ 0.05 compared to P; “b”: p ≤ 0.05 compared to P + L; “c”: p ≤ 0.05 compared to C; “d”: p ≤ 0.05 compared to C + L.
Figure 7
Figure 7
Inhibition of leptin signaling reduces the expression of key tumorigenic proteins in paclitaxel-treated triple-negative breast cancer cells. (A) Leptin antagonism effects on levels of cMet, CK8 and CD44 and (B) Cyclin D1 and ZEB1 in MDA-MB231 cells treated with paclitaxel. Cells were treated with paclitaxel (P, 0.5 mM); P + leptin (L, 6.25 nM) and P + L + mC6 leptin antagonist (12.5 nM) for 72 h. Western blot assays were used to determine protein levels. “B”: basal (no treatment). “a”: p ≤ 0.05 compared to P + L.
Figure 8
Figure 8
Volcano plots of leptin effects on changes in gene expression in triple-negative breast cancer cells. (A) Untreated cells (control) versus leptin-treated cells. (B) Leptin-treated cells versus leptin +mC6 treated cells. MDA-MB231 cells were untreated or treated with leptin (6.25 nM) or leptin plus mC6 leptin antagonist (5 nM) for 24 h. After RNA extraction and purification, RNA-Seq experiments were conducted using the Illumina NextSeq platform, and differentially expressed genes (DEGs) were determined by Log FC >1.4 and p ≤ 0.05. Positive and negative Log FC indicate upregulation and downregulation, respectively.
Figure 9
Figure 9
Leptin-induced protein–protein interaction (PPI) network in triple-negative breast cancer cells. PPI analysis of proteins from 18 genes (circles) that were up- or downregulated in MDA-MB231 cells following 24 h treatment with leptin (6.25 nM) created using STRING (online version 11.0) [40]. The lines connecting the proteins depict “known” or “predicted” interactions. Statistical analysis of the whole genome was calculated with STRING (online version 11.0) [40]. The PPI network enrichment p-value = 1.1 × 10⁻¹², indicating that these interations within the network are significant. A total of 73 edges (protein–protein relationships) were discovered from 28 edges expected. Differentially expressed genes (DEGs) were determined by Log FC >1.4 and p ≤ 0.05.

Similar articles

Cited by

References

    1. WHO Fact Sheets in Obesity and Overweight. [(accessed on 11 September 2019)]; Available online: https://www.who.int/news-room/fact-sheets/detail/obesity-and-overweight.
    1. For D., Benefit P. AACR Cancer Progress Report. AACR; Philadelphia, PA, USA: 2018.
    1. Lauby-secretan B., Scoccianti C., Loomis D., Grosse Y., Bianchini F., Straif K. Body Fatness and Cancer—Viewpoint of the IARC Working Group. N. Engl. J. Med. 2016;8:794–798. doi: 10.1056/NEJMsr1606602. - DOI - PMC - PubMed
    1. Ishikawa M., Kitayama J., Nagawa H. Enhanced Expression of Leptin and Leptin Receptor (OB-R) in Human Breast Cancer. Clin. Cancer Res. 2004;10:4325–4332. doi: 10.1158/1078-0432.CCR-03-0749. - DOI - PubMed
    1. Mendonsa A.M., Chalfant M.C., Gorden L.D., VanSaun M.N. Modulation of the leptin receptor mediates tumor growth and migration of pancreatic cancer cells. PLoS ONE. 2015;10:e0126686. doi: 10.1371/journal.pone.0126686. - DOI - PMC - PubMed

MeSH terms