. 2020 May 27;12(6):486.
doi: 10.3390/pharmaceutics12060486.

Validation of Pharmacological Protocols for Targeted Inhibition of Canalicular MRP2 Activity in Hepatocytes Using [99mTc]mebrofenin Imaging in Rats

Affiliations

Validation of Pharmacological Protocols for Targeted Inhibition of Canalicular MRP2 Activity in Hepatocytes Using [99mTc]mebrofenin Imaging in Rats

Solène Marie et al. Pharmaceutics. .

Abstract

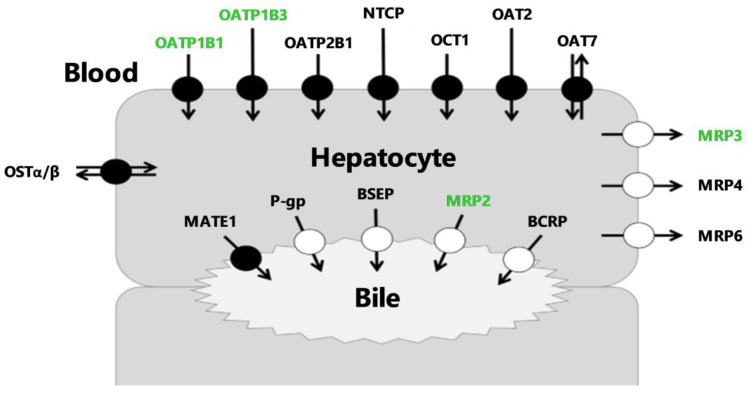
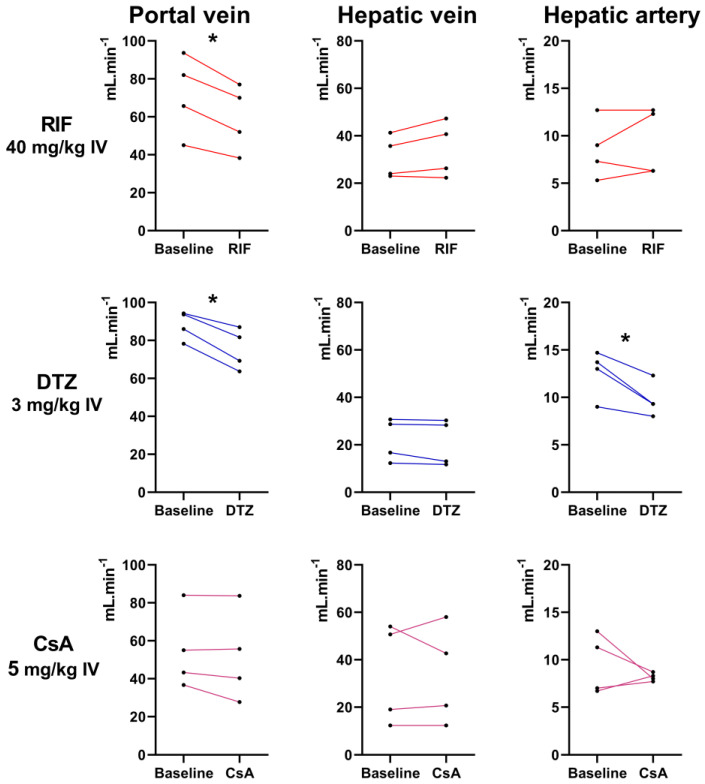
The multidrug resistance-associated protein 2 (MRP2) mediates the biliary excretion of drugs and metabolites. [99mTc]mebrofenin may be employed as a probe for hepatic MRP2 activity because its biliary excretion is predominantly mediated by this transporter. As the liver uptake of [99mTc]mebrofenin depends on organic anion-transporting polypeptide (OATP) activity, a safe protocol for targeted inhibition of hepatic MRP2 is needed to study the intrinsic role of each transporter system. Diltiazem (DTZ) and cyclosporin A (CsA) were first confirmed to be potent MRP2 inhibitors in vitro. Dynamic acquisitions were performed in rats (n = 5-6 per group) to assess the kinetics of [99mTc]mebrofenin in the liver, intestine and heart-blood pool after increasing doses of inhibitors. Their impact on hepatic blood flow was assessed using Doppler ultrasound (n = 4). DTZ (s.c., 10 mg/kg) and low-dose CsA (i.v., 0.01 mg/kg) selectively decreased the transfer of [99mTc]mebrofenin from the liver to the bile (k3). Higher doses of DTZ and CsA did not further decrease k3 but dose-dependently decreased the uptake (k1) and backflux (k2) rate constants between blood and liver. High dose of DTZ (i.v., 3 mg/kg) but not CsA (i.v., 5 mg/kg) significantly decreased the blood flow in the portal vein and hepatic artery. Targeted pharmacological inhibition of hepatic MRP2 activity can be achieved in vivo without impacting OATP activity and liver blood flow. Clinical studies are warranted to validate [99mTc]mebrofenin in combination with low-dose CsA as a novel substrate/inhibitor pair to untangle the role of OATP and MRP2 activity in liver diseases.

Keywords: drug metabolism; drug-induced liver injury; imaging; liver; membrane transporter; pharmacokinetics.


Conflict of interest statement

The authors declare no conflict of interest.

Figures

Figure 1
Figure 1
Membrane transporters expressed in hepatocytes. Transporters indicated in green have been described in the literature to transport [99mTc]mebrofenin. BCRP = Breast Cancer Resistance Protein, BSEP = Bile-Salt Export Pump, MATE1 = Multidrug And Toxin Extrusion Protein 1, MRP = Multidrug Resistance-Associated Protein, NTCP = Na+-taurocholate-cotransporting polypeptide, OAT = Organic Anion Transporter, OATP = Organic Anion-Transporting Polypeptide, OCT = Organic Cation Transporter, OST = Organic Solute Transporter, P-gp = P-glycoprotein.
Figure 2
Figure 2
In vitro inhibition of MRP2 activity by rifampicin (RIF), diltiazem (DTZ) and cyclosporin (CsA). MRP2 activity was assessed with the calcein-AM efflux assay using MDCK-II-MRP2 cells incubated with increasing concentrations of tested inhibitors. Data are mean ± S.D (n = 4) and lines show the nonlinear regression fit.
Figure 3
Figure 3
Representative planar scintigraphy images of the distribution of [99mTc]mebrofenin in a control and RIF-treated rat (40 mg/kg i.v.). Shown are summed frames from 0 to 3 min (to depict hepatic uptake) and summed frames from 10 to 25 min (to depict biliary excretion).
Figure 4
Figure 4
Mean (± SD) time-activity curves in the liver, intestine and blood for control animals and animals treated by rifampicin (RIF), diltiazem (DTZ) or cyclosporin A (CsA) with n = 5 for control, RIF, DTZ 10 mg/kg, DTZ 20 mg/kg, DTZ 40 mg/kg, CsA 0.1 mg/kg groups and n = 6 for CsA 0.01 mg/kg, CsA 0.5 mg/kg, CsA 1 mg/kg, CsA 5 mg/kg groups. Activity is expressed as the number of counts per second (cps) normalized to the injected dose (MBq).
Figure 5
Figure 5
Mean descriptive pharmacokinetic parameters for control animals and animals treated by rifampicin (RIF), diltiazem (DTZ) and cyclosporin A (CsA). (a) AUCRliver/blood,0–3 min (indicative of uptake of [99mTc]mebrofenin from blood into liver), (b) AUCRintestine/liver,10–25 min (indicative of excretion of [99mTc]mebrofenin from the liver into the intestine), (c) CLuptake values calculated from the integration plot analysis and (d) Xbladder,30 min/AUCblood,0–30 min (corresponding to CLurine). Data are means with error bars representing SD (n = 5 for control, RIF, DTZ 10 mg/kg, DTZ 20 mg/kg, DTZ 40 mg/kg, CsA 0.1 mg/kg groups and n = 6 for CsA 0.01 mg/kg, CsA 0.5 mg/kg, CsA 1 mg/kg, CsA 5 mg/kg groups). *, p < 0.05 compared to control, one-way ANOVA with a Bonferroni multiple-comparison test.
Figure 6
Figure 6
Outcome parameters for [99mTc]mebrofenin hepatobiliary distribution obtained with the four-compartment pharmacokinetic model for control animals and animals treated by rifampicin (RIF), diltiazem (DTZ) and cyclosporin A (CsA). k1 represents the transfer of [99mTc]mebrofenin from blood into the hepatocytes, k2 the backflux of [99mTc]mebrofenin from the hepatocytes into blood, k3 the transfer from the hepatocytes into the intrahepatic bile ducts and k5 from the intrahepatic bile duct to the intestine (n = 5 for control, RIF, DTZ 10 mg/kg, DTZ 20 mg/kg, DTZ 40 mg/kg, CsA 0.1 mg/kg groups and n = 6 for CsA 0.01 mg/kg, CsA 0.5 mg/kg, CsA 1 mg/kg, CsA 5 mg/kg groups). *, p < 0.05 compared to control, one-way ANOVA with a Bonferroni multiple-comparison test.
Figure 7
Figure 7
Blood flow (mL/min) of the portal vein, hepatic vein and hepatic artery measured with Doppler ultrasound in 4 rats before and after injection of rifampicin (RIF), diltiazem (DTZ) and cyclosporin A (CsA), respectively. *, p < 0.05, paired t-test.

Similar articles

Cited by

References

    1. Patel M., Taskar K., Zamek-Gliszczynski M. Importance of hepatic transporters in clinical disposition of drugs and their metabolites. J. Clin. Pharmacol. 2016;56:S23–S39. doi: 10.1002/jcph.671. - DOI - PubMed
    1. Marin J. Plasma membrane transporters in modern liver pharmacology. Scientifica. 2012;2012 doi: 10.6064/2012/428139. - DOI - PMC - PubMed
    1. Giacomini K., Galetin A., Huang S. The international transporter consortium: Summarizing advances in the role of transporters in drug development. Clin. Pharmacol. Ther. 2018;104:766–771. doi: 10.1002/cpt.1224. - DOI - PubMed
    1. Evers R., Piquette-Miller M., Polli J., Russel F., Sprowl J.A., Tohyama K., Ware J., de Wildt S., Xie W., Brouwer K. Disease-associated changes in drug transporters may impact the pharmacokinetics and/or toxicity of drugs: A white paper from the international transporter consortium. Clin. Pharmacol. Ther. 2018;104:900–915. doi: 10.1002/cpt.1115. - DOI - PMC - PubMed
    1. Kalliokoski A., Niemi M. Impact of OATP transporters on pharmacokinetics. Br. J. Pharmacol. 2009;158:693–705. doi: 10.1111/j.1476-5381.2009.00430.x. - DOI - PMC - PubMed