

Identification of Selective Novel Hits against Plasmodium falciparum Prolyl tRNA Synthetase Active Site and a Predicted Allosteric Site Using in silico Approaches
- PMID: 32471245
- PMCID: PMC7312540
- DOI: 10.3390/ijms21113803
Identification of Selective Novel Hits against Plasmodium falciparum Prolyl tRNA Synthetase Active Site and a Predicted Allosteric Site Using in silico Approaches
Abstract
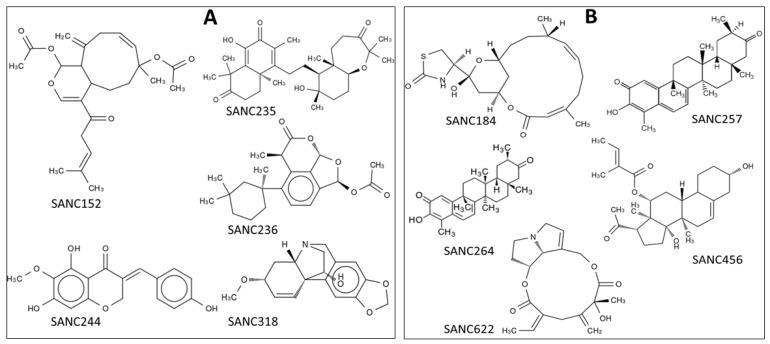
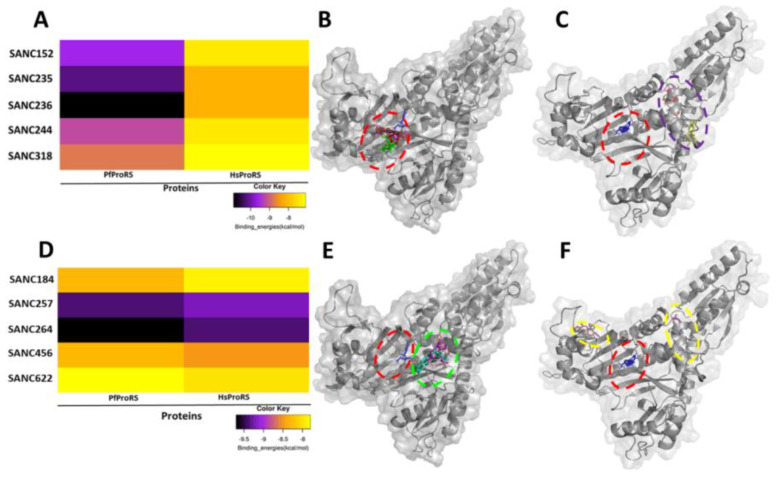
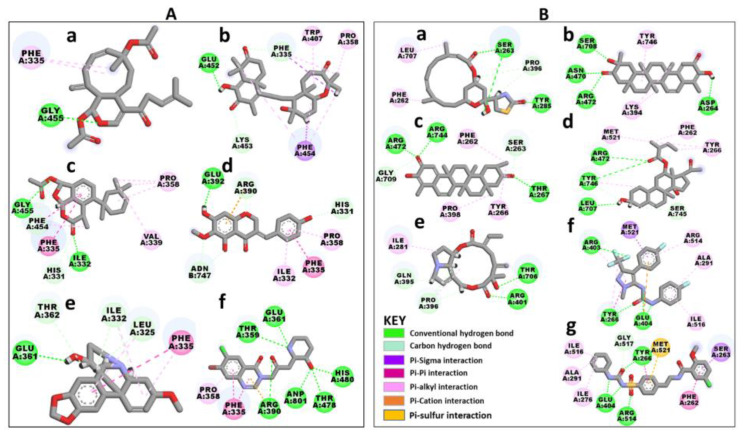
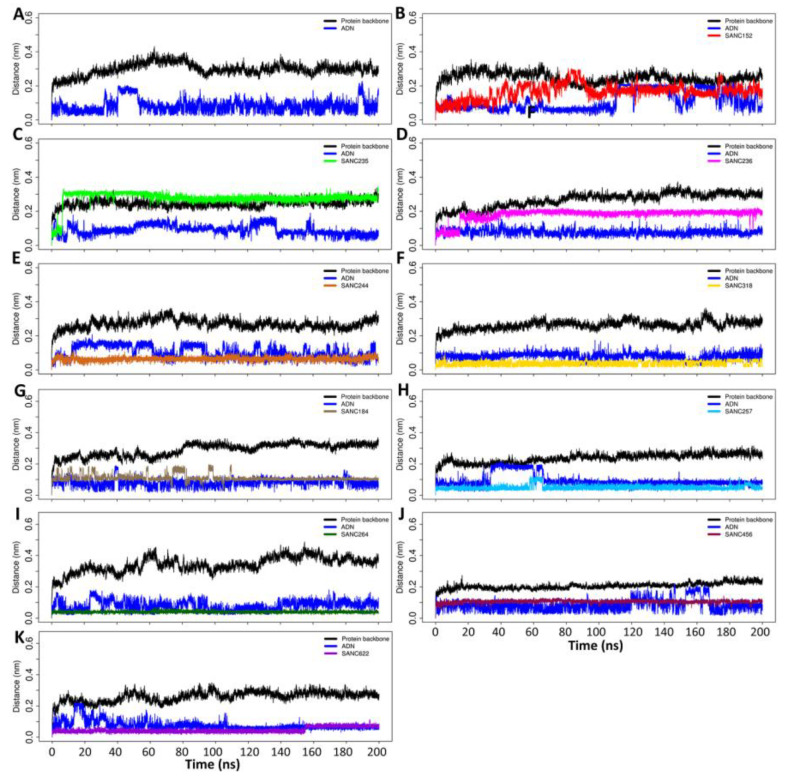
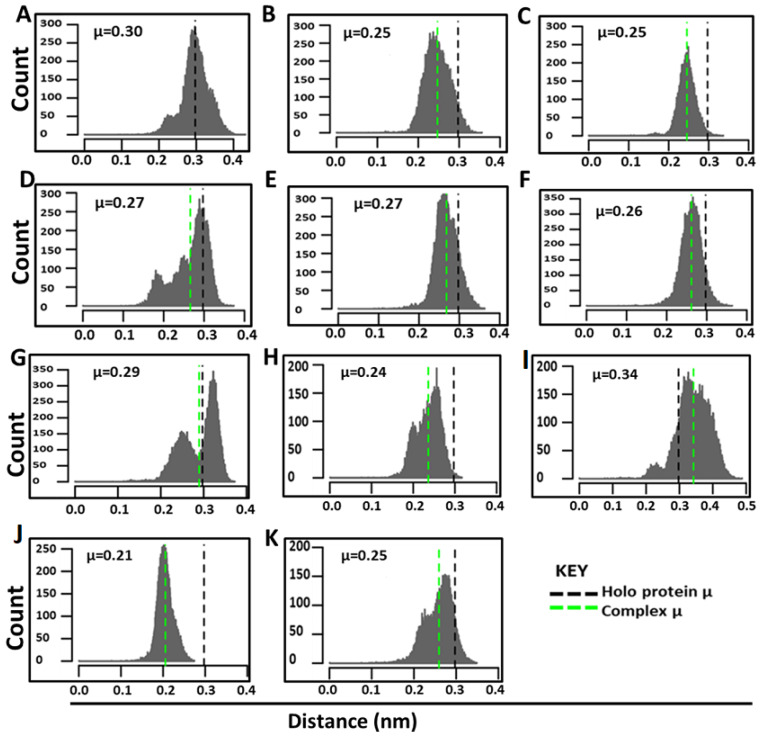
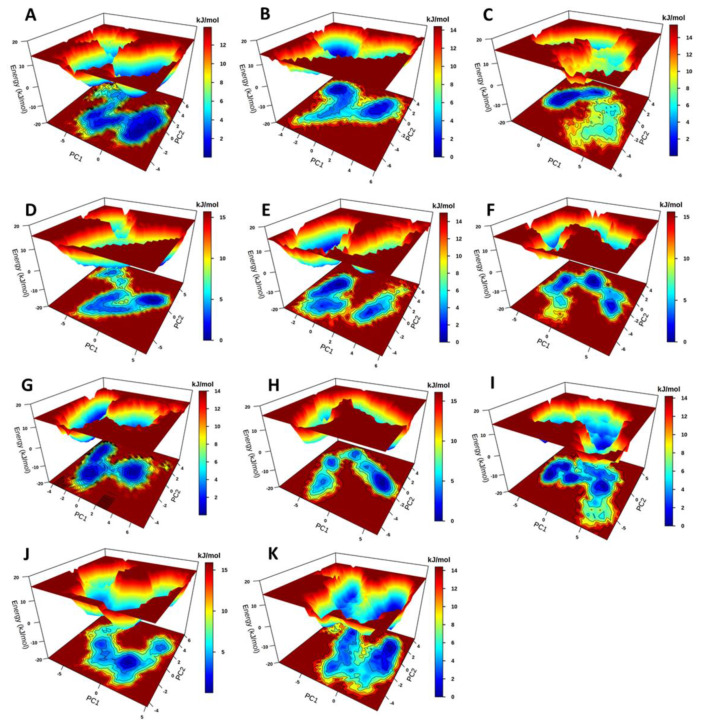
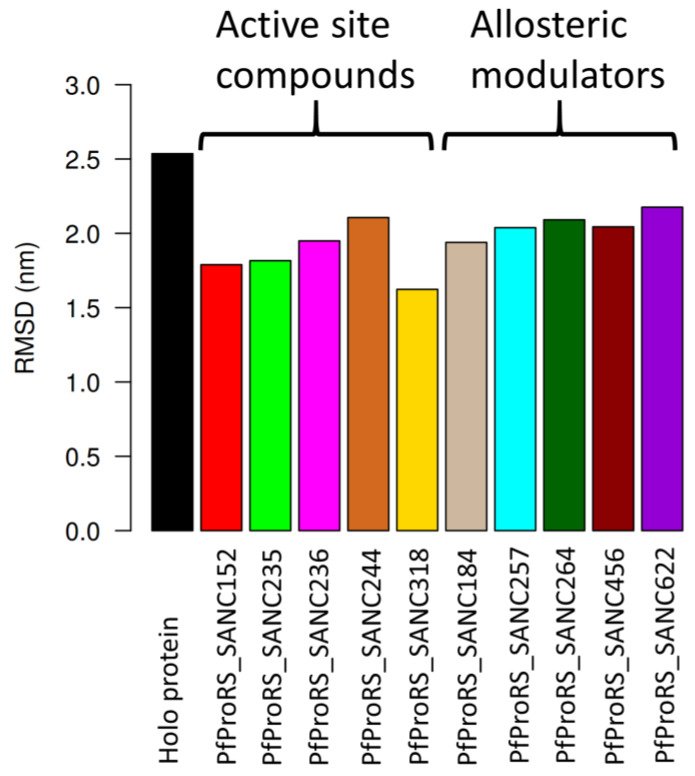
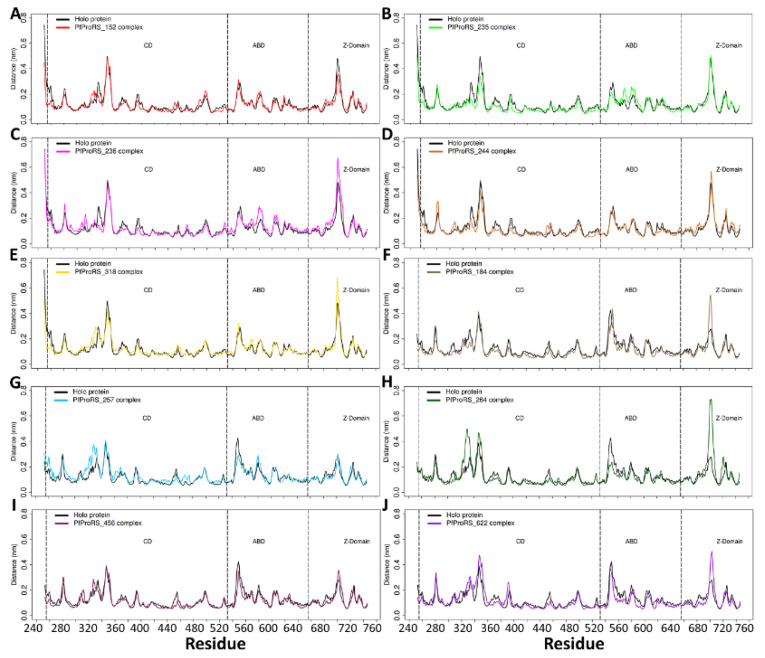
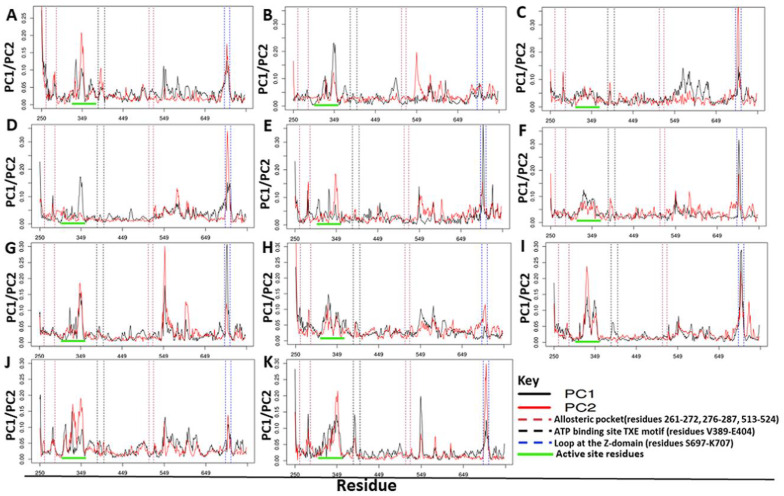
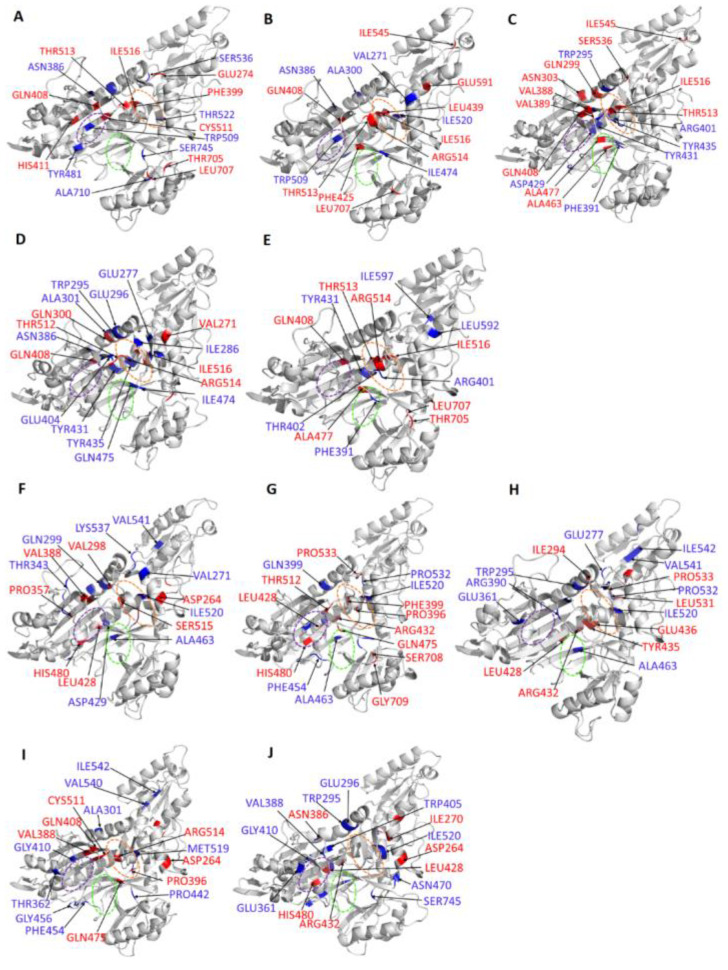
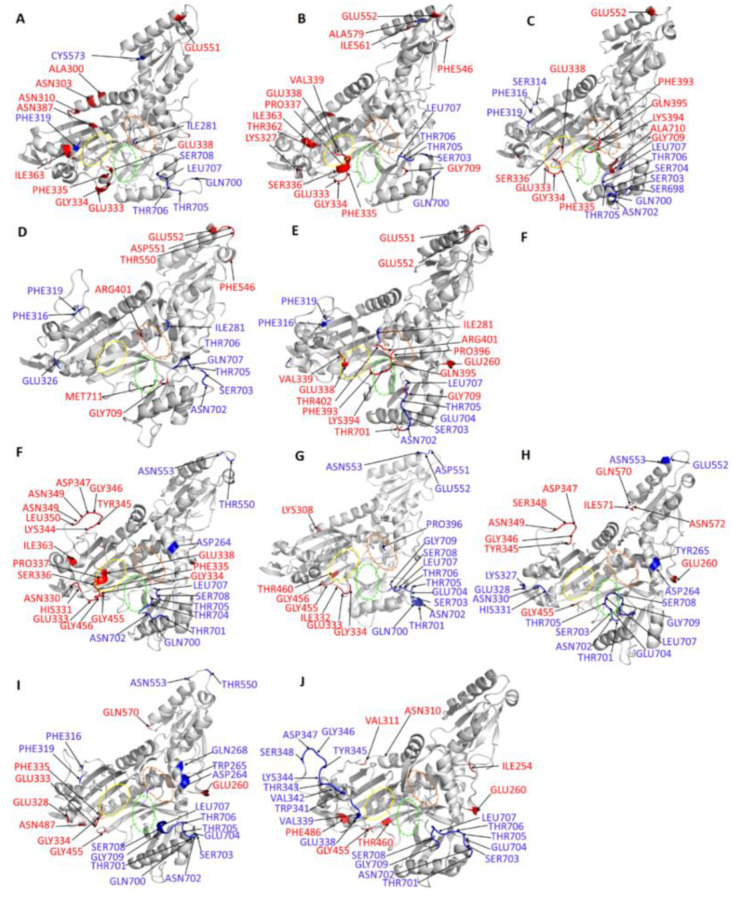
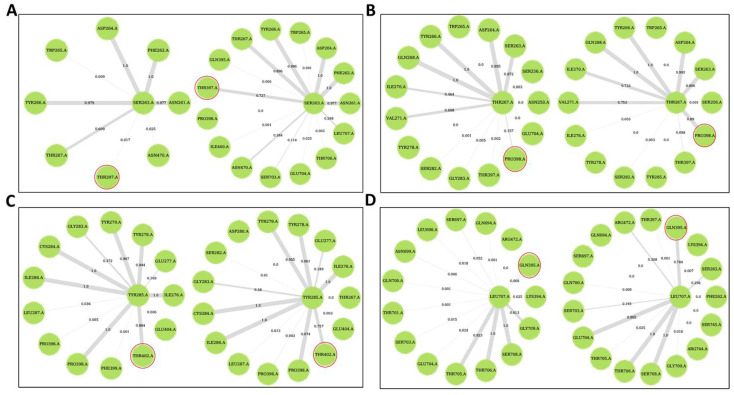
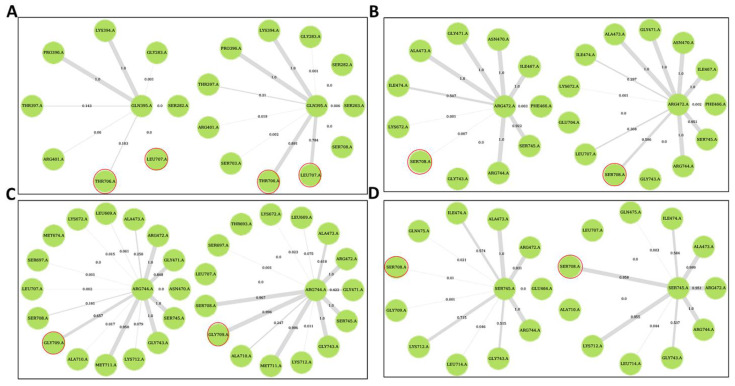
Recently, there has been increased interest in aminoacyl tRNA synthetases (aaRSs) as potential malarial drug targets. These enzymes play a key role in protein translation by the addition of amino acids to their cognate tRNA. The aaRSs are present in all Plasmodium life cycle stages, and thus present an attractive malarial drug target. Prolyl tRNA synthetase is a class II aaRS that functions in charging tRNA with proline. Various inhibitors against Plasmodium falciparum ProRS (PfProRS) active site have been designed. However, none have gone through clinical trials as they have been found to be highly toxic to human cells. Recently, a possible allosteric site was reported in PfProRS with two possible allosteric modulators: glyburide and TCMDC-124506. In this study, we sought to identify novel selective inhibitors targeting PfProRS active site and possible novel allosteric modulators of this enzyme. To achieve this, virtual screening of South African natural compounds against PfProRS and the human homologue was carried out using AutoDock Vina. The modulation of protein motions by ligand binding was studied by molecular dynamics (MD) using the GROningen MAchine for Chemical Simulations (GROMACS) tool. To further analyse the protein global motions and energetic changes upon ligand binding, principal component analysis (PCA), and free energy landscape (FEL) calculations were performed. Further, to understand the effect of ligand binding on the protein communication, dynamic residue network (DRN) analysis of the MD trajectories was carried out using the MD-TASK tool. A total of ten potential natural hit compounds were identified with strong binding energy scores. Binding of ligands to the protein caused observable global and residue level changes. Dynamic residue network calculations showed increase in betweenness centrality (BC) metric of residues at the allosteric site implying these residues are important in protein communication. A loop region at the catalytic domain between residues 300 and 350 and the anticodon binding domain showed significant contributions to both PC1 and PC2. Large motions were observed at a loop in the Z-domain between residues 697 and 710 which was also in agreement with RMSF calculations that showed increase in flexibility of residues in this region. Residues in this loop region are implicated in ATP binding and thus a change in dynamics may affect ATP binding affinity. Free energy landscape (FEL) calculations showed that the holo protein (protein-ADN complex) and PfProRS-SANC184 complexes were stable, as shown by the low energy with very few intermediates and hardly distinguishable low energy barriers. In addition, FEL results agreed with backbone RMSD distribution plots where stable complexes showed a normal RMSD distribution while unstable complexes had multimodal RMSD distribution. The betweenness centrality metric showed a loss of functional importance of key ATP binding site residues upon allosteric ligand binding. The deep basins in average L observed at the allosteric region imply that there is high accessibility of residues at this region. To further analyse BC and average L metrics data, we calculated the ΔBC and ΔL values by taking each value in the holo protein BC or L matrix less the corresponding value in the ligand-bound complex BC or L matrix. Interestingly, in allosteric complexes, residues located in a loop region implicated in ATP binding had negative ΔL values while in orthosteric complexes these residues had positive ΔL values. An increase in contact frequency between residues Ser263, Thr267, Tyr285, and Leu707 at the allosteric site and residues Thr397, Pro398, Thr402, and Gln395 at the ATP binding TXE loop was observed. In summary, this study identified five potential orthosteric inhibitors and five allosteric modulators against PfProRS. Allosteric modulators changed ATP binding site dynamics, as shown by RMSF, PCA, and DRN calculations. Changes in dynamics of the ATP binding site and increased contact frequency between residues at the proposed allosteric site and the ATP binding site may explain how allosteric modulators distort the ATP binding site and thus might inhibit PfProRS. The scaffolds of the identified hits in the study can be used as a starting point for antimalarial inhibitor development with low human cytotoxicity.
Keywords: Aminoacyl tRNA synthetase; MD-TASK; allosteric modulators; dynamic residue network; free energy landscape; virtual screening.
Conflict of interest statement
The authors declare no conflict of interest.
Figures
Similar articles
-
Allosteric modulation of Plasmodium falciparum Isoleucyl tRNA synthetase by South African natural compounds.PLoS One. 2025 May 14;20(5):e0321444. doi: 10.1371/journal.pone.0321444. eCollection 2025. PLoS One. 2025. PMID: 40367238 Free PMC article.
-
Aminoacyl tRNA synthetases as malarial drug targets: a comparative bioinformatics study.Malar J. 2019 Feb 6;18(1):34. doi: 10.1186/s12936-019-2665-6. Malar J. 2019. PMID: 30728021 Free PMC article.
-
Biochemical and Structural Characterization of Selective Allosteric Inhibitors of the Plasmodium falciparum Drug Target, Prolyl-tRNA-synthetase.ACS Infect Dis. 2017 Jan 13;3(1):34-44. doi: 10.1021/acsinfecdis.6b00078. Epub 2016 Nov 16. ACS Infect Dis. 2017. PMID: 27798837 Free PMC article.
-
Structural analyses of the malaria parasite aminoacyl-tRNA synthetases provide new avenues for antimalarial drug discovery.Protein Sci. 2021 Sep;30(9):1793-1803. doi: 10.1002/pro.4148. Protein Sci. 2021. PMID: 34184352 Free PMC article. Review.
-
In silico discovery of aminoacyl-tRNA synthetase inhibitors.Int J Mol Sci. 2014 Jan 20;15(1):1358-73. doi: 10.3390/ijms15011358. Int J Mol Sci. 2014. PMID: 24447926 Free PMC article. Review.
Cited by
-
Antimalarial Drug Discovery from Natural and Synthetic Sources.Curr Med Chem. 2025;32(1):87-110. doi: 10.2174/0109298673312727240527064833. Curr Med Chem. 2025. PMID: 38818916 Review.
-
Allosteric pockets and dynamic residue network hubs of falcipain 2 in mutations including those linked to artemisinin resistance.Comput Struct Biotechnol J. 2021 Oct 8;19:5647-5666. doi: 10.1016/j.csbj.2021.10.011. eCollection 2021. Comput Struct Biotechnol J. 2021. PMID: 34745456 Free PMC article.
-
Allosteric modulation of Plasmodium falciparum Isoleucyl tRNA synthetase by South African natural compounds.PLoS One. 2025 May 14;20(5):e0321444. doi: 10.1371/journal.pone.0321444. eCollection 2025. PLoS One. 2025. PMID: 40367238 Free PMC article.
-
Repositioning and Characterization of 1-(Pyridin-4-yl)pyrrolidin-2-one Derivatives as Plasmodium Cytoplasmic Prolyl-tRNA Synthetase Inhibitors.ACS Infect Dis. 2021 Jun 11;7(6):1680-1689. doi: 10.1021/acsinfecdis.1c00020. Epub 2021 Apr 30. ACS Infect Dis. 2021. PMID: 33929818 Free PMC article.
-
Deciphering Isoniazid Drug Resistance Mechanisms on Dimeric Mycobacterium tuberculosis KatG via Post-molecular Dynamics Analyses Including Combined Dynamic Residue Network Metrics.ACS Omega. 2022 Apr 7;7(15):13313-13332. doi: 10.1021/acsomega.2c01036. eCollection 2022 Apr 19. ACS Omega. 2022. PMID: 35474779 Free PMC article.
References
-
- Herman J.D., Pepper L.R., Cortese J.F., Galinsky K., Zuzarte-luis V., Derbyshire E.R., Ribacke U., Lukens A.K., Santos S.A., Patel V., et al. The Cytoplasmic Prolyl-tRNA Synthetase of the Malaria Parasite is a Dual-Stage Target for Drug Development. Sci. Transl. Med. 2016;7:288ra77. doi: 10.1126/scitranslmed.aaa3575. - DOI - PMC - PubMed
-
- WHO . WHO | World Malaria Report 2018. WHO; Geneva, Switzerland: 2018.
-
- Soulard V., Bosson-Vanga H., Lorthiois A., Roucher C., Franetich J.F., Zanghi G., Bordessoulles M., Tefit M., Thellier M., Morosan S., et al. Plasmodium falciparum full life cycle and Plasmodium ovale liver stages in humanized mice. Nat. Commun. 2015;6:7690. doi: 10.1038/ncomms8690. - DOI - PMC - PubMed
-
- Fairhurst R.M., Nayyar G.M.L., Breman J.G., Hallett R., Vennerstrom J.L., Duong S., Ringwald P., Wellems T.E., Plowe C.V., Dondorp A.M. Artemisinin-resistant malaria: Research challenges, opportunities, and public health implications. Am. J. Trop. Med. Hyg. 2012;87:231–241. doi: 10.4269/ajtmh.2012.12-0025. - DOI - PMC - PubMed
MeSH terms
Substances
Grants and funding
LinkOut - more resources
Full Text Sources
Research Materials
Miscellaneous
