. 2020 May 27;21(11):3808.
doi: 10.3390/ijms21113808.

Impact of a Histone Deacetylase Inhibitor-Trichostatin A on Neurogenesis after Hypoxia-Ischemia in Immature Rats

Affiliations

Impact of a Histone Deacetylase Inhibitor-Trichostatin A on Neurogenesis after Hypoxia-Ischemia in Immature Rats

Teresa Zalewska et al. Int J Mol Sci. .

Abstract

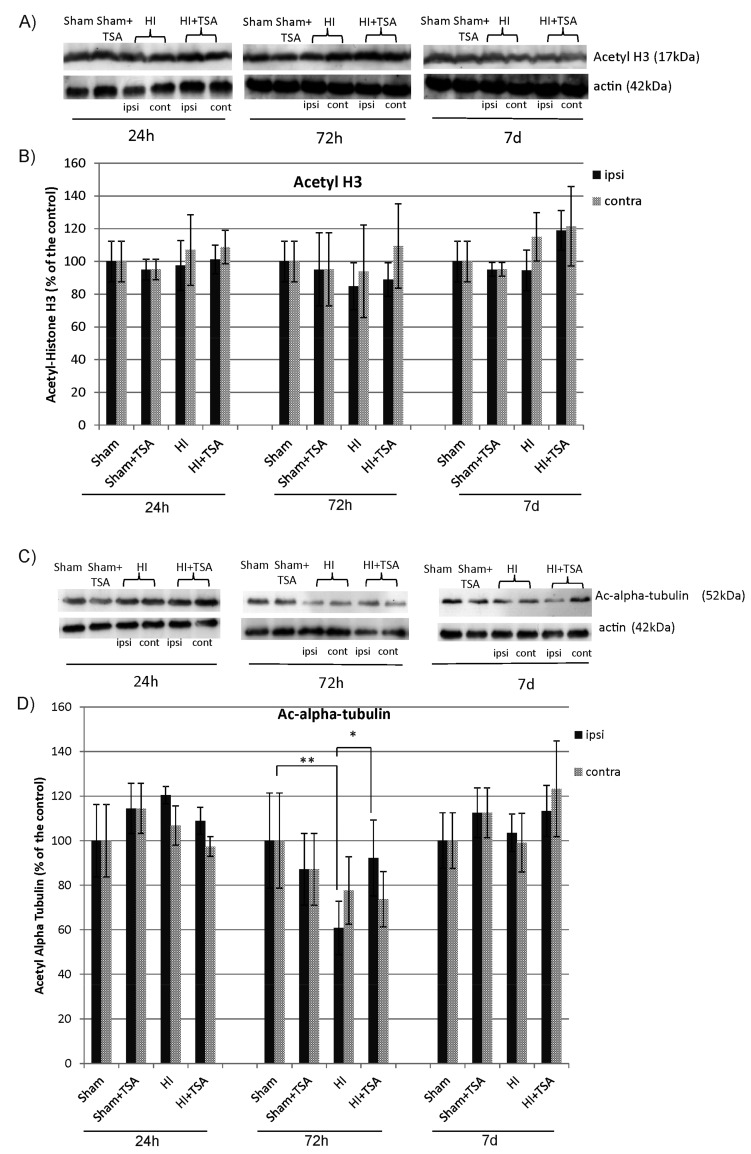
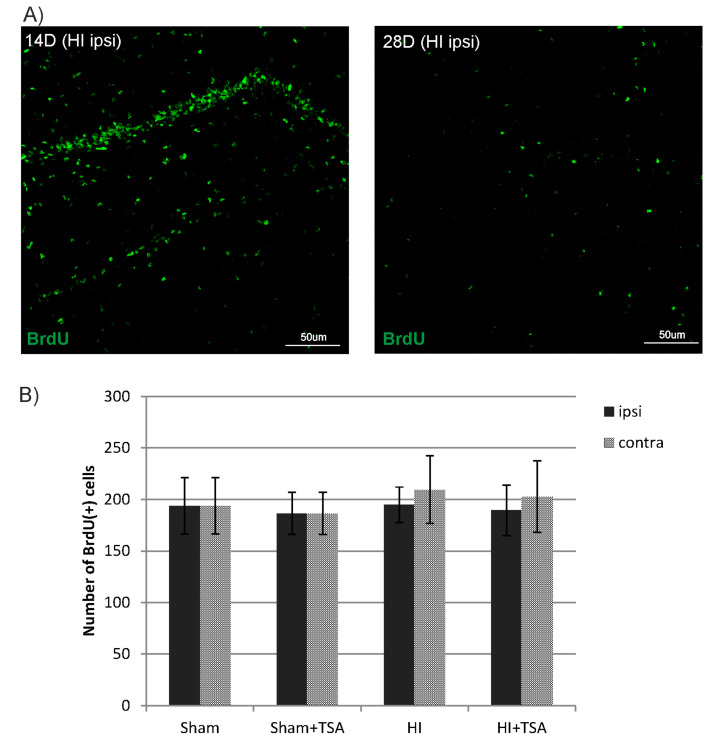
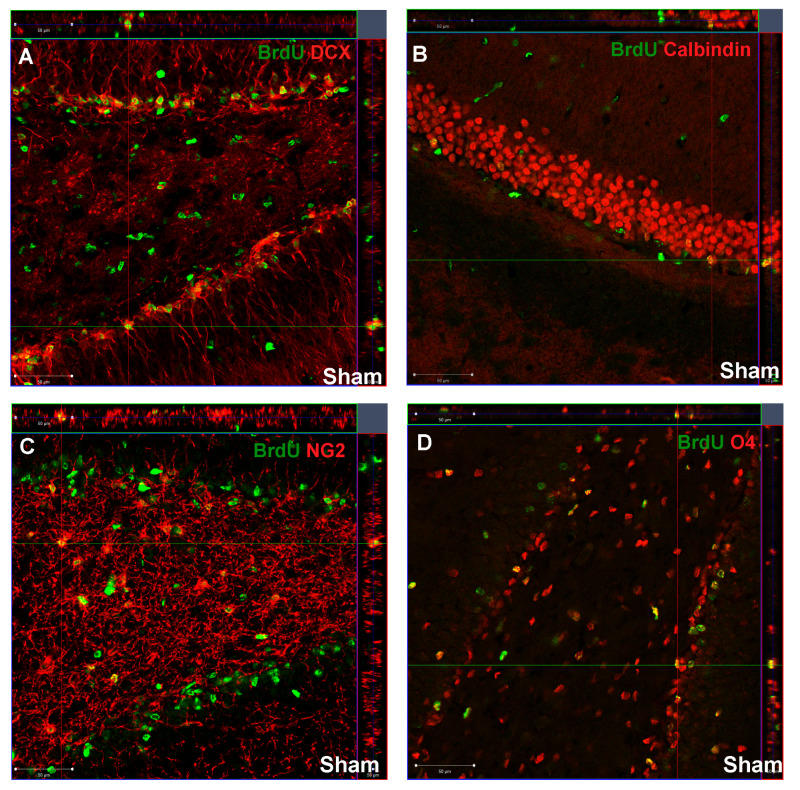
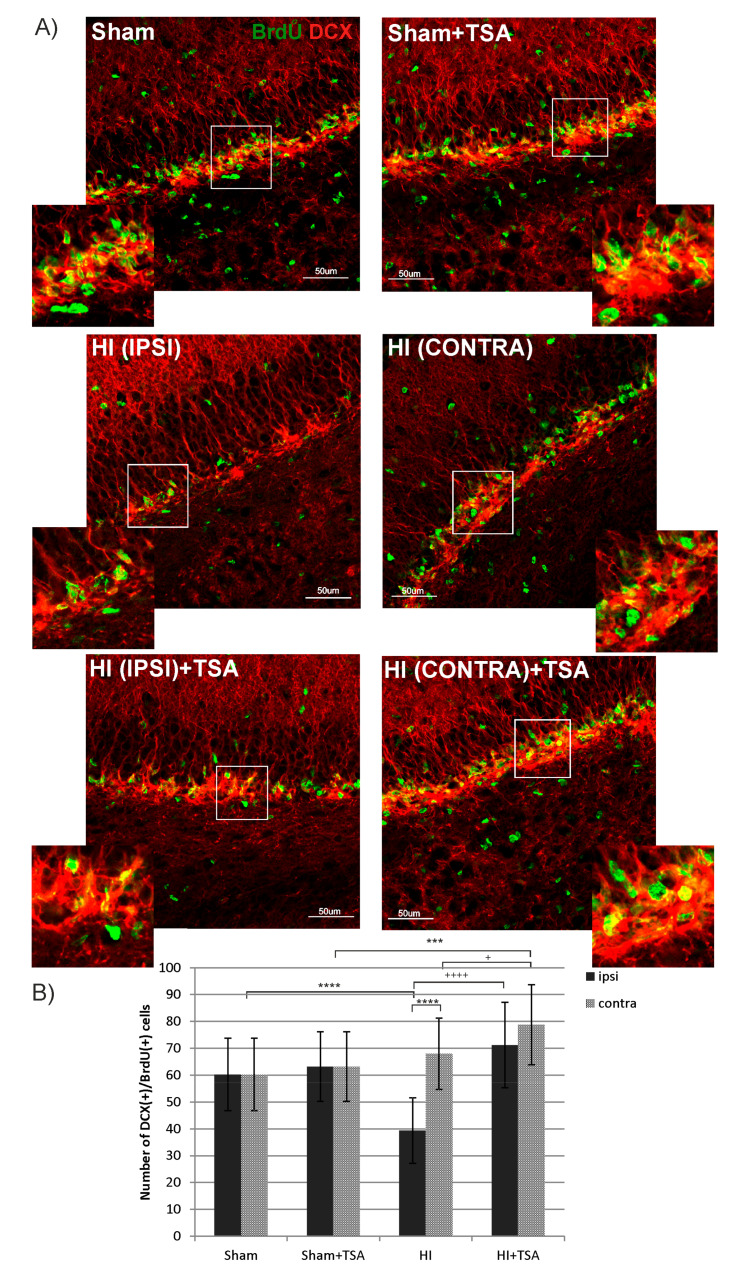
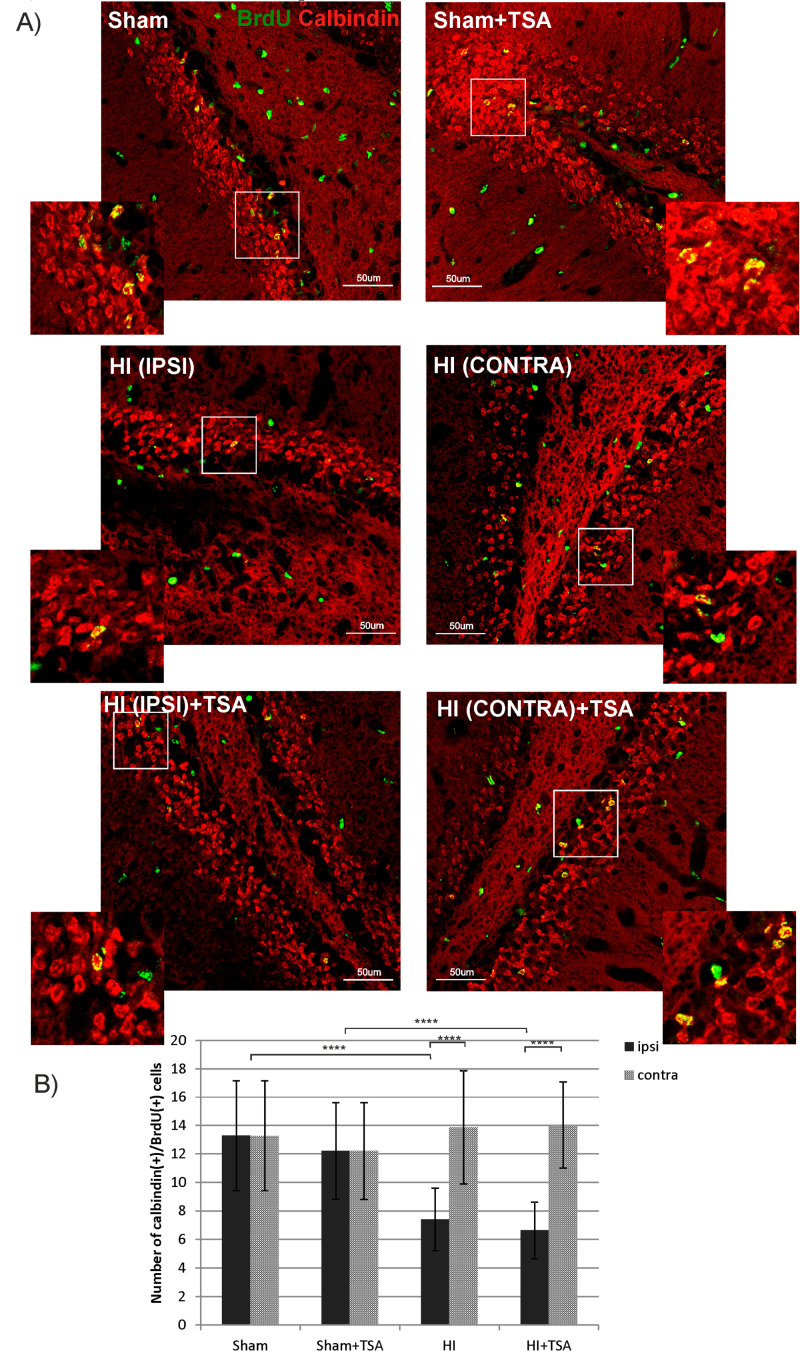
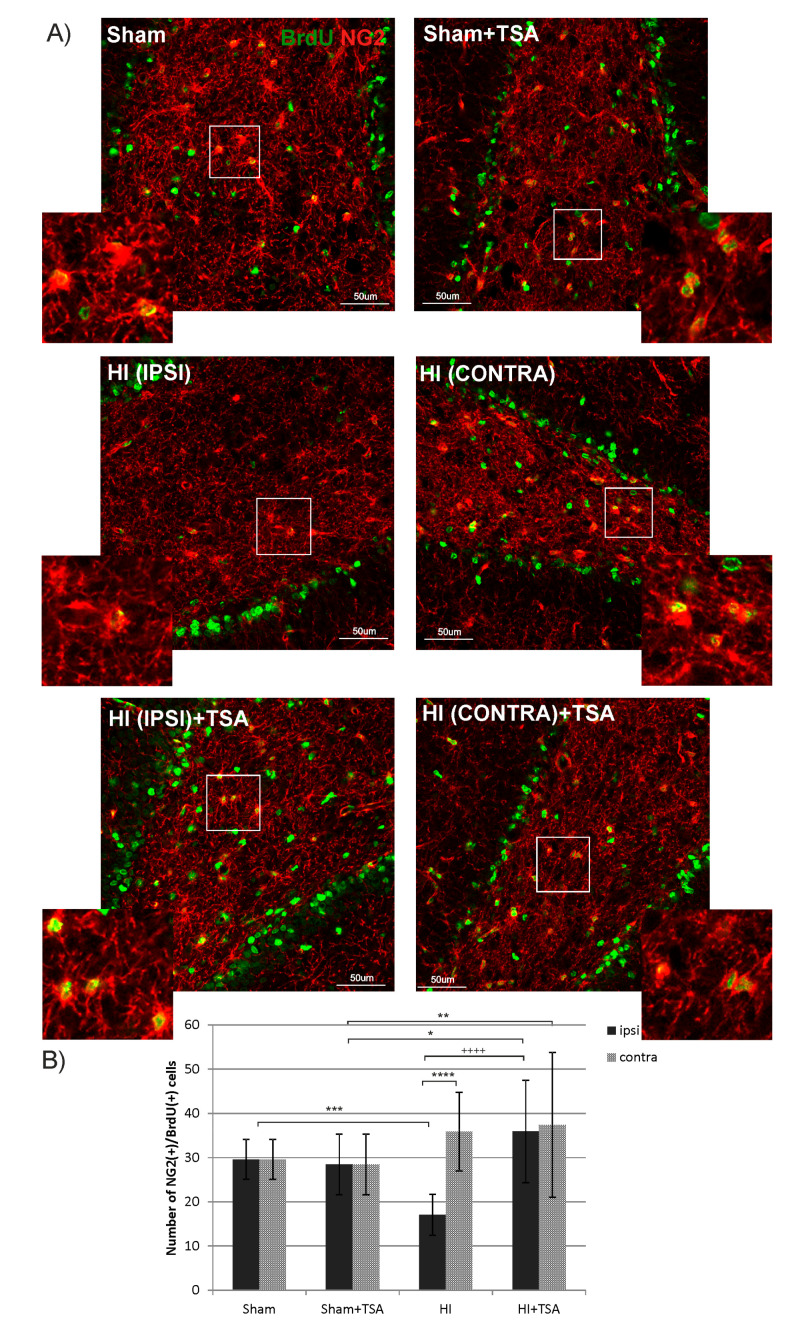
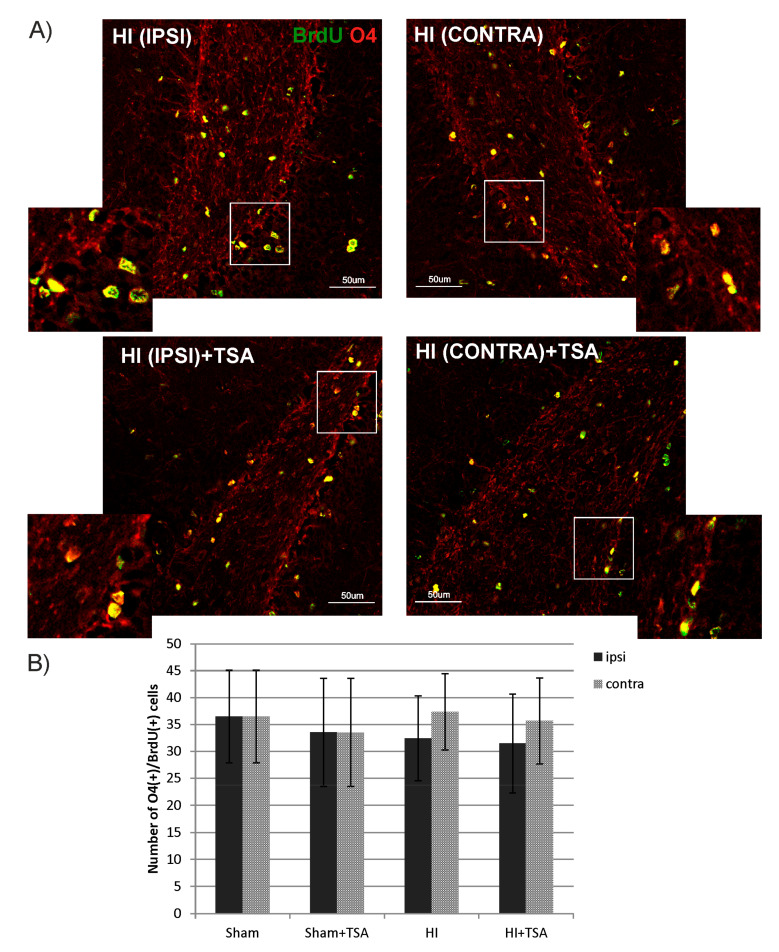
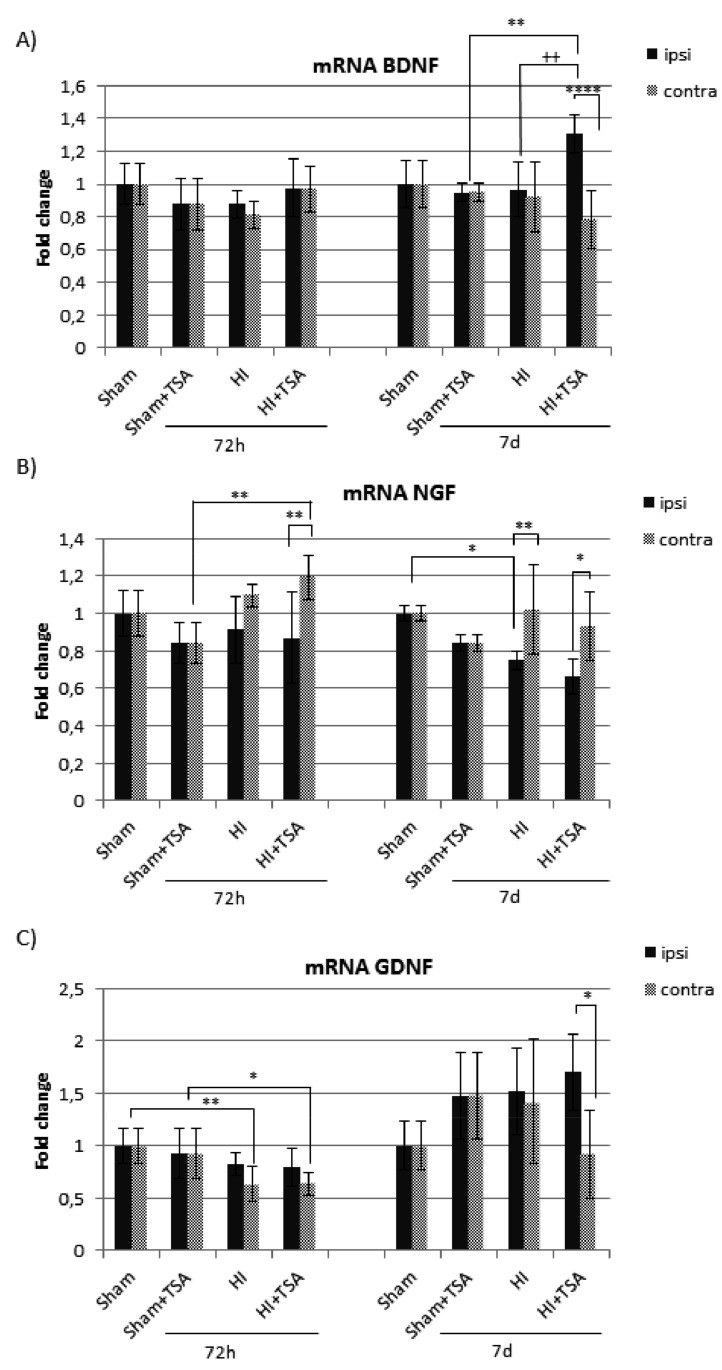
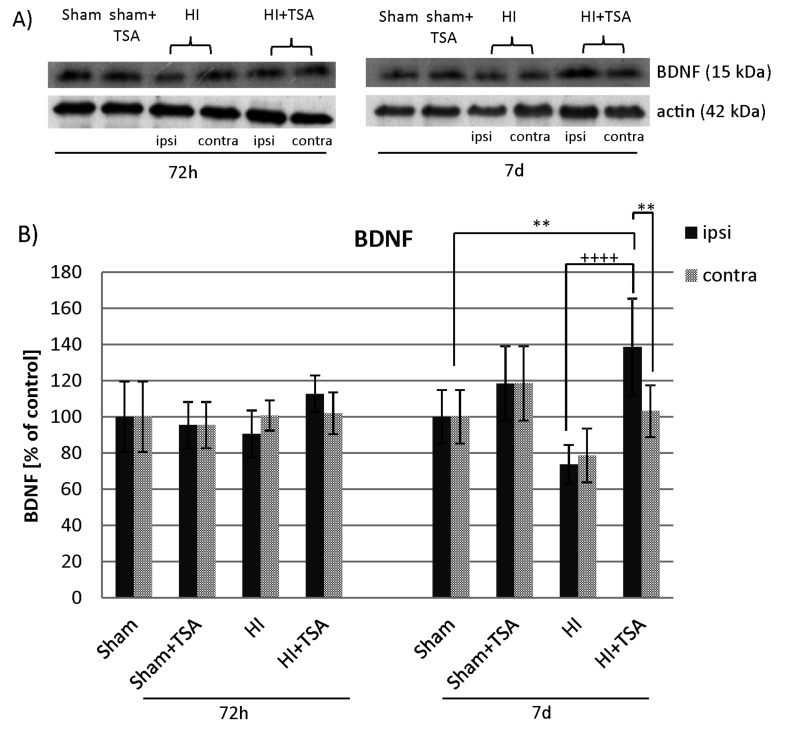
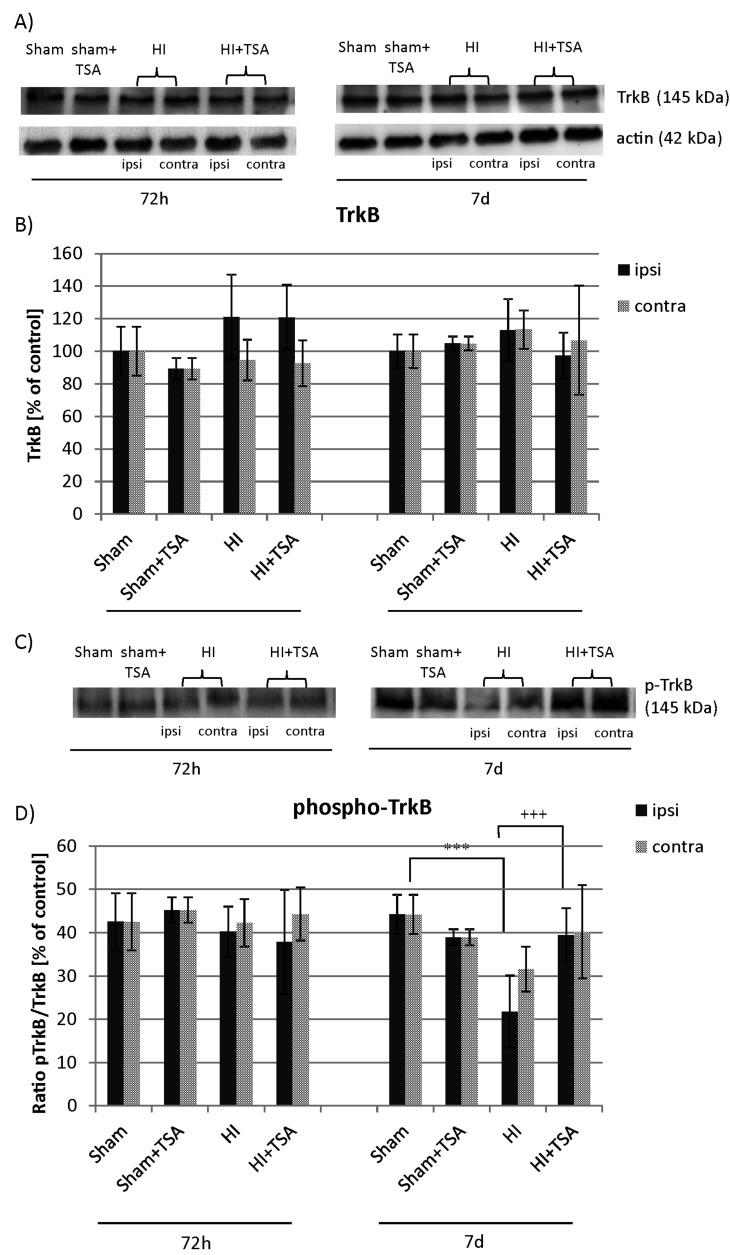
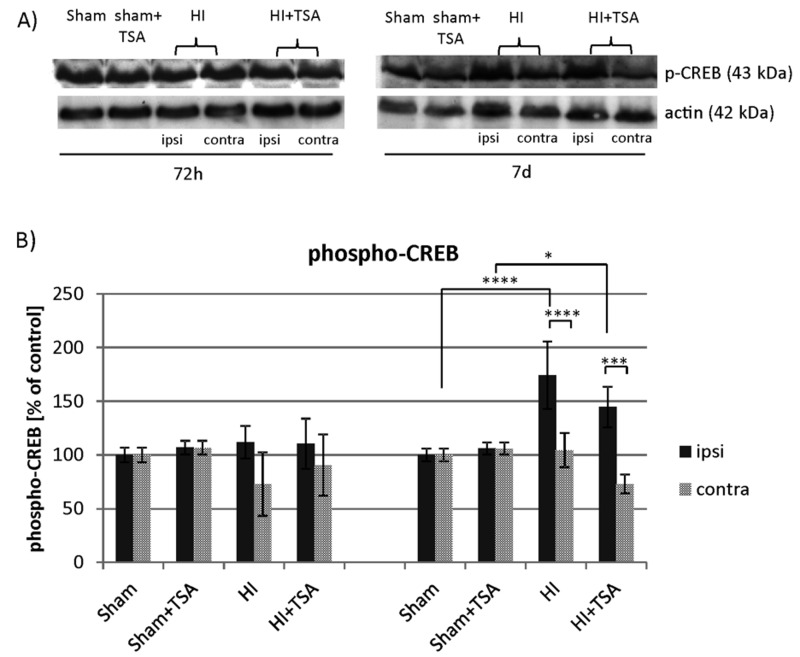
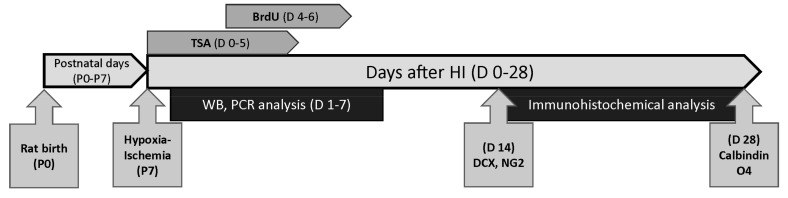
Hypoxia-ischemia (HI) in the neonatal brain frequently results in neurologic impairments, including cognitive disability. Unfortunately, there are currently no known treatment options to minimize ischemia-induced neural damage. We previously showed the neuroprotective/neurogenic potential of a histone deacetylase inhibitor (HDACi), sodium butyrate (SB), in a neonatal HI rat pup model. The aim of the present study was to examine the capacity of another HDACi-Trichostatin A (TSA)-to stimulate neurogenesis in the subgranular zone of the hippocampus. We also assessed some of the cellular/molecular processes that could be involved in the action of TSA, including the expression of neurotrophic factors (glial cell line-derived neurotrophic factor (GDNF), nerve growth factor (NGF), and brain-derived neurotrophic factor (BDNF)) as well as the TrkB receptor and its downstream signalling substrate- cAMP response element-binding protein (CREB). Seven-day-old rat pups were subjected to unilateral carotid artery ligation followed by hypoxia for 1 h. TSA was administered directly after the insult (0.2 mg/kg body weight). The study demonstrated that treatment with TSA restored the reduced by hypoxia-ischemia number of immature neurons (neuroblasts, BrdU/DCX-positive) as well as the number of oligodendrocyte progenitors (BrdU/NG2+) in the dentate gyrus of the ipsilateral damaged hemisphere. However, new generated cells did not develop the more mature phenotypes. Moreover, the administration of TSA stimulated the expression of BDNF and increased the activation of the TrkB receptor. These results suggest that BDNF-TrkB signalling pathways may contribute to the effects of TSA after neonatal hypoxic-ischemic injury.

Keywords: BDNF-TrkB pathway; CREB; neonatal hypoxia-ischemia; neurogenesis.


Conflict of interest statement

The authors declare no conflict of interest. The funders had no role in the design of the study; in the collection, analyses, or interpretation of data; in the writing of the manuscript, or in the decision to publish the results.

Figures

Figure 1
Figure 1
Effect of Trichostatin A (TSA) on the acetylation of Histone 3 (H3) and alpha tubulin after neonatal hypoxia-ischemia. (A,C) Representative immunoblots of acetylated H3 and alpha tubulin 24 h, 72 h and 7 days after HI, analyzed in experimental groups: sham-control (Sham), TSA-treated sham-control (Sham+TSA), hypoxia-ischemia (HI), TSA-treated hypoxia-ischemia (HI+TSA). The intensity of each band was quantified and normalized in relation to actin. (B,D) The graphs show the statistical analysis of densitometric data presented as a percent of the control value from indicated experimental groups. The values are mean ± SD from five animals per group and time point. Note the increased level of acetyl-alpha tubulin in ipsilateral hemisphere 72h after HI in TSA-treated rats compared to non-treated animals. The two-way ANOVA test indicates significant differences * p < 0.05 (effect of TSA treatment); ** p < 0.01 (effect of ischemia insult); Abbreviations: ipsi—ipsilateral, contra—contralateral.
Figure 2
Figure 2
TSA has no effect on cell proliferation in the subgranular zone of the hippocampus (SGZ) after hypoxia-ischemia. (A) The confocal photomicrographs show newly divided cells (BrdU-positive) in ipsilateral DG 14 and 28 days after HI (D14 and D28). (B) The graph shows the number of BrdU-labeled nuclei within the DG of sham-control and HI animals (D14) with or without TSA treatment. The values are the mean ± SD of five animals per experimental group. The two-way ANOVA test did not indicate significant differences in the number of BrdU-labeled nuclei within the DG area in all investigated groups.
Figure 3
Figure 3
Newly divided cells in the DG of sham-control animals. The confocal photomicrographs show double-labeled newly generated: (A) neuroblasts (DCX(+)/BrdU(+)); (B) mature neurons (calbindin(+)/BrdU(+)); (C) oligodendrocyte progenitor cells (NG2(+)/BrdU(+)); (D) oligodendrocytes (O4(+)/BrdU(+)); in the SGZ of sham-control rats at postnatal day 21 (P21). Scale bar 50 µm.
Figure 4
Figure 4
TSA increases the number of newborn neuroblasts in the SGZ after neonatal hypoxia-ischemia. (A) The confocal photomicrographs show double-labeled newly generated neuroblasts (DCX-positive) in the SGZ of sham-control and HI animals D14 with or without TSA treatment. Enlargements present areas marked in rectangles. Scale bar 50 µm. (B) The graph presents the number of BrdU/DCX-positive cells quantified in the SGZ area (0.36 mm2). The values are mean ± SD from 5 animals per experimental group. Two-way ANOVA tests indicate significant differences between investigated groups, *** p < 0.001, **** p < 0.0001 (effect of ischemia insult) and + p < 0.05; ++++ p < 0.0001 (effect of TSA treatment) .Abbreviations: ipsi—ipsilateral, contra— contralateral.
Figure 5
Figure 5
TSA does not affect the number of newborn granule neurons in the DG after HI. (A) The confocal photomicrographs show newly generated granule neurons (BrdU/calbindin positive) in the SGZ of sham-control and HI animals D28 with or without TSA treatment. Enlargements present areas marked in rectangles. Scale bar 50 µm. (B) The graph presents the number of BrdU/calbindin-positive cells quantified in the SGZ area (0.36 mm2). The values are mean ± SD from 5 animals per experimental group. One-way ANOVA tests indicate significant differences between investigated groups, **** p < 0.0001. Abbreviations: ipsi—ipsilateral, contra—contralateral.
Figure 6
Figure 6
TSA stimulates oligodendrocyte precursor cell proliferation in the DG of the rat hippocampus after HI. (A) The confocal photomicrographs show double-labeled (BrdU/NG2-positive) oligodendrocyte precursor cells in the DG of sham-control and HI animals D14 with or without TSA treatment. Enlargements present areas marked in rectangles. Scale bar 50 µm. (B) The graph shows the number of BrdU/NG2-positive cells quantified in the DG area (0.36 mm2). The values are mean ± SD from 5 animals per experimental group. Two-way ANOVA tests indicate significant differences between investigated groups, * p < 0.05; ** p < 0.01, *** p < 0.001, **** p < 0.0001 (effect of HI insult), ++++ p < 0.0001 (effect of TSA treatment). Abbreviations: ipsi—ipsilateral, contra—contralateral.
Figure 7
Figure 7
TSA does not affect the number of non-myelinating oligodendrocytes in DG after HI. (A) The confocal photomicrographs show double-labeled (BrdU/O4-positive) cells in DG of HI animals D28 with or without TSA treatment. Enlargements present areas marked in rectangles. Scale bar 50 µm. (B) The graph shows the number of BrdU/O4 labeled cells quantified in the DG area (0.36 mm2). Values represent mean ± SD of five animals per experimental group. Two-way ANOVA tests did not indicate significant differences in the number of BrdU/O4-positive cells between the investigated groups. Abbreviations: ipsi—ipsilateral, contra—contralateral.
Figure 8
Figure 8
Effect of TSA on mRNA expression of endogenous neurotrophic factors in the brain hemispheres after neonatal hypoxia-ischemia. Real-time RT-PCR was used to quantify neurotrophic factors: (A) (brain-derived neurotrophic factor (BDNF), (B) nerve growth factor (NGF) and (C) glial cell line-derived neurotrophic factor (GDNF)) gene expression in the rat brains 72 h and 7 days after hypoxic-ischemic insult. The fold change of the relative mRNA expression of each studied gene was calculated with the 2−ΔΔCT method. The data represent the normalized target gene amount relative to control, which is considered 1. Note the increase in BDNF mRNA expression in the ipsilateral hemisphere after TSA treatment at 7 days of recovery. The values are mean ± SD from 5 animals per group and time point assessed in triplicates. Two-way ANOVA tests indicate significant differences between investigated groups, * p < 0.05,** p < 0.01,**** p < 0.0001 (effect of HI insult), ++ p < 0.01 (effect of TSA treatment). Abbreviations: ipsi -ipsilateral, contra-contralateral.
Figure 9
Figure 9
Effect of TSA on the expression of BDNF protein in the brain hemispheres after HI. (A) Representative immunoblots of BDNF protein level. The intensity of each band was quantified and normalized in relation to actin. (B) The bar graphs represent the statistical analysis of immunoreactive bands estimated in indicated experimental groups: sham-control (Sham), TSA-treated sham-control (Sham+TSA), hypoxia-ischemia (HI), TSA-treated hypoxia-ischemia (HI+TSA). Note that TSA application increases the level of BDNF protein at 7 days of recovery. The values are mean ± SD from 5 animals per group and time point assessed in 3 independent experiments. Two-way ANOVA tests indicate significant differences between investigated groups, ** p < 0.01, ++++ p < 0.0001 (effect of TSA treatment). Abbreviations: ipsi—ipsilateral, contra—contralateral.
Figure 10
Figure 10
Effect of TSA on the expression of TrkB and phospho-TrkB in the brain hemispheres after HI. Representative immunoblots of total TrkB protein (A) and phosphorylated TrkB (C) level. The intensity of each band was quantified and normalized in relation to β-actin. The bar graphs (B and D) represent statistical analysis of immunoreactive bands estimated in indicated experimental groups: sham-control (Sham), TSA-treated sham-control (Sham+TSA), hypoxia-ischemia (HI), TSA-treated hypoxia-ischemia (HI+TSA). Note that TSA application increases the level of TrkB phosphorylation at 7 days of recovery. The values are mean ± SD from 5 animals per group and time point assessed in 3 independent experiments. Two-way ANOVA tests indicate significant differences between investigated groups, *** p < 0.001 (effect of HI insult), +++ p < 0.001 (effect of TSA treatment).. Abbreviations: ipsi—ipsilateral, contra—contralateral.
Figure 11
Figure 11
TSA has no effect on CREB phosphorylation after neonatal hypoxia-ischemia. (A) Representative immunoblot of phospho-CREB protein level after TSA treatment in sham-control and HI animals. The intensity of each band was quantified and normalized in relation to actin. (B) The bar graphs represent the statistical analysis of immunoreactive bands estimated in four experimental groups: sham-control (Sham), TSA-treated sham-control (Sham+TSA), hypoxia-ischemia (HI), TSA-treated hypoxia-ischemia (HI+TSA). Note the increase in CREB phosphorylation in ipsilateral hemisphere 7 days after HI, regardless of TSA application. The values are mean ± SD from 5 animals per group and time point assessed in 3 independent experiments. Two-way ANOVA tests indicate significant differences between investigated groups, * p < 0.05, *** p < 0.001, **** p < 0.0001. Abbreviations: ipsi—ipsilateral, contra—contralateral.
Figure 12
Figure 12
Diagram of experiment design in the present studyNeonatal hypoxia-ischemia was induced in 7-day-old (P7) Wistar rat pups. Sham-control and HI animals were subcutaneously injected with TSA (0.2 mg/kg body weight) or vehicle (10% DMSO in saline) at the same volume starting immediately after hypoxic exposure and lasting for 5 consecutive days (D 0–5). All animals dedicated to immunohistochemical studies received twice-daily intraperitoneal injections of BrdU (4–6 day after HI (D 4–6)). Animals in this group were perfused transcardially with 4% PFA 14 (D14) or 28 (D28) days after HI, and immunohistochemical analysis was performed. Western lot and PCR analysis were performed on non-perfused brains (1, 3 7 days after the insult (D 1–7)).

Similar articles

Cited by

References

    1. Allen K.A., Brandon D.H. Hypoxic Ischemic Encephalopathy: Pathophysiology and Experimental Treatments. Newborn Infant Nurs. Rev. 2011;11:125–133. doi: 10.1053/j.nainr.2011.07.004. - DOI - PMC - PubMed
    1. Natarajan G., Laptook A., Shankaran S. Therapeutic Hypothermia. Clin. Perinatol. 2018;45:241–255. doi: 10.1016/j.clp.2018.01.010. - DOI - PMC - PubMed
    1. Gunn A.J., Laptook A.R., Robertson N.J., Barks J., Thoresen M., Wassink G., Bennet L. Therapeutic hypothermia translates from ancient history in to practice. Pediatr. Res. 2016;81:202–209. doi: 10.1038/pr.2016.198. - DOI - PMC - PubMed
    1. Kadam S., Mulholland J., McDonald J., Comi A.M. Neurogenesis and neuronal commitment following ischemia in a new mouse model for neonatal stroke. Brain Res. 2008;1208:35–45. doi: 10.1016/j.brainres.2008.02.037. - DOI - PMC - PubMed
    1. Ong J., Plane J.M., Parent J.M., Silverstein F.S. Hypoxic-Ischemic Injury Stimulates Subventricular Zone Proliferation and Neurogenesis in the Neonatal Rat. Pediatr. Res. 2005;58:600–606. doi: 10.1203/01.PDR.0000179381.86809.02. - DOI - PubMed

MeSH terms